. 2023 May 10;24(10):8521.
doi: 10.3390/ijms24108521.

Supplementation with a New Standardized Extract of Green and Black Tea Exerts Antiadipogenic Effects and Prevents Insulin Resistance in Mice with Metabolic Syndrome

Affiliations

Supplementation with a New Standardized Extract of Green and Black Tea Exerts Antiadipogenic Effects and Prevents Insulin Resistance in Mice with Metabolic Syndrome

Mario De la Fuente-Muñoz et al. Int J Mol Sci. .

Abstract

Insulin resistance is one of the main characteristics of metabolic syndrome (MetS) and the main cause of the development of type II diabetes. The high prevalence of this syndrome in recent decades has made it necessary to search for preventive and therapeutic agents, ideally of natural origin, with fewer side effects than conventional pharmacological treatments. Tea is widely known for its medicinal properties, including beneficial effects on weight management and insulin resistance. The aim of this study was to analyze whether a standardized extract of green and black tea (ADM® Complex Tea Extract (CTE)) prevents the development of insulin resistance in mice with MetS. For this purpose, C57BL6/J mice were fed for 20 weeks with a standard diet (Chow), a diet with 56% kcal from fat and sugar (HFHS) or an HFHS diet supplemented with 1.6% CTE. CTE supplementation reduced body weight gain, adiposity and circulating leptin levels. Likewise, CTE also exerted lipolytic and antiadipogenic effects in 3T3-L1 adipocyte cultures and in the C. elegans model. Regarding insulin resistance, CTE supplementation significantly increased plasma adiponectin concentrations and reduced the circulating levels of insulin and the HOMA-IR. Incubation of liver, gastrocnemius muscle and retroperitoneal adipose tissue explants with insulin increased the pAkt/Akt ratio in mice fed with Chow and HFHS + CTE but not in those fed only with HFHS. The greater activation of the PI3K/Akt pathway in response to insulin in mice supplemented with CTE was associated with a decrease in the expression of the proinflammatory markers Mcp-1, IL-6, IL-1β or Tnf-α and with an overexpression of the antioxidant enzymes Sod-1, Gpx-3, Ho-1 and Gsr in these tissues. Moreover, in skeletal muscle, mice treated with CTE showed increased mRNA levels of the aryl hydrocarbon receptor (Ahr), Arnt and Nrf2, suggesting that the CTE's insulin-sensitizing effects could be the result of the activation of this pathway. In conclusion, supplementation with the standardized extract of green and black tea CTE reduces body weight gain, exerts lipolytic and antiadipogenic effects and reduces insulin resistance in mice with MetS through its anti-inflammatory and antioxidant effects.

Keywords: antioxidant; black tea; extract; green tea; insulin resistance; metabolic syndrome; obesity.


Conflict of interest statement

Since this work was carried out in collaboration with the company ADM Wild, authors from this company may have conflict of interest. These authors have participated in the characterization and production of the extracts and in the studies of adipogenesis in the C. elegans model and in 3T3-L1 adipocytes. The in vivo study was performed by academic researchers from the Universidad Autónoma de Madrid, who do not have conflict of interest.

Figures

Figure 1
Figure 1
Fat content measured by Oil Red O staining in preadipocytes 3T3-L1 cells and differentiated 3T3-L1 cells treated or not with EGCG and CTE (A), fat content as % of fluorescence produced by Nile red staining vs. NGM (B), and triglyceride content as % vs. NGM (C) in nematodes fed with Escherichia coli OP50 and orlistat or CTE. Data are represented as the mean ± SD. * p < 0.05 vs. preadipocytes; *** p < 0.001 vs. preadipocytes; ### p < 0.001 vs. non-treated adipocytes; $$$ p < 0.001 vs. EGCG; + p < 0.05 vs. NGM; ++ p < 0.01 vs. NGM; +++ p < 0.001 vs. NGM; ? p < 0.05 vs. Orlistat; ??? p < 0.001 vs. Orlistat. CTE: Complex Tea Extract; EGCG: epigallocatechin gallate; NGM: nematode growth media.
Figure 2
Figure 2
Evolution of body weight during the 20 weeks of treatment (A). Body weight gain during the treatment (B). Total food intake per mouse during the treatment (C). Total caloric intake per mouse during the treatment (D) of mice fed a standard chow (Chow), a high-fat diet/sucrose diet (HFHS) and high-fat diet/sucrose diet supplemented with Complex Tea Extract (HFHS + TCE). Values are represented as mean ± SEM; n = 8–10 mice/group. *** p < 0.001 vs. chow; # p < 0.05 vs. HFHS.
Figure 3
Figure 3
p-Akt/Akt ratio (A) in liver explants of mice fed a standard chow (Chow), a high-fat diet/sucrose diet (HFHS) and high-fat diet/sucrose diet supplemented with Complex Tea Extract (HFHS + TCE) after 15 min of incubation with or without 10−6 M insulin. mRNA levels of insulin receptor and Glycogen synthase 1 (B) in liver. Values are represented as mean ± SEM; n = 8–10 mice/group. $$ p < 0.01 vs. Control; $$$ p < 0.001 vs. Control; * p < 0.05 vs. chow; ** p < 0.01 vs. chow; # p < 0.05 vs. HFHS; ## p < 0.01 vs. HFHS.
Figure 4
Figure 4
mRNA levels of Monocyte Chemotactic Protein-1, Interleukin 1β, 6, 10 and Tumor Necrosis Factor α (A), NADPH oxidase 1 and 4, Super Oxide Dismutase 1, Glutathione Peroxidase and Reductase, Hemoxigenase-1 (B) in hepatic tissue of mice fed a standard chow (Chow), a high-fat diet/sucrose diet (HFHS) and high-fat diet/sucrose diet supplemented with Complex Tea Extract (HFHS + TCE). Values are represented as mean ± SEM; n = 8–10 mice/group. * p < 0.05 vs. chow; ** p < 0.01 vs. chow; *** p < 0.001 vs. chow; # p < 0.05 vs. HFHS; ## p < 0.01 vs. HFHS.
Figure 5
Figure 5
pAkt/Akt ratio (A) in gastrocnemius muscle after 15 min of explant incubation with or without 10−6 M insulin of mice fed a standard chow (Chow), a high-fat diet/sucrose diet (HFHS) and high-fat diet/sucrose diet supplemented with Complex Tea Extract (HFHS + TCE). mRNA levels of insulin receptor and Glycogen synthase 1 (B) in gastrocnemius muscle. Values are represented as mean ± SEM; n = 8–10 mice/group. $ p < 0.05 vs. Control; $$ p < 0.01 vs. Control; $$$ p < 0.001 vs. Control; * p < 0.05 vs. chow; ** p < 0.01 vs. chow; # p < 0.01 vs. HFHS.
Figure 6
Figure 6
mRNA levels of Monocyte Chemotactic Protein-1, Interleukin 1β, 6, 10 and Tumor Necrosis Factor α (A), NADPH oxidase 1 and 4, Super Oxide Dismutase 1, Glutathione Peroxidase and Reductase, Hemoxygenase-1 (B) in gastrocnemius muscle of mice fed a standard chow (Chow), a high-fat diet/sucrose diet (HFHS) and high-fat diet/sucrose diet supplemented with Complex Tea Extract (HFHS + TCE). Values are represented as mean ± SEM; n = 8–10 mice/group. * p < 0.05 vs. chow; ** p < 0.01 vs. chow; # p < 0.05 vs. HFHS; ## p < 0.01 vs. HFHS.
Figure 7
Figure 7
Size of adipocytes and representative images of H/E dying in sections of visceral adipose tissue (A). The scale bar is equivalent to 200 µm. mRNA levels of Fatty acid synthase, Lipoprotein lipase, Hormone-sensitive lipase, peroxisome proliferator activated receptor, PPAR-γ coactivator-1α, Uncoupling Protein-1, β-3-adrenergic receptor and Leptin receptor (B) in retroperitoneal adipose tissue of mice fed a standard chow (Chow), a high-fat diet/sucrose diet (HFHS) and high-fat diet/sucrose diet supplemented with Complex Tea Extract (HFHS + TCE). Values are represented as mean ± SEM; n = 8–10 mice/group. * p < 0.05 vs. chow; ** p < 0.01 vs. chow; *** p < 0.001 vs. chow; # p < 0.05 vs. HFHS; ## p < 0.01 vs. HFHS.
Figure 8
Figure 8
pAkt/Akt ratio (A) in retroperitoneal adipose tissue of mice fed a standard chow (Chow), a high-fat diet/sucrose diet (HFHS) and high-fat diet/sucrose diet supplemented with Complex Tea Extract (HFHS + TCE) after 15 min of explant incubation with or without 10−6 M insulin. mRNA levels of insulin receptor in retroperitoneal adipose tissue (B). The scale bar is equivalent to 200 µm. Values are represented as mean ± SEM; n = 8–10 mice/group. $ p < 0.05 vs. Control; $$ p < 0.01 vs. Control; *** p < 0.001 vs. chow; ## p < 0.01 vs. HFHS.
Figure 9
Figure 9
mRNA levels of Monocyte Chemotactic Protein-1, Interleukin 1β, 6, 10 and Tumor Necrosis Factor α (A), NADPH oxidase 1 and 4, Super Oxide Dismutase 1, Glutathione Peroxidase and Reductase, and Hemoxigenase-1 (B) in retroperitoneal adipose tissue of mice fed a standard chow (Chow), a high-fat diet/sucrose diet (HFHS) and high-fat diet/sucrose diet supplemented with Complex Tea Extract (HFHS + TCE). Values are represented as mean ± SEM; n = 8–10 mice/group. * p < 0.05 vs. chow; ** p < 0.01 vs. chow; *** p < 0.001 vs. chow; # p < 0.05 vs. HFHS; ### p < 0.001 vs. HFHS.
Figure 10
Figure 10
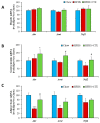
Hepatic (A), gastrocnemius muscle (B) and retroperitoneal adipose tissue (C) mRNA levels of Aryl Hydrocarbon Receptor, Aryl Hydrocarbon Receptor Nuclear and Nuclear factor erythroid 2-related factor 2 (C) of mice fed a standard chow (Chow), a high-fat diet/sucrose diet (HFHS) and high-fat diet/sucrose diet supplemented with Complex Tea Extract (HFHS + TCE). Values are represented as mean ± SEM; n = 8–10 mice/group. * p < 0.05 vs. chow; *** p < 0.001 vs. chow; # p < 0.05 vs. HFHS.

References

    1. WHO. 2016. [(accessed on 27 March 2023)]. Available online: https://www.who.int/news-room/fact-sheets/detail/obesity-and-overweight.
    1. Withrow D., Alter D.A. The economic burden of obesity worldwide: A systematic review of the direct costs of obesity. Obes. Rev. 2011;12:131–141. doi: 10.1111/j.1467-789X.2009.00712.x. - DOI - PubMed
    1. Huang P.L. A comprehensive definition for metabolic syndrome. Dis. Model. Mech. 2009;2:231–237. doi: 10.1242/dmm.001180. - DOI - PMC - PubMed
    1. Saklayen M.G. The Global Epidemic of the Metabolic Syndrome. Curr. Hypertens. Rep. 2018;20:12. doi: 10.1007/s11906-018-0812-z. - DOI - PMC - PubMed
    1. da Silva Rosa S.C., Nayak N., Caymo A.M., Gordon J.W. Mechanisms of muscle insulin resistance and the cross-talk with liver and adipose tissue. Physiol. Rep. 2020;8:e14607. doi: 10.14814/phy2.14607. - DOI - PMC - PubMed

MeSH terms