. 2023 May 10;24(10):8543.
doi: 10.3390/ijms24108543.

Old Drug, New Delivery Strategy: MMAE Repackaged

Affiliations

Old Drug, New Delivery Strategy: MMAE Repackaged

Hanane Lahnif et al. Int J Mol Sci. .

Abstract

Targeting therapy is a concept that has gained significant importance in recent years, especially in oncology. The severe dose-limiting side effects of chemotherapy necessitate the development of novel, efficient and tolerable therapy approaches. In this regard, the prostate specific membrane antigene (PSMA) has been well established as a molecular target for diagnosis of, as well as therapy for, prostate cancer. Although most PSMA-targeting ligands are radiopharmaceuticals used in imaging or radioligand therapy, this article evaluates a PSMA-targeting small molecule-drug conjugate, and, thus, addresses a hitherto little-explored field. PSMA binding affinity and cytotoxicity were determined in vitro using cell-based assays. Enzyme-specific cleavage of the active drug was quantified via an enzyme-based assay. Efficacy and tolerability in vivo were assessed using an LNCaP xenograft model. Histopathological characterization of the tumor in terms of apoptotic status and proliferation rate was carried out using caspase-3 and Ki67 staining. The binding affinity of the Monomethyl auristatin E (MMAE) conjugate was moderate, compared to the drug-free PSMA ligand. Cytotoxicity in vitro was in the nanomolar range. Both binding and cytotoxicity were found to be PSMA-specific. Additionally, complete MMAE release could be reached after incubation with cathepsin B. In vivo, the MMAE conjugate displayed good tolerability and dose-dependent inhibition of tumor growth. Immunohistochemical and histological studies revealed the antitumor effect of MMAE.VC.SA.617, resulting in the inhibition of proliferation and the enhancement of apoptosis. The developed MMAE conjugate showed good properties in vitro, as well as in vivo, and should, therefore, be considered a promising candidate for a translational approach.

Keywords: MMAE; PSMA; drug targeting; prostate cancer; small molecule–drug conjugates; therapeutic efficacy.


Conflict of interest statement

The authors declare no conflict of interest.

Figures

Figure 1
Figure 1
Synthesis of MMAE.VC.SA.617. In the first step, the primary amine of the terminal valine of MMAE.VC was conjugated to squaric acid diethyl ester through an asymmetric amidation in an aqueous phosphate buffer at pH 7. To improve the solubility of MMAE.VC, DMSO was added. The reaction resulted in a quantitative conversion of MMAE.VC to MMAE.VC.SA monitored by LC-MS. In the second step, MMAC.VC.SA, as well as NH2-KuE-617, were dissolved in ethanol and, in the presence of triethylamine, the second asymmetric amidation took place. MMAC.VC.SA.617 was isolated in a 43% yield by semi-preparative HPLC purification.
Figure 2
Figure 2
Concentration-inhibition curve of MMAE.VC.SA.617 compared to MMAE.VC.SA.617 + PMPA (n = 3). Note: cpm: counts per minute.
Figure 3
Figure 3
Immunofluorescent staining of α-tubulin (green) with Alexa fluor 488 α-tubulin antibody. Cell nuclei were counterstained with DAPI (blue). Images were taken at 20× magnification. LNCaP cells were used as control (a), incubated with either 1 nM MMAE (b), or 100 nM MMAE.VC.SA.617 (c). PSMA-specific effect was determined by co-incubation of 100 µM PMPA (d).
Figure 4
Figure 4
(a) Quantification of MMAE release after incubation with cathepsin B at 37 °C; (b) control experiment: stability of MMAE.VC.SA.617 in PBS without incubation with cathepsin B.
Figure 5
Figure 5
Body-weight change (a) and survival curve (b) of NOD/SCID mice after one intravenous (i.v.) injection of 1 mg/kg MMAE (n = 3 mice per group).
Figure 6
Figure 6
Timeline of therapeutic protocol and assessment of therapeutic outcome. LNCaP cells were inoculated into NOD/SCID mice. At different time points mice were injected with 0.1 mg/kg, 0.5 mg/kg or 1.0 mg/kg MMAE.VC.SA.617 in the verum group or. 0.1 mg/kg and 0.5 mg/kg MMAE in the reference group. Mice in the control group received 0.9% NaCl.
Figure 7
Figure 7
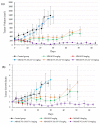
Therapeutic efficacy study of MMAE and MMAE.VC.SA.617 in LNCaP prostate cancer xenografts. Mice were intravenously injected through the tail vein. Treatments were performed on day 0, 4, 7, 11, 14, 18, 25 and 32 (eight doses). Each group had 4 NOD/SCID mice. The plots of each group have different endpoints corresponding to animal death. (a): Tumor Volume; (b): Tumor Growth Index (TGI); (c): Percentage body weight change of mice.
Figure 7
Figure 7
Therapeutic efficacy study of MMAE and MMAE.VC.SA.617 in LNCaP prostate cancer xenografts. Mice were intravenously injected through the tail vein. Treatments were performed on day 0, 4, 7, 11, 14, 18, 25 and 32 (eight doses). Each group had 4 NOD/SCID mice. The plots of each group have different endpoints corresponding to animal death. (a): Tumor Volume; (b): Tumor Growth Index (TGI); (c): Percentage body weight change of mice.
Figure 8
Figure 8
Kaplan–Meier survival curves of NOD/SCID mice. The mice of the 1.0 mg/kg MMAE.VC.SA.617 therapy group survived until the end of the experiment (Day 63 of treatment). On the contrary, the mice in the 0.5 mg/kg MMAE group had to be euthanized on day 12, because the repeated intravenous administrations of MMAE resulted in drastic decrease in body weight.
Figure 9
Figure 9
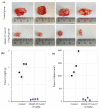
(a) Representative images of excised tumors: Upper panel—Control group of mice injected with 0.9% NaCl; Lower panel—Therapy group of mice injected with 1.0 mg/kg MMAE.VC.SA.617. Reduction in weight (b) and volume (c) of the tumors of the control group versus the 1.0 mg/kg MMAE.VC.SA.617 treated group.
Figure 10
Figure 10
Representative images of the control and MMAE.VC.SA.617-treated tumors (1 mg/kg body weight). Panel (a,b) indicate the histology of the tumors stained with Hematoxylin and Eosin. The stars in (a) indicate the central necrotic area of the tumors. In (c,d) the Ki67 staining was visualized with DAB (3,3′-Diaminobenzidine) indicating similar growth rates in the periphery of the tumors. In (e,f) the caspase 3 staining, also visualized with DAB, indicate a higher apoptotic rate of the treated tumors. In (g,h) the graphs show the actual % percentages of the proliferating and apoptotic cells respectively. Scale bar 300 μm. * p < 0.05.

References

    1. Krementz E.T., Kokame G.M., Iglesias F. Current status of chemotherapy of cancer. Postgrad. Med. 1964;35:384–394. doi: 10.1080/00325481.1964.11695085. - DOI - PubMed
    1. Brockman R.W. Mechanisms of Resistance to Anticancer Agents. Adv. Cancer Res. 1963;7:129–234. - PubMed
    1. Nissim A., Chernajovsky Y. Historical development of monoclonal antibody therapeutics. Handb. Exp. Pharmacol. 2008;181:3–18. - PubMed
    1. Firer M.A., Gellerman G. Targeted drug delivery for cancer therapy: The other side of antibodies. J. Hematol. Oncol. 2012;5:70. doi: 10.1186/1756-8722-5-70. - DOI - PMC - PubMed
    1. Govindan S.V., Goldenberg D.M. Designing immunoconjugates for cancer therapy. Expert Opin. Biol. Ther. 2012;12:873–890. doi: 10.1517/14712598.2012.685153. - DOI - PubMed