. 2023 May 11;24(10):8629.
doi: 10.3390/ijms24108629.

Potential Role of the mTORC1-PGC1α-PPARα Axis under Type-II Diabetes and Hypertension in the Human Heart

Affiliations

Potential Role of the mTORC1-PGC1α-PPARα Axis under Type-II Diabetes and Hypertension in the Human Heart

Tianyu Hang et al. Int J Mol Sci. .

Abstract

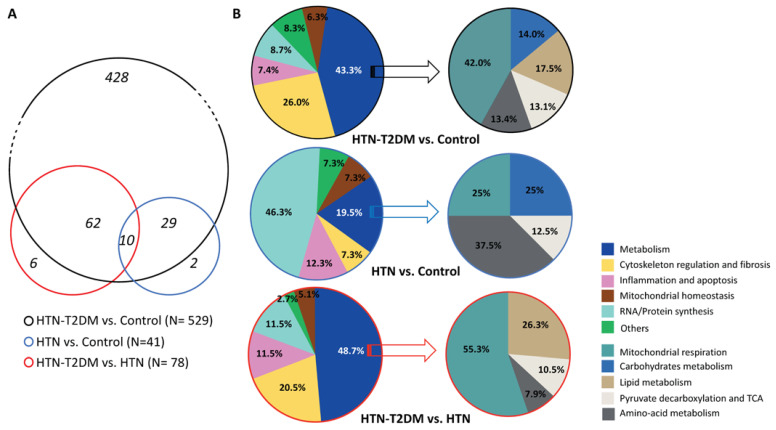
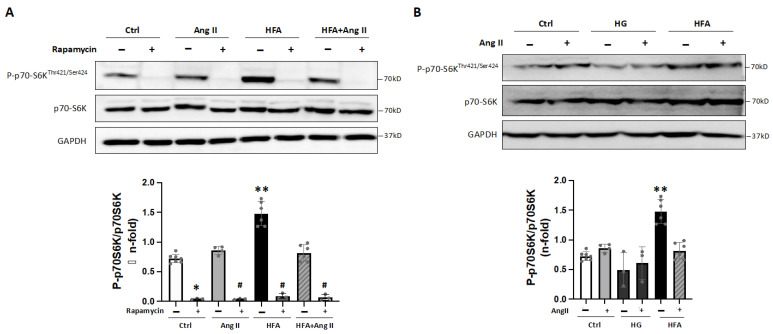
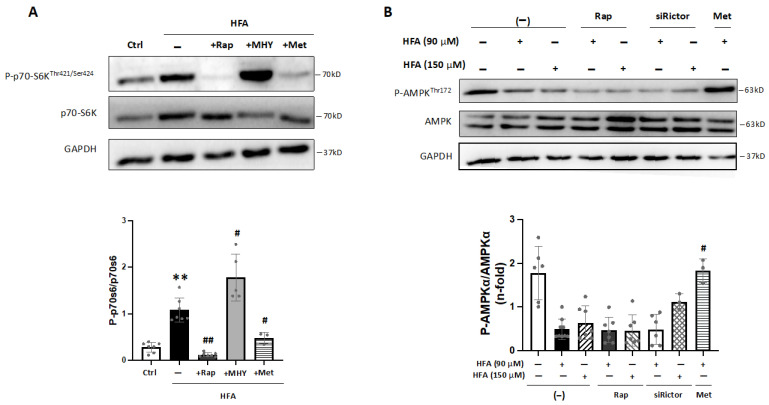
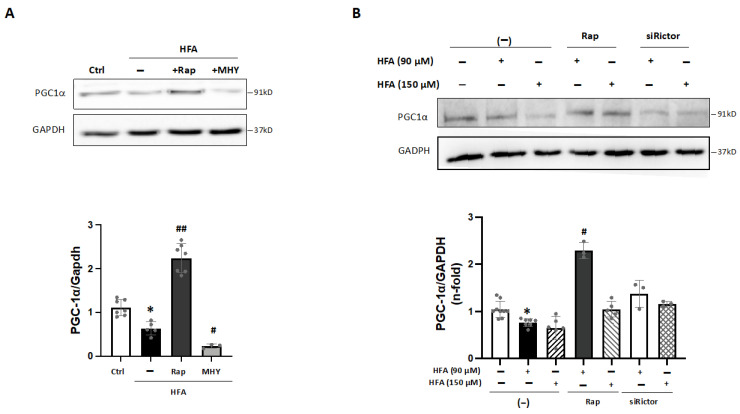
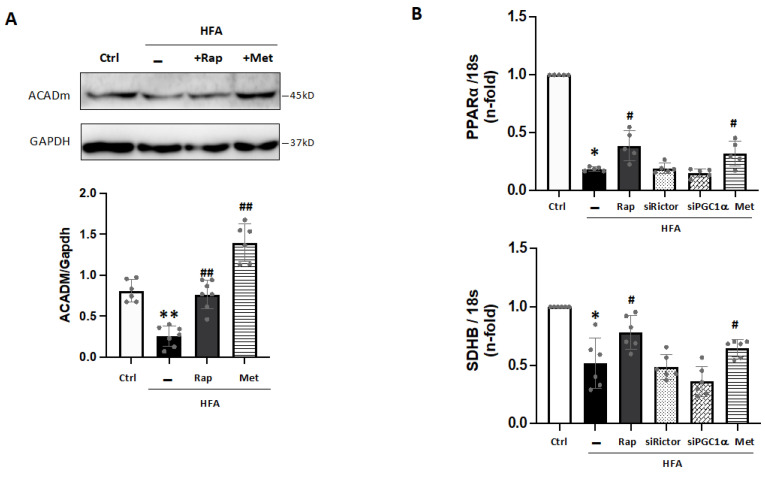
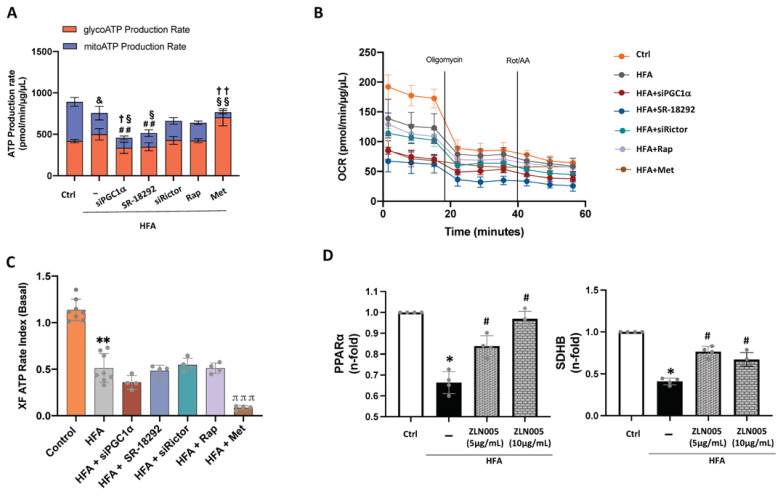
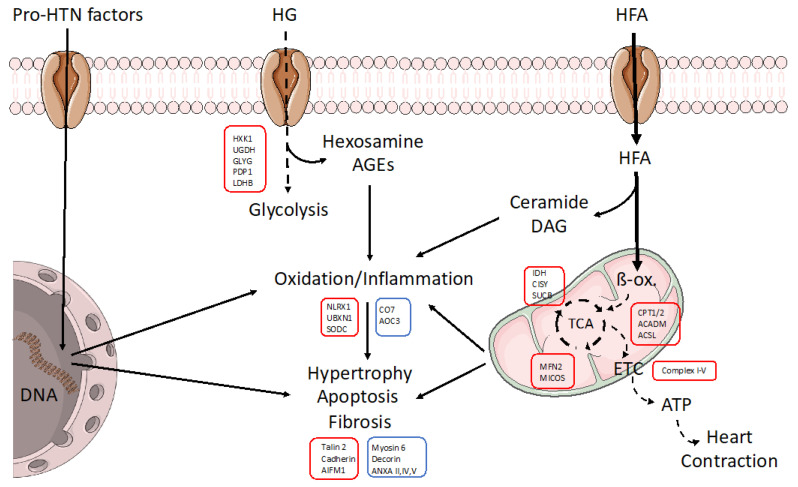
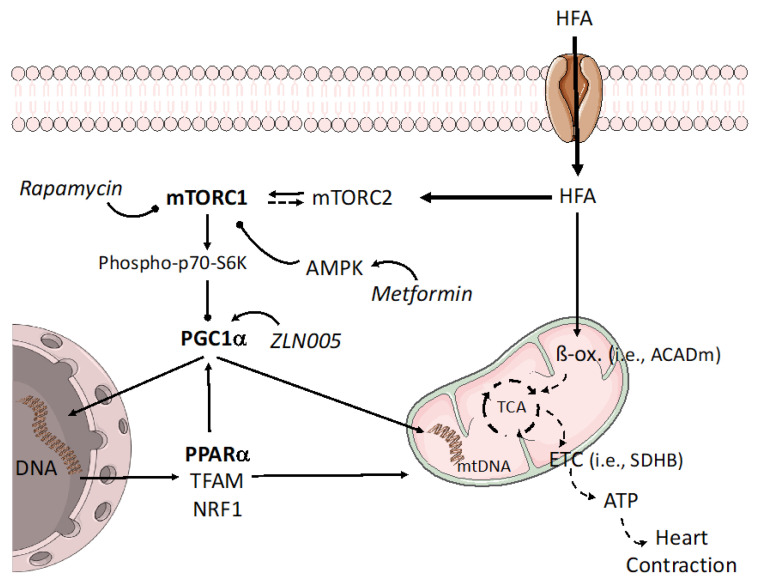
Type-2 diabetes (T2DM) and arterial hypertension (HTN) are major risk factors for heart failure. Importantly, these pathologies could induce synergetic alterations in the heart, and the discovery of key common molecular signaling may suggest new targets for therapy. Intraoperative cardiac biopsies were obtained from patients with coronary heart disease and preserved systolic function, with or without HTN and/or T2DM, who underwent coronary artery bypass grafting (CABG). Control (n = 5), HTN (n = 7), and HTN + T2DM (n = 7) samples were analysed by proteomics and bioinformatics. Additionally, cultured rat cardiomyocytes were used for the analysis (protein level and activation, mRNA expression, and bioenergetic performance) of key molecular mediators under stimulation of main components of HTN and T2DM (high glucose and/or fatty acids and angiotensin-II). As results, in cardiac biopsies, we found significant alterations of 677 proteins and after filtering for non-cardiac factors, 529 and 41 were changed in HTN-T2DM and in HTN subjects, respectively, against the control. Interestingly, 81% of proteins in HTN-T2DM were distinct from HTN, while 95% from HTN were common with HTN-T2DM. In addition, 78 factors were differentially expressed in HTN-T2DM against HTN, predominantly downregulated proteins of mitochondrial respiration and lipid oxidation. Bioinformatic analyses suggested the implication of mTOR signaling and reduction of AMPK and PPARα activation, and regulation of PGC1α, fatty acid oxidation, and oxidative phosphorylation. In cultured cardiomyocytes, an excess of the palmitate activated mTORC1 complex and subsequent attenuation of PGC1α-PPARα transcription of β-oxidation and mitochondrial electron chain factors affect mitochondrial/glycolytic ATP synthesis. Silencing of PGC1α further reduced total ATP and both mitochondrial and glycolytic ATP. Thus, the coexistence of HTN and T2DM induced higher alterations in cardiac proteins than HTN. HTN-T2DM subjects exhibited a marked downregulation of mitochondrial respiration and lipid metabolism and the mTORC1-PGC1α-PPARα axis might account as a target for therapeutical strategies.

Keywords: cardiomyopathy; hypertension; mTOR complexes; type-II diabetes.


Conflict of interest statement

The authors declare no conflict of interest.

Figures

Figure 1
Figure 1
Cardiac proteomic patterns under HTN and HTN-T2DM. (A) The number of significantly altered proteins (p < 0.05) found in HTN-T2DM vs. control (black circle), HTN vs. control (blue circle), and HTN-T2DM vs. HTN (red circle). (B, left) The distribution of changed proteins in relation to metabolism, cytoskeleton regulation, inflammation and apoptosis, mitochondrial physiology, RNA/Protein synthesis, and others of the three comparative groups (black, blue, and red). (B, right) The distribution of metabolic proteins clustered by mitochondrial respiration, carbohydrates metabolism, lipid metabolism, pyruvate decarboxylation and TCA, and amino-acid metabolism of the three comparative groups (black, blue, and red). HTN-T2DM (n = 7), HTN (n = 7), and Control (n = 5). The student’s t-test was used to compare the mean of measurements between both groups.
Figure 2
Figure 2
High fatty acids as a major activator of mTORC1 in cardiomyocytes. (A) Protein expression of Phospho-p70-S6KThr421/Ser424 and p70-S6K under Angiotensin II and/or HFA stimulation for 24 h. Some cells were also preincubated with rapamycin. GAPDH was used as a protein loading control. * p < 0.05 and ** p < 0.01 vs. control, # p < 0.05 vs. AngII, HFA or HFA + AngII. (B) Expression of Phospho-p70-S6KThr421/Ser424 and p70-S6K after high D-glucose (HG) or HFA and/or Angiotensin II. ** p < 0.01 vs. control. The data distribution was analyzed by the Shapiro–Wilk test. The non-parametric variables were studied by using the Kruskal–Wallis test, following Dunn’s multiple comparisons test, and p < 0.05 was considered significant.
Figure 3
Figure 3
Role of AMPK in the HFA-induced mTORC1 activation. (A) Protein levels of Phospho-p70-S6KThr421/Ser424 and p70-S6K after HFA incubation in cardiomyocytes. Some cells were also pre-treated with rapamycin, MHY1485, or metformin. GAPDH was used as a protein loading control. ** p < 0.01 vs. control, # p < 0.05 and ## p < 0.01 vs. HFA. (B) Protein levels of Phospho-AMPKThr172 and AMPK after HFA incubation (90 and 150 μM). Some cells were preincubated with rapamycin, siRictor, or metformin. # p < 0.05 vs. HFA (90 μM). The data distribution was studied by the Shapiro–Wilk test, and non-parametric variables were analyzed by using the Kruskal–Wallis test, following Dunn’s multiple comparisons test. p < 0.05 was considered significant.
Figure 4
Figure 4
Regulation of PGC1α under HFA-mTORC1 stimulation in cardiomyocytes. (A) Expression of PGC1α in cardiomyocytes after HFA and/or preincubation with rapamycin or MHY1485. * p < 0.05 vs. control, # p < 0.05 and ## p < 0.01 vs. HFA. (B) Expression of PGC1α after HFA (90–150 μM) with/without preincubation with rapamycin or siRictor. * p < 0.05 vs. control, # p < 0.05 vs. HFA. The data distribution was analyzed by the Shapiro–Wilk test. The non-parametric variables were studied by using the Kruskal–Wallis test, following Dunn’s multiple comparisons test, and p < 0.05 was considered significant.
Figure 5
Figure 5
Downregulation of PGC1α-related factors under HFA. (A) Expression of ACADm in cardiomyocytes stimulated with HFA and/or rapamycin or metformin preincubation. ** p < 0.01 vs. control, ## p < 0.01 vs. HFA. (B) Gene expression of PPARα and SDHB after HFA with/without pre-treatment with rapamycin, siRictor, siPGC1α, or metformin. * p < 0.05 vs. control, # p < 0.05 vs. HFA. The data distribution was examined by the Shapiro–Wilk test. The non-parametric variables were studied by using the Kruskal–Wallis test, following Dunn’s multiple comparisons test. p < 0.05 was considered significant.
Figure 6
Figure 6
Glycolytic and mitochondrial ATP formation under HFA-mTORC1 activation in cardiomyocytes. Bioenergetic quantification of HFA-stimulated cardiomyocytes. The Seahorse XF Pro Analyzer equipment was used to quantify (A) total, glycolytic (in red), and mitochondrial (in blue) ATP synthesis, (B) the oxygen consumption rate (OCR), and (C) the XF ATP rate index as the ratio between mitochondrial ATP production and glycolytic ATP synthesis in HFA-stimulated cells with/without silencing of PGC1α or Rictor, or specific inhibitors for PGC1α (SR-18292) and mTORC1 (rapamycin) or AMPK activator (metformin). ## p < 0.01 vs. total ATP-HFA, & p< 0.05 vs. mitochondrial ATP control, § p< 0.05 vs. glycolytic ATP HFA, §§ p< 0.01 vs. glycolytic ATP HFA, p < 0.05 vs. mitochondrial ATP-HFA, and †† p < 0.01 vs. mitochondrial ATP-HFA. Additionally, ** p < 0.01 vs. control and πππ p < 0.001 vs. HFA. (D) Gene expression of PPARα and SDHB after HFA with/without ZLN005 pre-treatment at 5 and 10 μg/mL. * p < 0.05 vs. control, # p < 0.05 vs. HFA. The data distribution was studied by the Shapiro–Wilk test. Variables with normal distribution were analyzed by one-way ANOVA followed by Tukey’s test, while the non-parametric variables were studied using the Kruskal–Wallis test, following Dunn’s multiple comparisons test. p < 0.05 was considered significant.
Figure 7
Figure 7
Schematic model of the molecular alterations induced in cardiac cells under HTN-T2DM. In an HTN-T2DM scenario, the stimulation of pro-hypertensive factors such as RAA peptides, sympathetic neurotransmitters, and oxidative/inflammatory factors induces the expression of pro-oxidant/-inflammatory/-hypertrophic proteins. In addition, the lack of insulin sensitivity reduces glucose utilization and the overload of fatty acids as a unique energetic substrate. HFAs saturate β-oxidation and deviate to fatty acid metabolites (ceramide, diacylglycerol; DAG) with high pro-oxidant and apoptotic properties. The non-assimilated glucose also leads to pro-oxidant molecules such as hexosamine and AGEs. All these effects can damage mitochondria and energy supply for contraction and could be amplified under obesity. Interestingly, by proteomics, we found key proteins that could be targeted for cardiac dysfunction in these patients. In red boxes, those factors that were downregulated. In blue, those proteins that were upregulated. ETC: electron transport chain, ACSL: Long-chain fatty acid–CoA ligase, AIFM: Apoptosis-inducing factor 1, ANXA: Annexin, CISY: Citrate synthase, AOC3: Amine Oxidase Copper Containing 3, CO7: Complement component C7, CPT: Carnitine O-palmitoyl transferase, GLYG: Glycogenin-1, HXK1: Hexokinase-1, IDH: Isocitrate dehydrogenase, LDHB: L-lactate dehydrogenase B chain, MFN2: Mitofusin-2, NLRX1: NLR family member X1, PDP1: Pyruvate dehydrogenase [acetyl-transferring]-phosphatase 1, SODC: Superoxide dismutase [Cu-Zn], SUCB: Succinyl-CoA ligase [ADP-forming] subunit beta, UBXN1: UBX domain-containing protein 1, UGDH: UDP-glucose 6-dehydrogenase.
Figure 8
Figure 8
Potential regulation of the mTORC1-PGC1α-PPARα axis under overloaded fatty acid. In addition to saturating β-oxidation, the excess fatty acid can also shift the balance of mTOR complexes toward mTORC1, which is able to block PGC1α levels and related gene expression. Among them, PPARα and other mitochondrial regulators (i.e., TFAM, NRF1) may be attenuated at the nuclei and mitochondrion, worsening mitochondrial function. mTORC1 inhibitors and AMPK activators, such as rapamycin or metformin, respectively, might mitigate these actions. In this sense, PGC1α enhancers could improve mitochondrial respiration and fatty acid utilization genes. mtDNA: mitochondrial DNA, TFAM: mitochondrial transcription factor A, NRF1: Nuclear respiratory factor 1.

References

    1. Owan T.E., Hodge D.O., Herges R.M., Jacobsen S.J., Roger V.L., Redfield M.M. Trends in prevalence and outcome of heart failure with preserved ejection fraction. N. Engl. J. Med. 2006;355:251–259. doi: 10.1056/NEJMoa052256. - DOI - PubMed
    1. Iglay K., Hannachi H., Joseph Howie P., Xu J., Li X., Engel S.S., Moore L.M., Rajpathak S. Prevalence and co-prevalence of comorbidities among patients with type 2 diabetes mellitus. Curr. Med. Res. Opin. 2016;32:1243–1252. doi: 10.1185/03007995.2016.1168291. - DOI - PubMed
    1. Homan E.A., Reyes M.V., Hickey K.T., Morrow J.P. Clinical Overview of Obesity and Diabetes Mellitus as Risk Factors for Atrial Fibrillation and Sudden Cardiac Death. Front. Physiol. 2018;9:1847. doi: 10.3389/fphys.2018.01847. - DOI - PMC - PubMed
    1. Yap J., Tay W.T., Teng T.K., Anand I., Richards A.M., Ling L.H., MacDonald M.R., Chandramouli C., Tromp J., Siswanto B.B., et al. Association of Diabetes Mellitus on Cardiac Remodeling, Quality of Life, and Clinical Outcomes in Heart Failure With Reduced and Preserved Ejection Fraction. J. Am. Heart Assoc. 2019;8:e013114. doi: 10.1161/JAHA.119.013114. - DOI - PMC - PubMed
    1. Tremblay F., Dubois M.J., Marette A. Regulation of GLUT4 traffic and function by insulin and contraction in skeletal muscle. Front. Biosci. 2003;8:d1072–d1084. doi: 10.2741/1137. - DOI - PubMed

MeSH terms

Substances