. 2023 May 12;24(10):8684.
doi: 10.3390/ijms24108684.

Vitamin A Promotes the Fusion of Autophagolysosomes and Prevents Excessive Inflammasome Activation in Dextran Sulfate Sodium-Induced Colitis

Affiliations

Vitamin A Promotes the Fusion of Autophagolysosomes and Prevents Excessive Inflammasome Activation in Dextran Sulfate Sodium-Induced Colitis

Hiroto Hiraga et al. Int J Mol Sci. .

Abstract

Vitamin A ensures intestinal homeostasis, impacting acquired immunity and epithelial barrier function; however, its role in innate immunity is mostly unknown. Here, we studied the impact of vitamin A in different dextran sulfate sodium (DSS)-induced colitis animal models. Interestingly, more severe DSS-induced colitis was observed in vitamin A-deficient (VAD) mice than in vitamin A-sufficient (VAS) mice; the same was observed in VAD severe combined immunodeficient mice lacking T/B cells. Remarkably, IL-1β production, LC3B-II expression, and inflammasome activity in the lamina propria were significantly elevated in VAD mice. Electron microscopy revealed numerous swollen mitochondria with severely disrupted cristae. In vitro, non-canonical inflammasome signaling-induced pyroptosis, LC3B-II and p62 expression, and mitochondrial superoxide levels were increased in murine macrophages (RAW 264.7) pretreated with retinoic acid receptor antagonist (Ro41-5253). These findings suggest that vitamin A plays a crucial role in the efficient fusion of autophagosomes with lysosomes in colitis.

Keywords: autophagy; inflammatory bowel disease; pyroptosis; retinoic acid; vitamin A.


Conflict of interest statement

The authors declare no conflict of interest.

Figures

Figure 1
Figure 1
VAD B6 mice show more severe DSS-induced colitis than VAS mice. (ad) VAS and VAD B6 mice were fed 4% DSS and were followed up until day 10. (a) Macroscopic findings (n = 3), (b) survival rate (n = 12), (c) body weight course (n = 8), (d) colonic length (n = 6), (e) H&E staining, and (f) histological scoring (n = 4) are shown. In (b), data were analyzed using the Kaplan–Meier test. In (c,d,f), data are presented as mean ± SEM (n > 2 independent experiments). An unpaired t-test was used for statistical analysis (* p < 0.05, ** p < 0.01). DSS, dextran sulfate sodium; H&E, hematoxylin and eosin; SEM, standard error of the mean; VAD, vitamin A-deficient; VAS, vitamin A-sufficient.
Figure 2
Figure 2
VAD SCID mice exhibit more severe DSS-induced colitis than VAS mice. (ad) VAS and VAD SCID mice were fed 2.5% DSS and were followed up until day 10. (a) Macroscopic findings (n = 3), (b) survival rate (n = 9), (c) body weight course (n = 8), (d) colonic length (n = 6), (e) H&E staining, and (f) histological scoring (n = 4) are shown. In (b), data were analyzed with the Kaplan–Meier test. In (c,d,f), data are presented as mean ± SEM (n > 2 independent experiments). An unpaired t-test was performed for statistical analysis (* p < 0.05, ** p < 0.01). DSS, dextran sulfate sodium; H&E, hematoxylin and eosin; SCID, severe combined immunodeficient; SEM, standard error of the mean; VAD, vitamin A-deficient; VAS, vitamin A-sufficient.
Figure 3
Figure 3
Inflammasome-related proteins increase in colonic lamina propria of VAD mice. (ac) Profile of cytokine production in lamina propria (LP) from DSS-treated VAD mice using a multiplex system (Bio-Plex, Bio-Rad) (n = 5). VAS and VAD mice were fed with DSS in drinking water as described in the Materials and Methods. On day 0, 1, and 2 after DSS feeding, colonic LP of mice was isolated using a modified Bjerk’s method. The cytokine assay was performed using Bio-Plex multi-assay system (Bio-Rad Laboratories). (d) Immunoblotting for inflammasome-related proteins was performed using LP isolated from DSS-treated mice. (e) Caspase-1 activities in colonic LP were measured using a colorimetric protease assay kit (Bio Vision Research Product) (n = 5). Data with error bars are represented as means ± SEM (n > 2 independent experiments). An unpaired t-test was used for statistical analysis (NS, not significant; * p < 0.05, ** p < 0.01). Each panel represents an experiment performed at least three times. DSS, dextran sulfate sodium; SEM, standard error of the mean; VAD, vitamin A-deficient.
Figure 4
Figure 4
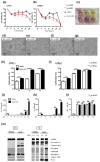
Macrophages pretreated with RAR antagonist exhibit increased pyroptosis mediated via non-canonical inflammasome signaling. (am) Effect of RAR antagonist (Ro41-5253) on cell viability of murine macrophage cells (RAW 264.7) treated with LPS. RAW 264.7 cells were cultured in 10 mg/mL LPS for 24 h, pretreated with or without 10 mM Ro41-5253 for 1 h. Cell viability, cytotoxicity, cytokine production, and immunoblotting were examined at each time point. (a) Cell viability in the absence of LPS (n = 4), (b) cell viability in the presence of 10 mg/mL LPS (n = 4), (c) representative images of supernatants, and (dg) morphology of RAW 264.7 cells upon Ro41-5253 and LPS treatment. (h,i) LDH was measured using Cytotox96 (non-radioactive cytotoxicity assay, Promega). (h) Cytotoxicity assay without LPS (n = 6) and (i) cytotoxicity assay in the presence of 10 mg/mL LPS (n = 6). (jl) Titers of IL-1β, IL-18, and TNF-α in supernatants were measured using ELISA. (j) IL-1β production (n = 4), (k) IL-18 production (n = 4), (l) TNF-α production (n = 4), and (m) immunoblotting of RAW 264.7 cells upon Ro41-5253 and LPS treatment. Graphs show the mean ± SEM of duplicate wells and represent three independent experiments. An unpaired t-test was used for statistical analysis (NS, not significant; * p < 0.05, ** p < 0.01). Each panel represents an experiment performed at least three times. IL-1β, -18, interleukin-1β, -18; LDH, lactate dehydrogenase; LPS, lipopolysaccharide; RAR, retinoic acid receptor; TNF-α, tumor necrosis factor-α.
Figure 5
Figure 5
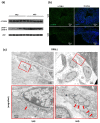
VAD decreases autophagic flux by reducing the fusion of autophagolysosomes. (a) Immunoblotting for autophagy-related proteins was performed using isolated colonic lamina propria (LP) of B6 mice (day 2). (b) Autophagy in colonic tissues of GFP-LC3 transgenic mice (GFP-LC3#53) (day 1). (c) Electron microscopic analysis of colonic LP with or without DSS treatment (day 1). The areas of red box were magnified. The red arrows indicate mitochondria. (d,e) Effects of RAR antagonist (Ro41-5253) on autophagy of murine macrophage cells (RAW 264.7). (d) Immunoblotting of autophagy-related proteins. RAW 264.7 cells were pretreated with or without 10 mM Ro41-5253 for 1 h and then harvested in the presence of 10 mg/mL LPS after 24 h. (e) Mitochondrial ROS was measured by MitoSOX staining after 4 h of EBSS treatment. Each panel represents an experiment performed at least three times. EBBSS, Earle’s Balanced Salt Solution; LPS, lipopolysaccharide; RAR, retinoic acid receptor; ROS, reactive oxygen species. #### indicates a value greater than 9999.
Figure 5
Figure 5
VAD decreases autophagic flux by reducing the fusion of autophagolysosomes. (a) Immunoblotting for autophagy-related proteins was performed using isolated colonic lamina propria (LP) of B6 mice (day 2). (b) Autophagy in colonic tissues of GFP-LC3 transgenic mice (GFP-LC3#53) (day 1). (c) Electron microscopic analysis of colonic LP with or without DSS treatment (day 1). The areas of red box were magnified. The red arrows indicate mitochondria. (d,e) Effects of RAR antagonist (Ro41-5253) on autophagy of murine macrophage cells (RAW 264.7). (d) Immunoblotting of autophagy-related proteins. RAW 264.7 cells were pretreated with or without 10 mM Ro41-5253 for 1 h and then harvested in the presence of 10 mg/mL LPS after 24 h. (e) Mitochondrial ROS was measured by MitoSOX staining after 4 h of EBSS treatment. Each panel represents an experiment performed at least three times. EBBSS, Earle’s Balanced Salt Solution; LPS, lipopolysaccharide; RAR, retinoic acid receptor; ROS, reactive oxygen species. #### indicates a value greater than 9999.
Figure 6
Figure 6
VAD impairs autophagic and listericidal activities of macrophages and host resistance to Listeria monocytogenes infection. (ac) C57BL/6J and SCID mice were intravenously infected with 5 × 10⁵ CFU of L. monocytogenes. Mice were followed up until day 10, or spleens and livers were harvested 24 h (day 1) and 48 h (day 2) post-infection. (a) Survival rate (n = 12), (b) the number of bacteria in organs (day 1, n = 4), (c) the number of bacteria in organs (day 2, n = 4), and (d) splenic macrophages of VAS and VAD mice infected with L. monocytogenes at the multiplicity of infection (MOI) of 10. The numbers of viable bacteria in cell lysates were counted at each time point (n = 5). (e) Fluorescence microscopic findings of GFP-LC3 transgenic mice (GFP-LC3#53) infected with DsRedEx-labeled L. monocytogenes. Mice were intravenously infected with 5 × 10⁵ CFU of L. monocytogenes. The livers were removed 48 h (day 2) post-infection. After fixation by perfusion with 4% paraformaldehyde (PFA), fluorescent signals were observed under a fluorescence microscope. (f) Electron microscopic findings of mice infected with L. monocytogenes. Mice were intravenously infected with 5 × 10⁵ CFU of L. monocytogenes. The spleens were harvested pre-infection (day 0) and 24 h (day 1) post-infection. The red circles indicate autophagosomes. In (a), data were analyzed using the Kaplan–Meier test. In (bd), data are presented as mean ± SEM (n > 2 independent experiments). An unpaired t-test was used for statistical analysis (NS, not significant; * p < 0.05, ** p < 0.01). Each panel represents an experiment performed at least three times. CFU, colony-forming unit; SEM, standard error of the mean; VAD, vitamin A-deficient; VAS, vitamin A-sufficient.
Figure 6
Figure 6
VAD impairs autophagic and listericidal activities of macrophages and host resistance to Listeria monocytogenes infection. (ac) C57BL/6J and SCID mice were intravenously infected with 5 × 10⁵ CFU of L. monocytogenes. Mice were followed up until day 10, or spleens and livers were harvested 24 h (day 1) and 48 h (day 2) post-infection. (a) Survival rate (n = 12), (b) the number of bacteria in organs (day 1, n = 4), (c) the number of bacteria in organs (day 2, n = 4), and (d) splenic macrophages of VAS and VAD mice infected with L. monocytogenes at the multiplicity of infection (MOI) of 10. The numbers of viable bacteria in cell lysates were counted at each time point (n = 5). (e) Fluorescence microscopic findings of GFP-LC3 transgenic mice (GFP-LC3#53) infected with DsRedEx-labeled L. monocytogenes. Mice were intravenously infected with 5 × 10⁵ CFU of L. monocytogenes. The livers were removed 48 h (day 2) post-infection. After fixation by perfusion with 4% paraformaldehyde (PFA), fluorescent signals were observed under a fluorescence microscope. (f) Electron microscopic findings of mice infected with L. monocytogenes. Mice were intravenously infected with 5 × 10⁵ CFU of L. monocytogenes. The spleens were harvested pre-infection (day 0) and 24 h (day 1) post-infection. The red circles indicate autophagosomes. In (a), data were analyzed using the Kaplan–Meier test. In (bd), data are presented as mean ± SEM (n > 2 independent experiments). An unpaired t-test was used for statistical analysis (NS, not significant; * p < 0.05, ** p < 0.01). Each panel represents an experiment performed at least three times. CFU, colony-forming unit; SEM, standard error of the mean; VAD, vitamin A-deficient; VAS, vitamin A-sufficient.
Figure 7
Figure 7
Blockade of IL-1β ameliorates DSS-induced colitis in VAD mice. (a,b) Effect of monoclonal antibody against IL-1β on DSS-induced colitis in VAD B6 mice. VAD B6 mice were injected intraperitoneally with 50 mg/head/day of monoclonal antibody against IL-1β (BioLegend) from day 0 (when DSS treatment was initiated) to day 3. Isotype-matched IgG was injected as a control. (a) Survival rate, (b) body weight course. (c,d) Survival rate and body weight course after MCC950 administration. (e,f) Survival rate and body weight course after rapamycin administration. In (a,c,e), data were analyzed using the Kaplan–Meier test. In (b), data are presented as mean ± SEM (n > 2 independent experiments). An unpaired t-test test was used for statistical analysis (NS, not significant; ** p < 0.01). DSS, dextran sulfate sodium; IL-1β, interleukin-1β; SEM, standard error of the mean; VAD, vitamin A-deficient.
Figure 7
Figure 7
Blockade of IL-1β ameliorates DSS-induced colitis in VAD mice. (a,b) Effect of monoclonal antibody against IL-1β on DSS-induced colitis in VAD B6 mice. VAD B6 mice were injected intraperitoneally with 50 mg/head/day of monoclonal antibody against IL-1β (BioLegend) from day 0 (when DSS treatment was initiated) to day 3. Isotype-matched IgG was injected as a control. (a) Survival rate, (b) body weight course. (c,d) Survival rate and body weight course after MCC950 administration. (e,f) Survival rate and body weight course after rapamycin administration. In (a,c,e), data were analyzed using the Kaplan–Meier test. In (b), data are presented as mean ± SEM (n > 2 independent experiments). An unpaired t-test test was used for statistical analysis (NS, not significant; ** p < 0.01). DSS, dextran sulfate sodium; IL-1β, interleukin-1β; SEM, standard error of the mean; VAD, vitamin A-deficient.

References

    1. Kastner T., Walsh K.K. The Optimal Evaluation and Treatment of Feeding Disorders in Children with Neurological Disorders. J. Am. Coll. Surg. 1995;181:383–386. - PubMed
    1. Napoli J.L. Retinoic Acid: Its Biosynthesis and Metabolism. Prog. Nucleic Acid Res. Mol. Biol. 1999;63:139–188. doi: 10.1016/s0079-6603(08)60722-9. - DOI - PubMed
    1. Giguere V., Ong E.S., Segui P., Evans R.M. Identification of a Receptor for the Morphogen Retinoic Acid. Nature. 1987;330:624–629. doi: 10.1038/330624a0. - DOI - PubMed
    1. Mangelsdorf D.J., Ong E.S., Dyck J.A., Evans R.M. Nuclear Receptor That Identifies a Novel Retinoic Acid Response Pathway. Nature. 1990;345:224–229. doi: 10.1038/345224a0. - DOI - PubMed
    1. Petkovich M., Brand N.J., Krust A., Chambon P. A Human Retinoic Acid Receptor Which Belongs to the Family of Nuclear Receptors. Nature. 1987;330:444–450. doi: 10.1038/330444a0. - DOI - PubMed

LinkOut - more resources