. 2023 May 12;24(10):8692.
doi: 10.3390/ijms24108692.

Griseofulvin Inhibits Root Growth by Targeting Microtubule-Associated Proteins Rather Tubulins in Arabidopsis

Affiliations

Griseofulvin Inhibits Root Growth by Targeting Microtubule-Associated Proteins Rather Tubulins in Arabidopsis

Yanjing Guo et al. Int J Mol Sci. .

Abstract

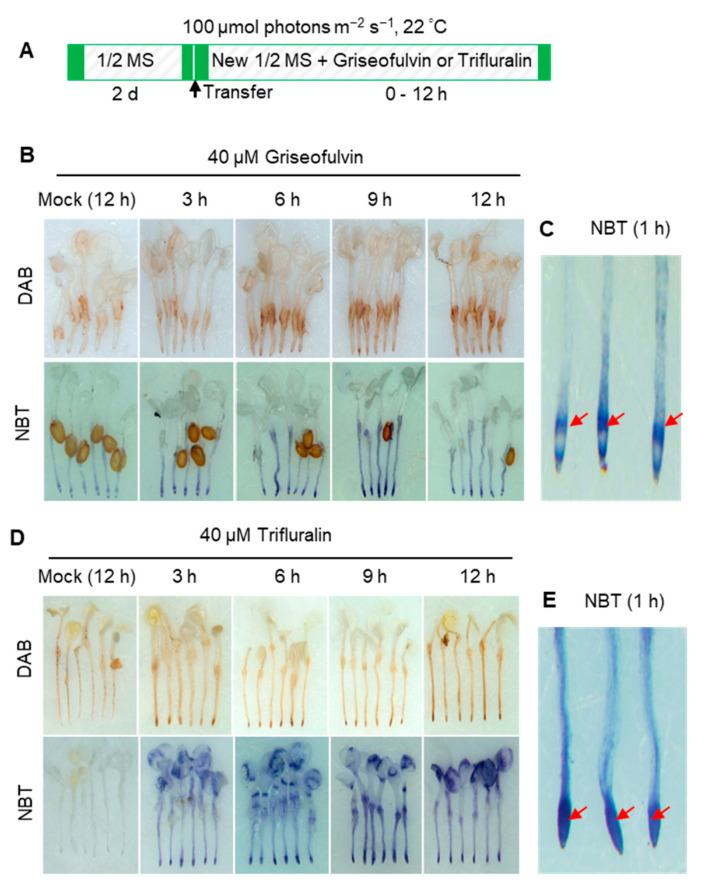
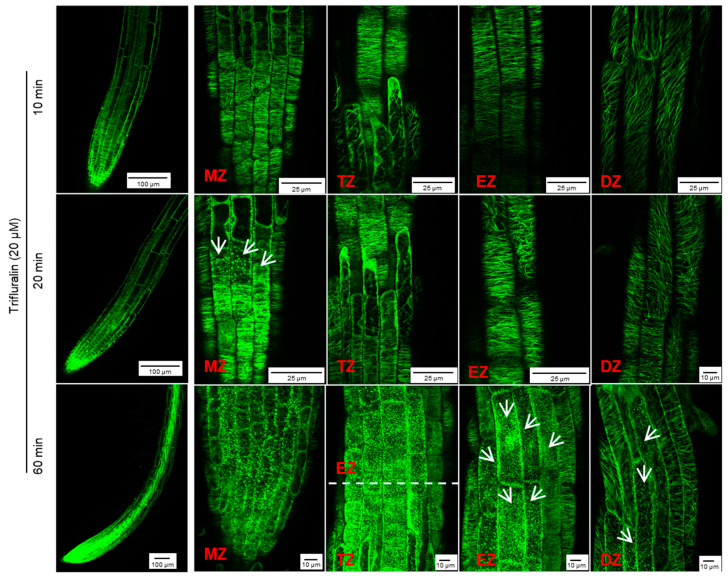
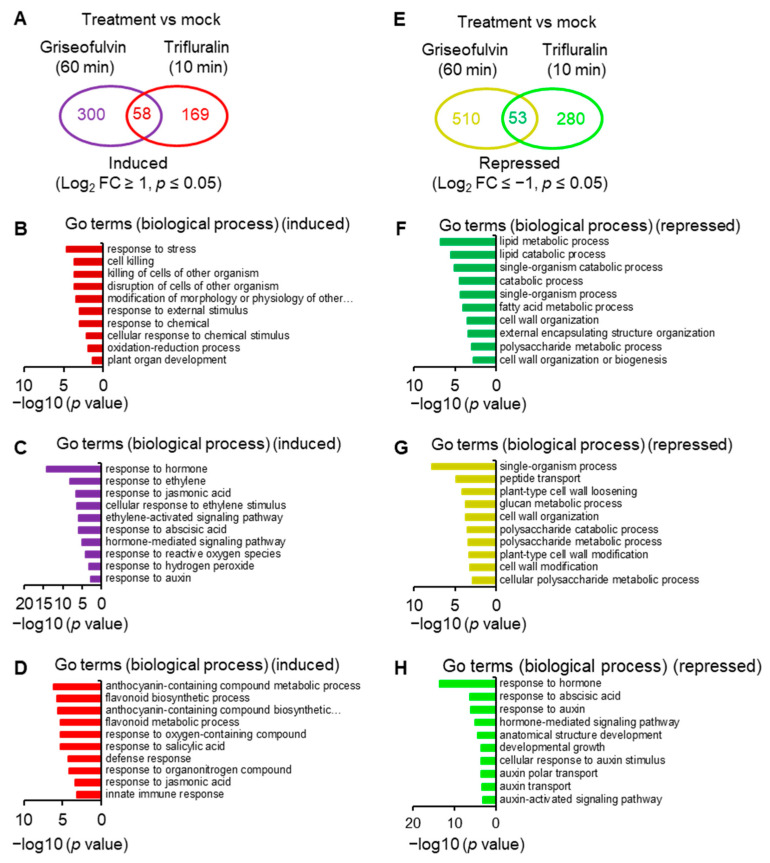
Griseofulvin was considered an effective agent for cancer therapy in past decades. Although the negative effects of griseofulvin on microtubule stability are known, the exact target and mechanism of action in plants remain unclear. Here, we used trifluralin, a well-known herbicide targeting microtubules, as a reference and revealed the differences in root tip morphology, reactive oxygen species production (ROS), microtubule dynamics, and transcriptome analysis between Arabidopsis treated with griseofulvin and trifluralin to elucidate the mechanism of root growth inhibition by griseofulvin. Like trifluralin, griseofulvin inhibited root growth and caused significant swelling of the root tip due to cell death induced by ROS. However, the presence of griseofulvin and trifluralin caused cell swelling in the transition zone (TZ) and meristematic zone (MZ) of root tips, respectively. Further observations revealed that griseofulvin first destroyed cortical microtubules in the cells of the TZ and early elongation zone (EZ) and then gradually affected the cells of other zones. The first target of trifluralin is the microtubules in the root MZ cells. Transcriptome analysis showed that griseofulvin mainly affected the expression of microtubule-associated protein (MAP) genes rather than tubulin genes, whereas trifluralin significantly suppressed the expression of αβ-tubulin genes. Finally, it was proposed that griseofulvin could first reduce the expression of MAP genes, meanwhile increasing the expression of auxin and ethylene-related genes to disrupt microtubule alignment in root tip TZ and early EZ cells, induce dramatic ROS production, and cause severe cell death, eventually leading to cell swelling in the corresponding zones and inhibition of root growth.

Keywords: microtubule; mycotoxin; plant hormone; reactive oxygen species (ROS); transcriptome analysis.


Conflict of interest statement

The authors declare no conflicts of interest.

Figures

Figure 1
Figure 1
Effect of griseofulvin on the root development of A. thaliana. (A) Schematic diagram showing the strategy to monitor the effect of griseofulvin on seedling growth in Arabidopsis. Col-0 seeds were directly cultivated on 1/2 MS medium with 1% DMSO (mock) or griseofulvin with different concentrations (10, 20, 30, 40, and 50 μM). (B) Phenotypes of 7-day-old seedlings growth on the medium with griseofulvin (14-day-old seedlings shown in the inset), exhibiting a distinct concentration-dependent inhibition of root growth. (C) Root length of 7-day-old seedlings growth on medium with griseofulvin. (D) Schematic diagram showing the strategy to check the effect of griseofulvin on root growth and development in Arabidopsis. Two-day-old seedlings growth on the conventional 1/2 MS medium were transferred onto 1/2 MS medium with 1% DMSO (mock) or griseofulvin with different concentrations (10, 20, and 40 μM), and then continued cultivating for 5 days. (E) Phenotypes of the seedlings treated for 5 days with griseofulvin. (F) Morphological micro-observation of root tip region of 40 μM griseofulvin-treated seedlings. Scale bars: 100 μm. (G) Root length of the seedlings treated with griseofulvin for 5 days. Data are mean values ± SE of three independent experiments with around 30 repetitions for each treatment. Different small letters above error bars indicate significant difference at 0.05 level.
Figure 2
Figure 2
Comparison of effects of griseofulvin and trifluralin on root growth and development of A. thaliana. (A) Schematic diagram showing the strategy to monitor the effects of griseofulvin or trifluralin on root growth in Arabidopsis. Col-0 seeds were directly cultivated for 7 days on 1/2 MS medium with 1% DMSO (mock) or griseofulvin or trifluralin with different concentrations (10, 20, and 40 μM). (B) Comparison of phenotypes of 7-day-old seedlings growth on the medium with different concentrations of griseofulvin and trifluralin. (C) Comparison of root length of 7-day-old seedlings growth on medium with different concentrations of griseofulvin and trifluralin. (D) Schematic diagram showing the strategy to monitor different effects of griseofulvin and trifluralin on the morphology of root tip in Arabidopsis. Two-day-old seedlings growth on the conventional 1/2 MS medium were transferred onto 1/2 MS medium with 1% DMSO (mock) or different concentrations (10, 20, and 40 μM) of griseofulvin or trifluralin, and then continued cultivating for 5 days. (E) Morphological micro-observation of root tip region of the seedlings treated for 5 days with griseofulvin and trifluralin. Scale bars: 100 μm. (F) Cell death indicated by TBD staining of root tip region of the seedlings treated for 5 days with griseofulvin and trifluralin. Data are mean values ± SE of three independent experiments with around 30 repetitions for each treatment. Different small letters above error bars indicate significant difference at 0.05 level.
Figure 3
Figure 3
Comparison of ROS production of Arabidopsis roots induced by griseofulvin and trifluralin. (A) Schematic diagram showing the strategy to monitor ROS production of root tips induced by griseofulvin or trifluralin in Arabidopsis. Two-day-old seedlings growth on the conventional 1/2 MS medium were transferred onto 1/2 MS medium with 1% DMSO (mock) or different concentrations (10, 20, and 40 μM) of griseofulvin or trifluralin, and then incubated for the indicated time. (BE) Histochemical detection of H2O2 with DAB staining and O2·− with NBT staining in Arabidopsis roots treated with 40 μM griseofulvin (B) or 40 μM trifluralin (D) for 3, 6, 9, and 12 h, or treated with 1% DMSO (mock) for 12 h. NBT staining was also performed after 1 h treatment of Arabidopsis roots with 40 μM griseofulvin (C) or 40 μM trifluralin (E). Red arrows in (C,E) target main zone in Arabidopsis apical root under griseofulvin and trifluralin treatment, respectively. Results are representative of three independent experiments.
Figure 4
Figure 4
Comparison of effects of griseofulvin and trifluralin on cell viability of root tips in Arabidopsis. Two-day-old seedlings growth on the conventional 1/2 MS medium were transferred onto 1/2 MS medium with 1% DMSO (mock) or 40 μM griseofulvin or 40 μM trifluralin, and then incubated for the indicated time. (A) Images of FDA fluorescence (lower) and bright field (upper) of griseofulvin-incubated root tips. (B) The intensity of FDA fluorescence signals of griseofulvin-incubated root tips. (C) Images of FDA fluorescence (lower) and bright field (upper) of trifluralin-incubated root tips. (D) The intensity of FDA fluorescence signals of trifluralin-incubated root tips. (EH) Effects of ROS scavengers on the loss of cell viability of root tips caused by griseofulvin and trifluralin. Two-day-old seedlings growth on the conventional 1/2 MS medium were pretreated for 1 h with DMTU, DPI, NAC, or SOD prior to incubation of 40 μM griseofulvin or 40 μM trifluralin. Images of FDA fluorescence (lower) and bright field (upper) of the pretreated root tips are shown after 5 days incubation of griseofulvin (E) or 3 days incubation of trifluralin (G). The intensity of FDA fluorescence signals of the pretreated root tips is calculated after incubation of griseofulvin (F) or trifluralin (H). Data are mean values ± SE of three independent measurements with at least 15 repetitions for each treatment. Different small letters above error bars indicate significant difference at 0.05 level. Scale bar: 100 μm.
Figure 5
Figure 5
Comparison of effects of griseofulvin and trifluralin on cell morphology of root tips in Arabidopsis. (A) Schematic diagram showing the strategy to monitor the change of cell morphology of root tips induced by griseofulvin or trifluralin in Arabidopsis. Five-day-old seedlings growth on the conventional 1/2 MS medium were transferred onto 1/2 MS medium with 1% DMSO (mock) or 40 μM griseofulvin or 40 μM trifluralin, and then incubated for 9 and 24 h. Cell morphology of root tips was visualized using PI staining. (B) Cell morphology of root tips incubated for 24 h with 1% DMSO. (C) Cell morphology of root tips incubated for 9 and 24 h with griseofulvin. (D) Cell morphology of root tips incubated for 9 and 24 h with trifluralin. Images of bright field of root tips were also shown in the inset (top left corner). Results represent three independent biological replicates. Scale bar: 100 μm.
Figure 6
Figure 6
Effect of griseofulvin on microtubule dynamics of root tip cells in Arabidopsis. Five-day-old MBD-GFP seedlings growth on the conventional 1/2 MS medium were transferred onto 1/2 MS medium with 40 μM griseofulvin and then incubated for the indicated time. (A) The overall morphology (left, scale bar: 50 μm) and microtubule dynamics (right, scale bar: 10 μm) of untreated root tips. The root tips were divided into four zones, including meristematic zone (MZ), transition zone (TZ), elongation zone (EZ), and differentiation zone (DZ). Microtubules of the MZ and DZ cells showed mainly longitudinal orientation, microtubules of the TZ and EZ cells mainly showed transverse orientation. (B) The overall morphology (left, scale bar: 100 μm) and microtubule dynamics (right, scale bar: 10 μm) of different zones of root tips after griseofulvin incubation for 1, 3, and 12 h. White arrows point to cells with disordered microtubules. Results represent three independent biological replicates.
Figure 7
Figure 7
Effect of trifluralin on microtubule dynamics of root tip cells in Arabidopsis. Five-day-old MBD-GFP seedlings growth on the conventional 1/2 MS medium were transferred onto 1/2 MS medium with 20 μM trifluralin and then incubated for 10, 20, and 60 min. The overall morphology (left, scale bar: 100 μm) and microtubule dynamics (right, scale bar: 25 μm or 10 μm) of different zones of root tips after griseofulvin incubation were shown. White arrows point to cells with disordered microtubules. Results represent three independent biological replicates.
Figure 8
Figure 8
Comparative analyses of transcriptome of Arabidopsis seedlings incubated with griseofulvin and trifluralin. Five-day-old Col-0 seedlings growth on the conventional 1/2 MS medium were transferred onto liquid 1/2 MS medium with 1% DMSO, 40 μM griseofulvin, or 20 μM trifluralin, and then incubated for the indicated time. (A) Venn diagrams showing the numbers of genes that were upregulated higher than twofold in Col-0 seedlings after griseofulvin or trifluralin incubation as compared to mock treatment (1% DMSO). (B) Gene Ontology (GO) enrichment analysis of 58 common upregulated genes. (C) GO enrichment analysis of 300 genes that were only induced by griseofulvin. (D) GO enrichment analysis of 169 genes that were only induced by trifluralin. (E) Venn diagrams showing the numbers of genes that were downregulated lower than twofold in Col-0 seedlings after griseofulvin or trifluralin incubation as compared to mock treatment (1% DMSO). (F) GO enrichment analysis of 53 common downregulated genes. (G) GO enrichment analysis of 510 genes that were only repressed by griseofulvin. (H) GO enrichment analysis of 280 genes that were only repressed by trifluralin.
Figure 9
Figure 9
Heat map showing the expression levels of auxin, jasmonic acid, and ethylene-related response genes (A), microtubule and cell wall, cellular polysaccharide changes (C) in Col-0 seedlings inoculated by 40 μM griseofulvin for 60 min or 20 μM trifluralin for 10 min compared with mock treatment (1% DMSO). The colors of the heat map represent the Log2FC ranging from green (−4) through black (0) to red (4). The genes without significant difference (p > 0.05) were shown in gray color. The expression levels of selected plant hormone-responsive genes, including GH3.3, ILL6, CYP94C1, OPR3, and ERF53 (B), microtubule- and cell-wall-related genes, including MAP65-1, TUA3, WAK1, PSK2, GASA10, and CYCP2;1 (D), in Col-0 seedlings inoculated with griseofulvin or trifluralin were measured by quantitative PCR (qRT-PCR). Gene expression levels were normalized to ACTIN2. Data are mean ± SE of three independent biological replicates. The different small letters above error bars indicate significant difference at 0.05 level.

References

    1. Desai A., Mitchison T.J. Microtubule polymerization dynamics. Annu. Rev. Cell Dev. Biol. 1997;13:83–117. doi: 10.1146/annurev.cellbio.13.1.83. - DOI - PubMed
    1. Anthony R.G., Hussey P.J. Dinitroaniline herbicide resistance and the microtubule cytoskeleton. Trends Plant Sci. 1999;4:112–116. doi: 10.1016/S1360-1385(99)01378-3. - DOI - PubMed
    1. Lignowski E.M., Scott E.G. Trifluralin and root growth. Plant Cell Physiol. 1971;12:701–708. doi: 10.1093/oxfordjournals.pcp.a074667. - DOI
    1. Fernandes T.C.C., Pizano M.A., Marin-Morales M.A. Characterization, modes of action and effects of trifluralin: A review. In: Price A.J., Kelton J.A., editors. Herbicides—Current Research and Case Studies in Use. IntechOpen; London, UK: 2013. pp. 489–515. - DOI
    1. Chu Z., Chen J., Nyporko A., Han H., Yu Q., Powles S. Novel α-Tubulin Mutations Conferring Resistance to Dinitroaniline Herbicides in Lolium rigidum. Front. Plant Sci. 2018;9:97. doi: 10.3389/fpls.2018.00097. - DOI - PMC - PubMed

MeSH terms

LinkOut - more resources