. 2023 May 13;24(10):8724.
doi: 10.3390/ijms24108724.

NatB Catalytic Subunit Depletion Disrupts DNA Replication Initiation Leading to Senescence in MEFs

Affiliations

NatB Catalytic Subunit Depletion Disrupts DNA Replication Initiation Leading to Senescence in MEFs

Jasmin Elurbide et al. Int J Mol Sci. .

Abstract

Alpha-aminoterminal acetyltransferase B (NatB) is a critical enzyme responsible for acetylating the aminoterminal end of proteins, thereby modifying approximately 21% of the proteome. This post-translational modification impacts protein folding, structure, stability, and interactions between proteins which, in turn, play a crucial role in modulating several biological functions. NatB has been widely studied for its role in cytoskeleton function and cell cycle regulation in different organisms, from yeast to human tumor cells. In this study, we aimed to understand the biological importance of this modification by inactivating the catalytic subunit of the NatB enzymatic complex, Naa20, in non-transformed mammal cells. Our findings demonstrate that depletion of NAA20 results in decreased cell cycle progression and DNA replication initiation, ultimately leading to the senescence program. Furthermore, we have identified NatB substrates that play a role in cell cycle progression, and their stability is compromised when NatB is inactivated. These results underscore the significance of N-terminal acetylation by NatB in regulating cell cycle progression and DNA replication.

Keywords: DNA replication; N-degron pathway; N-recognins; N-terminal acetylation; NatB; actin cytoskeleton; cell cycle; senescence.


Conflict of interest statement

The authors declare no conflict of interest.

Figures

Figure 1
Figure 1
NAA20 inactivation affects cell proliferation and cell cycle progression. (A) Proliferation rate analysis in WT and Naa20−/− MEFs counting cells different days post-inactivation. The p values were calculated by two-way ANOVA analysis; mean ± SD are represented for each time point with four replicates each. ** p < 0.01 (B) Flow cytometry analysis 6 days post-inactivation in WT and Naa20−/− MEFs. Quantification of % of cells was performed with FlowJo software (v 7.6), two independent experiments are represented for each condition. The p values were calculated by two-way ANOVA analysis; mean ± SD are represented for each cell cycle phase with two replicates each. (C) Quantification of EdU incorporation and cell cycle phases after FACS analysis in WT and Naa20−/− MEFs. Quantification was performed with FlowJo software; two independent experiments are represented for each condition. The p values were calculated by unpaired t-test; mean ± SD are represented.
Figure 2
Figure 2
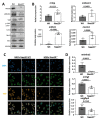
Naa20 inactivation dysregulates Hippo pathway and YAP activity. (A) Western blot analysis of WT and Naa20−/− protein extracts 6 days post-inactivation of Hippo pathway components. The intensity values of each band are indicated. (B) Quantitative real-time PCR expression analysis of Hippo pathway components dysregulated at protein level relative to GAPDH in WT and Naa20−/− MEFs 6 days post-inactivation. The p values were calculated by unpaired t-test; mean ± SD are represented. (C) Immunofluorescence (400X) of Lamin A/C (green) and YAP transcription factor (orange) in WT and Naa20−/− MEFs. Nuclei are marked with DAPI (blue). (D) Quantitative real-time PCR expression analysis of Yap target genes relative to GAPDH in WT and Naa20−/− MEFs 6 days post-inactivation. The p values were calculated by unpaired t-test; mean ± SD are represented.
Figure 3
Figure 3
Naa20 inactivation dysregulates G1 to S phase-transition components but does not affect E2f1 activation. (A) Western blot analysis of WT and Naa20−/− protein extracts 6 days post-inactivation. The intensity values of each band are indicated. (B) Quantitative real-time PCR expression analysis of G1 to S transition components relative to GAPDH in NAA20 MEFs 6 days post-inactivation. The p values were calculated by unpaired t-test; mean ± SD are represented. (C) Quantitative real-time PCR expression analysis of mE2F1, mMdm2, mBbc3 and mGadd45α relative to GAPDH in NAA20 MEFs 6 days post-inactivation. The p values were calculated by unpaired t-test; mean ± SD are represented.
Figure 4
Figure 4
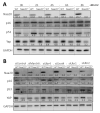
Naa20 inactivation reduces protein stability of NatB substrates mediated by Ubr4 through the N-degron pathway. (A) Proteasome inhibition in NAA20 MEFs with 5 µM MG132 treatment. Western blot analysis of cell extracts of WT and Naa20−/− cells at basal condition (0 h) and 2, 4, 6, and 8 h after MG132 treatment. (B) N-recognins silencing in Naa20 MEFs. March6, Ubr4, Cnot4, Ubr1, and Ubr2 ubiquitin ligases were silenced in WT and Naa20−/− MEFs 6 days after NAA20 inactivation with siRNAs, and a siRNA (siControl) was used as control. MEFs were transfected with the respective siRNAs 4 days post-inactivation and collected 48 h post-transfection. Western blot analysis of NatB substrate was performed after silencing March6, Ubr4, Cnot4, Ubr1, and Ubr2 ubiquitin ligases in WT and Naa20−/− MEFs 6 days after Naa20 inactivation. A specific siRNA (siControl) was used as control. The intensity values of each band are indicated.
Figure 5
Figure 5
Naa20 inactivation reduces DNA replication initiation but without affecting replication processivity. (A) Representative images of fiber of WT and Naa20−/− MEFs of DNA fiber assay 6 days post-inactivation. Cells were treated with 25 μM of CIdU for 20 min followed by 250 μM of IdU for another 20 min. (B) Number of replication events in two independent experiments represented as number of fibers detected per image. (C) Total fork length calculated from the sum of CIdU IdU tracks length. (D) Quantification of DNA replication fork rate using IdU track length. The p values were calculated by unpaired t-test; red lines represent mean ± SD.
Figure 6
Figure 6
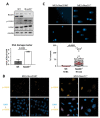
Naa20 inactivation promotes DNA damage response activation due to double-strand DNA breaks. (A) Western blot analysis for the detection of total HA2.X and γ-H2A.X in WT and Naa20−/− MEFs and quantification of ratio of γ-H2A.X/total H2A.X from immunoblot in arbitrary units. p value was calculated by unpaired t-test; mean ± SD are represented. The intensity values of each band are indicated. (B) Immunofluorescence (400X) of γ-H2A.X (orange) in WT and Naa20−/− MEFs. Nuclei are marked with DAPI (blue). (C) Neutral comet assay in Naa20 MEFs 6 days post-inactivation. With representative images (200X) of neutral comet assay in WT and Naa20−/− MEFs; and tail moment quantification. The p values were calculated by unpaired t-test red lines represent mean ± SD.
Figure 7
Figure 7
Naa20 Inactivation is associated with senescence activation in MEFs. (A) Cytometric analysis of Naa20 MEFs: cell size (left) and granularity (right) of WT and Naa20−/− MEFs measured by FSC (forward scatter) and SSC (side scatter), respectively. The p values were calculated by unpaired t-test; mean ± SD are represented phase with two replicates. (B) β-Gal-SA staining: MEFs were stained to detect β-Gal-SA activity in WT and Naa20−/− MEFs 6 days after recombinant adenovirus administration (50X). (C) Lamin B1 assessment in Naa20 MEFs. Gene expression analysis of Lamin B1 (mLmnb1) by qRT-PCR relative to GAPDH (left). The p value was calculated by unpaired t-test; mean ± SD are represented. Immunofluorescence (400X) of Lamin B1 (green) in WT and Naa20−/− MEFs (right). (D) Cytosolic chromatic assessment in Naa20 MEFs. Nuclei fluorescence staining (400X) with DAPI of WT and Naa20−/− MEFs (right) and quantification of % cells with DNA (DAPI) blebs in the cytosol in WT and Naa20−/− MEFs (left). Four independent experiments are represented. The p value was calculated by unpaired t-test; mean ± SD are represented of four independent experiments. (E) Gene expression analysis of Senescence-Associated Secretory Phenotype (SASP) factors in Naa20 MEFs 6 days post-inactivation. qRT-PCR of mIl1a, Interleukin 1-α. mIl6, Interleukin 6, and mCxcl1, chemokine (C-X-C motif) ligand 1. The p values were calculated by unpaired t-test; mean ± SD are represented. (F) mTOR inactivation and autophagy induction in Naa20 MEFs. Western blot analysis of WT and Naa20−/− protein extracts 6 days post-inactivation. The intensity values of each band are indicated.

Similar articles

Cited by

References

    1. Pechmann S., Willmund F., Frydman J. The Ribosome as a Hub for Protein Quality Control. Mol. Cell. 2013;49:411–421. doi: 10.1016/j.molcel.2013.01.020. - DOI - PMC - PubMed
    1. Varland S., Osberg C., Arnesen T. N-terminal Modifications of Cellular Proteins: The Enzymes Involved, Their Substrate Specificities and Biological Effects. Proteomics. 2015;15:2385–2401. doi: 10.1002/pmic.201400619. - DOI - PMC - PubMed
    1. Drazic A., Myklebust L.M., Ree R., Arnesen T. The World of Protein Acetylation. Biochim. Biophys. Acta Proteins Proteom. 2016;1864:1372–1401. doi: 10.1016/j.bbapap.2016.06.007. - DOI - PubMed
    1. Aksnes H., Ree R., Arnesen T. Co-Translational, Post-Translational, and Non-Catalytic Roles of N-Terminal Acetyltransferases. Mol. Cell. 2019;73:1097–1114. doi: 10.1016/j.molcel.2019.02.007. - DOI - PMC - PubMed
    1. Singer J.M., Shaw J.M. Mdm20 Protein Functions with Nat3 Protein to Acetylate Tpm1 Protein and Regulate Tropomyosin-Actin Interactions in Budding Yeast. Proc. Natl. Acad. Sci. USA. 2003;100:7644–7649. doi: 10.1073/pnas.1232343100. - DOI - PMC - PubMed

Substances

LinkOut - more resources