. 2023 May 18;24(10):8957.
doi: 10.3390/ijms24108957.

PSEN1 E280A Cholinergic-like Neurons and Cerebral Spheroids Derived from Mesenchymal Stromal Cells and from Induced Pluripotent Stem Cells Are Neuropathologically Equivalent

Affiliations

PSEN1 E280A Cholinergic-like Neurons and Cerebral Spheroids Derived from Mesenchymal Stromal Cells and from Induced Pluripotent Stem Cells Are Neuropathologically Equivalent

Miguel Mendivil-Perez et al. Int J Mol Sci. .

Abstract

Alzheimer's disease (AD) is a chronic neurological condition characterized by the severe loss of cholinergic neurons. Currently, the incomplete understanding of the loss of neurons has prevented curative treatments for familial AD (FAD). Therefore, modeling FAD in vitro is essential for studying cholinergic vulnerability. Moreover, to expedite the discovery of disease-modifying therapies that delay the onset and slow the progression of AD, we depend on trustworthy disease models. Although highly informative, induced pluripotent stem cell (iPSCs)-derived cholinergic neurons (ChNs) are time-consuming, not cost-effective, and labor-intensive. Other sources for AD modeling are urgently needed. Wild-type and presenilin (PSEN)1 p.E280A fibroblast-derived iPSCs, menstrual blood-derived menstrual stromal cells (MenSCs), and umbilical cord-derived Wharton Jelly's mesenchymal stromal cells (WJ-MSCs) were cultured in Cholinergic-N-Run and Fast-N-Spheres V2 medium to obtain WT and PSEN 1 E280A cholinergic-like neurons (ChLNs, 2D) and cerebroid spheroids (CSs, 3D), respectively, and to evaluate whether ChLNs/CSs can reproduce FAD pathology. We found that irrespective of tissue source, ChLNs/CSs successfully recapitulated the AD phenotype. PSEN 1 E280A ChLNs/CSs show accumulation of iAPPβ fragments, produce eAβ42, present TAU phosphorylation, display OS markers (e.g., oxDJ-1, p-JUN), show loss of ΔΨm, exhibit cell death markers (e.g., TP53, PUMA, CASP3), and demonstrate dysfunctional Ca2+ influx response to ACh stimuli. However, PSEN 1 E280A 2D and 3D cells derived from MenSCs and WJ-MSCs can reproduce FAD neuropathology more efficiently and faster (11 days) than ChLNs derived from mutant iPSCs (35 days). Mechanistically, MenSCs and WJ-MSCs are equivalent cell types to iPSCs for reproducing FAD in vitro.

Keywords: Alzheimer; E280a; apoptosis; iPSCs; mesenchymal stromal; mutant; presenilin.


Conflict of interest statement

The authors declare no conflict of interest.

Figures

Figure 1
Figure 1
Determination of pluripotency markers by immunofluorescence. Nuclear colocalization of OCT4 in WT (AA”) and PSEN1 E280A (BB″) iPSCs, in WT (C) and PSEN1 E280A MenSCs (D), and in WT (E) and PSEN1E280A WJ-MSCs (F). Colocalization of SOX2 in WT (GG″) and PSEN 1 E280A iPSCs (HH″), in WT (I) and PSEN 1 E280A MenSCs (J), and in WT (K) and PSEN 1E280A WJ-MSCs (L). Colocalization of Nanog in WT (MM″) and PSEN 1 E280A iPSCs (NN″), in WT (O) and PSEN 1 E280A MenSCs (P), and in WT (Q) and PSEN 1 E280A WJ-MSCs (R). Colocalization of Klf4 in WT (SS″) and PSEN 1 E280A iPSCs (TT″), in WT (U) and PSEN 1 E280A MenSCs (V), and in WT (W) and PSEN 1 E280A WJ-MSCs (X). Quantitative data showing the nuclear mean fluorescence intensity for OCT4 (Y), SOX2 (Z), NANOG (AA), and KLF4 (AB). The figures represent one out of three independent experiments. The data are expressed as the mean ± SD; significant values were determined by one-way ANOVA with Tukey’s post hoc test; ns: not significant. Image magnification, 20×. Representative immunocytochemistry images of mesoderm germ layer stained for Vimentin (ACAH), ectoderm stained for ectoderm stained for Nestin (AIAN), and endoderm stained for CXCR4 (AOAT) in WT and PSEN 1 E280 A mutation from iPSCs, MenScs, and WJ-MSCs. Nuclei are stained with Hoechst (blue). Scale bars 25 μm.
Figure 1
Figure 1
Determination of pluripotency markers by immunofluorescence. Nuclear colocalization of OCT4 in WT (AA”) and PSEN1 E280A (BB″) iPSCs, in WT (C) and PSEN1 E280A MenSCs (D), and in WT (E) and PSEN1E280A WJ-MSCs (F). Colocalization of SOX2 in WT (GG″) and PSEN 1 E280A iPSCs (HH″), in WT (I) and PSEN 1 E280A MenSCs (J), and in WT (K) and PSEN 1E280A WJ-MSCs (L). Colocalization of Nanog in WT (MM″) and PSEN 1 E280A iPSCs (NN″), in WT (O) and PSEN 1 E280A MenSCs (P), and in WT (Q) and PSEN 1 E280A WJ-MSCs (R). Colocalization of Klf4 in WT (SS″) and PSEN 1 E280A iPSCs (TT″), in WT (U) and PSEN 1 E280A MenSCs (V), and in WT (W) and PSEN 1 E280A WJ-MSCs (X). Quantitative data showing the nuclear mean fluorescence intensity for OCT4 (Y), SOX2 (Z), NANOG (AA), and KLF4 (AB). The figures represent one out of three independent experiments. The data are expressed as the mean ± SD; significant values were determined by one-way ANOVA with Tukey’s post hoc test; ns: not significant. Image magnification, 20×. Representative immunocytochemistry images of mesoderm germ layer stained for Vimentin (ACAH), ectoderm stained for ectoderm stained for Nestin (AIAN), and endoderm stained for CXCR4 (AOAT) in WT and PSEN 1 E280 A mutation from iPSCs, MenScs, and WJ-MSCs. Nuclei are stained with Hoechst (blue). Scale bars 25 μm.
Figure 2
Figure 2
Schematic representation of the iPSCs differentiation protocol: (A,B) graphic timeline of iPSC-derived NPC, cholinergic neurons (ChLNs), or cerebral spheroids (CSs); (C,D) iPSC colony morphology from WT and PSEN1 E280A cells; (E,F) embryoid body (EB) morphology from WT and PSEN1 E280A cells; (G,H) pre-NPC morphology from WT and PSEN1 E280A cells; and (I,J) NPC morphology from WT and PSEN1 E280A cells.
Figure 3
Figure 3
Determination of NPC markers by immunofluorescence. iPSCs were differentiated into NPCs as described in Section 4. Then, Nestin (A′,B′), SOX2 (A″,B″) proteins, and nuclei (A‴,B‴) were simultaneously identified in WT (A) and PSEN1 E280A (B) cells. MenSCs were cultured in regular MSC medium, then cells were stained to identify Nestin, SOX2 proteins, and nuclei in WT (C) and PSEN1 E280A (D) cells. WJ-MSCs were cultured in regular MSC medium, then cells were stained to identify Nestin, SOX2 proteins, and nuclei in WT (E) and PSEN 1 E280A (F) cells. Quantitative data showing the mean fluorescence intensity for cytosolic Nestin (G), and SOX2 (H). The figures represent one out of three independent experiments. The data are expressed as the mean ± SD; significant values were determined by one-way ANOVA with Tukey’s post hoc test; ns: not significant. Image magnification, 20×.
Figure 4
Figure 4
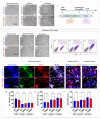
The iPSCs-, MenSCs-, and WJ-MSCs-derived cholinergic-like neurons (ChLNs): (AF) light microscopy pictures of WT (A) and PSEN 1 E280A iPSC-derived NPC (B); undifferentiated WT (C) and mutant MenSCs (D); and undifferentiated WT (E) and mutant WJ-MSCs (F). Graphic timeline of WT and PSEN 1 E280A MenSCs- and WJ-MSCs-derived cholinergic-like neurons (ChLNs) (G); light microscopy pictures of WT (H) and PSEN 1 E280A iPSCs::NPC-derived ChLNs (I); WT (J) and mutant MenSCs-derived ChLNs (K), and WT (L) and mutant WJ-MSCs-derived ChLNs (M). Flow cytometry analysis of WT and PSEN 1 E280A iPSCs::NPC- (N), MenSCs- (O), and WJ-MSCs-derived ChLNs (P) to identify VAChT and ChAT. The histograms represent 1 out of 3 independent experiments. The data are expressed as the mean ± SD; significant values were determined by one-way ANOVA with Tukey’s post hoc test; ns = not significant. Representative fluorescence microscopy pictures of WT (Q) and PSEN 1 E280A NPC-derived ChLNs (R), WT (S) and mutant MenSCs-derived ChLNs (T), and WT (U) and mutant WJ-MSCs-derived ChLNs (V) stained with antibodies against ChAT (Q′,R′,SV), VAChT (Q″,R″,SV), and β III Tubulin (Q‴,R‴,SV). Quantitative data showing the mean fluorescence intensity for β III Tubulin (W), VAChT (X), and ChAT (Y). The figures represent 1 out of 3 independent experiments. The data are expressed as the mean ± SD; significant values were determined by one-way ANOVA with Tukey’s post hoc test; Image magnification, 20×.
Figure 5
Figure 5
The iPSCs-, MenSCs-, and WJ-MSCs-derived cerebral spheroids (CSs) express cholinergic markers: (A) graphic timeline of WT and PSEN 1 E280A MenSCs- and WJ-MSCs-derived cerebral spheroids (CSs); (BG) light microscopy pictures of WT (B) and PSEN 1 E280A iPCs::NPC-derived CSs (C), WT (D) and mutant MenSCs-derived CSs (E), and WT (F) and mutant WJ-MSCs-derived CSs (F). Representative fluorescence microscopy pictures of WT (H) and PSEN 1 E280A NPC-derived CSs (I), WT (J) and mutant MenSCs-derived CSs (K), and WT (L) and mutant WJ-MSCs-derived CSs (M) stained with antibodies against ChAT (H′,I′,JM), VAChT (H″,I″,JM), and β III tubulin (H‴,I‴,JM). Quantitative data showing the mean fluorescence intensity for β III Tubulin (N), VAChT (O), and ChAT (P). The figures represent 1 out of 3 independent experiments. The data are expressed as the mean ± SD; significant values were determined by one-way ANOVA with Tukey’s post hoc test; * p < 0.05; ** p < 0.005; *** p < 0.001. ns: not significant. Image magnification, 20×.
Figure 6
Figure 6
Determination of Alzheimer’s pathological proteins in ChLNs. Representative immunofluorescence microscopy of WT (AC,GI) and PSEN 1 E280A iPSCs::NPC-, MenSCs-, and JW-MSCs-derived ChLNs (DF,JL) stained to identify iAPPβf (A′,D′,B,C,E,F), ox-DJ-1 (A″,D″,B,C,E,F), p-TAU (G′,J′,HK), t-Tau (G″,J″,HK), and nuclei (A‴,D‴,B,C,E,F,HL). Quantitative data showing the mean fluorescence intensity for iAPPβf (M), ox-DJ-1 (N), and the p-TAU/t-TAU ratio (O). The figures represent 1 out of 3 independent experiments. The data are expressed as the mean ± SD; significant values were determined by one-way ANOVA with Tukey’s post hoc test; * p < 0.05; ** p < 0.005; *** p < 0.001. Image magnification, 20×. Flow cytometry analysis of WT and PSEN 1 E280A iPSCs::NPC- (P,S), MenSCs- (Q,T), and WJ-MSCs-derived ChLNs (R,U) to identify iAPPβf (PR), ox-DJ-1 (PR), and p-Tau (SU). The histograms represent 1 out of 3 independent experiments. The data are expressed as the mean ± SD; significant values were determined by one-way ANOVA with Tukey’s post hoc test; ** p < 0.005; *** p < 0.001.
Figure 7
Figure 7
Evaluation of mitochondrial membrane potential (ΔΨm) and ROS production in ChLNs. At day 35, WT and PSEN 1 E280A iPSC::NPC-derived ChLNs (AC), and at day 11, WT and PSEN 1 E280A MenSCs (DF), and WT and PSEN 1 E280A WJ-MSCs-derived ChLNs (GI) were stained with Hoechst, red Mitotracker, and dichlorofluorescein to identify nuclei, ΔΨm and ROS production. Images were analyzed, and quantitative data were compared (C,F,I). The figures represent one out of three independent experiments. The data are expressed as the mean ± SD; significant values were determined by one-way ANOVA with Tukey’s post hoc test; ** p < 0.005; *** p < 0.001. Image magnification 20×. White square area is magnified inset (A′,B′,D′,E′,G′,H′), magnification 100×.
Figure 8
Figure 8
Determination of apoptosis-associated proteins in ChLNs. Representative immunofluorescence microscopy of WT (AC,GI) and PSEN 1 E280A iPSCs::NPC- (D,J), MenSCs- (E,K), and JW-MSCs-derived ChLNs (F,L) stained to identify PUMA (A′,D′,B,C,E,F), p-JUN (A″,D″,B,C,E,F), TP53 (G′,J′,HK), CASP3 (G″,J″,HK), and nuclei (A‴,D‴,B,C,E,F,HL). Quantitative data showing the mean fluorescence intensity for PUMA (M), c-JUN (N), TP53 (O), and CASP3 (P). The figures represent 1 out of 3 independent experiments. The data are expressed as the mean ± SD; significant values were determined by one-way ANOVA with Tukey’s post hoc test; *** p < 0.001. Image magnification, 20×. Flow cytometry analysis of WT and PSEN 1 E280A iPSCs::NPC- (Q,T), MenSCs- (R,U), and WJ-MSCs-derived ChLNs (S,V) to identify PUMA (QS), p-JUN (QS), TP53 (TV), and CASP3 (TV). The histograms represent 1 out of 3 independent experiments. The data are expressed as the mean ± SD; significant values were determined by one-way ANOVA with Tukey’s post hoc test; *** p < 0.001.
Figure 9
Figure 9
Evaluation of Acetylcholine (ACh) response. Time-lapse images (0, 10, 20, 30, and 40 s) of Ca2+ fluorescence in WT and E280A iPSC-derived neurons after 31 and 35 days (n = 3 dishes) as a response to ACh treatment (A,B,D,E). Time-lapse images (0, 10, 20, 30, and 40 s) of Ca2+ fluorescence in PSEN 1 WT and E280A MenSCs- and WJ-MSCs- derived ChLNs after 11 days (n = 3 dishes) as a response to ACh treatment (G,H) ACh was puffed into the culture at 0 s (arrow). Then, the Ca2+ fluorescence of cells was monitored at the indicated times. Color contrast indicates fluorescence intensity: dark blue < light blue < green < yellow < red. (C,F,I) Normalized mean fluorescence signal (ΔF/F) over time, indicating temporal cytoplasmic Ca2+ elevation in response to ACh treatment in PSEN 1 WT and E280A cells. The data are expressed as the mean ± SD; significant values were determined by one-way ANOVA with Tukey’s post hoc test; * p < 0.05; ** p < 0.005; *** p < 0.001. Image magnification, 20×.
Figure 10
Figure 10
ELISA quantification of extracellular Aβ40 and Aβ42 peptides in supernatants from PSEN1 WT and PSEN 1 E280A cells. WT and PSEN1 E280A ChLNs cells were left in neural medium or minimal culture medium for 4 days. The levels of secreted Aβ1–40 and Aβ1–42 peptides were determined as described in the Section 4. The ELISA measurements of Aβ40 in the supernatant from WT and PSEN1 E280A cholinergic cells derived from iPSCs (A), MenSCs (B), and WJ-MSCs (C) cells at day 4. The ELISA measurements of Aβ42 in supernatant from WT and PSEN1E280A cholinergic cells derived from iPSCs (D), MenSCs (E), and WJ-MSCs (F) cells at day 4. The Aβ42 over Aβ40 ratio in PSEN1 E280A from iPSCs (G), MenSCs (H), and WJ-MSCs (I) compared with WT at day 4. The figures represent one out of three independent experiments. Significant values were determined by a one-way ANOVA with Tukey’s post hoc test. The data are presented as mean ± SD (* p < 0.05; ** p < 0.01).
Figure 11
Figure 11
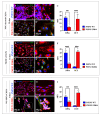
Determination of Alzheimer’s pathological proteins by immunofluorescence in cerebral spheroids (CSs). Representative immunofluorescence microscopy of WT (AC,GI) and PSEN 1 E280A iPSCs::NPC- (D,J), MenSCs- (E,K), and JW-MSCs-derived ChLNs (F,L) stained to identify iAPPβf (A′,D′,B,C,E,F), ox-DJ-1 (A″,D″,B,C,E,F), p-TAU (G′,J′,HK), t-Tau (G″,J″,HK), and nuclei (A‴,D‴,B,C,E,F,HL). Quantitative data showing the mean fluorescence intensity for iAPPβf (M), ox-DJ-1 (N), and the p-TAU/t-TAU ratio (O). The figures represent one out of three independent experiments. The data are expressed as the mean ± SD; significant values were determined by one-way ANOVA with Tukey’s post hoc test; * p < 0.05; ** p < 0.005; *** p < 0.001. Image magnification, 20×.
Figure 12
Figure 12
Determination of apoptosis-associated proteins by immunofluorescence in cerebral spheroids (CSs). Representative immunofluorescence microscopy of WT (AC,GI) and PSEN 1 E280A iPSCs::NPC- (D,J), MenSCs- (E,K), and JW-MSCs-derived ChLNs (F,L) stained to identify PUMA (A′,D′,B,C,E,F), p-c-JUN (A″,D″,B,C,E,F), TP53 (G′,J′,HK), CASP3 (G″,J″,HK), and nuclei (A‴,D‴,B,C,E,F,HL). Quantitative data showing the mean fluorescence intensity for PUMA (M), c-p-JUN (N), TP53 (O), and CASP3 (P). The figures represent one out of three independent experiments. The data are expressed as the mean ± SD; significant values were determined by one-way ANOVA with Tukey’s post hoc test; * p < 0.05; *** p < 0.001. Image magnification, 20×.

Similar articles

Cited by

References

    1. Mesulam M.M. Cholinergic circuitry of the human nucleus basalis and its fate in Alzheimer’s disease. J. Comp. Neurol. 2013;521:4124–4144. doi: 10.1002/cne.23415. - DOI - PMC - PubMed
    1. Lin C.P., Frigerio I., Boon B.D.C., Zhou Z., Rozemuller A.J.M., Bouwman F.H., Schoonheim M.M., van de Berg W.D.J., Jonkman L.E. Structural (dys)connectivity associates with cholinergic cell density in Alzheimer’s disease. Brain. 2022;145:2869–2881. doi: 10.1093/brain/awac093. - DOI - PMC - PubMed
    1. DeTure M.A., Dickson D.W. The neuropathological diagnosis of Alzheimer’s disease. Mol. Neurodegener. 2019;14:32. doi: 10.1186/s13024-019-0333-5. - DOI - PMC - PubMed
    1. Knopman D.S., Amieva H., Petersen R.C., Chételat G., Holtzman D.M., Hyman B.T., Nixon R.A., Jones D.T. Alzheimer disease. Nat. Rev. Dis. Primers. 2021;7:33. doi: 10.1038/s41572-021-00269-y. - DOI - PMC - PubMed
    1. Gallego Villarejo L., Bachmann L., Marks D., Brachthäuser M., Geidies A., Müller T. Role of Intracellular Amyloid β as Pathway Modulator, Biomarker, and Therapy Target. Int. J. Mol. Sci. 2022;23:4656. doi: 10.3390/ijms23094656. - DOI - PMC - PubMed

MeSH terms