Review
. 2023 Apr 30;14(5):986.
doi: 10.3390/mi14050986.

Polymeric and Paper-Based Lab-on-a-Chip Devices in Food Safety: A Review

Affiliations
Review

Polymeric and Paper-Based Lab-on-a-Chip Devices in Food Safety: A Review

Athina-Marina Mitrogiannopoulou et al. Micromachines (Basel). .

Abstract

Food quality and safety are important to protect consumers from foodborne illnesses. Currently, laboratory scale analysis, which takes several days to complete, is the main way to ensure the absence of pathogenic microorganisms in a wide range of food products. However, new methods such as PCR, ELISA, or even accelerated plate culture tests have been proposed for the rapid detection of pathogens. Lab-on-chip (LOC) devices and microfluidics are miniaturized devices that can enable faster, easier, and at the point of interest analysis. Nowadays, methods such as PCR are often coupled with microfluidics, providing new LOC devices that can replace or complement the standard methods by offering highly sensitive, fast, and on-site analysis. This review's objective is to present an overview of recent advances in LOCs used for the identification of the most prevalent foodborne and waterborne pathogens that put consumer health at risk. In particular, the paper is organized as follows: first, we discuss the main fabrication methods of microfluidics as well as the most popular materials used, and then we present recent literature examples for LOCs used for the detection of pathogenic bacteria found in water and other food samples. In the final section, we summarize our findings and also provide our point of view on the challenges and opportunities in the field.

Keywords: fabrication techniques; food safety; lab on a chip; microfluidics; paper-based; pathogen detection; polymer-based; water safety.


Conflict of interest statement

The authors declare no conflict of interest.

Figures

Figure 11
Figure 11
(I) (a) Image of the LOC on PCB and (b) schematic representation of the portable system comprising the LOC, the temperature control unit, and the software for the analysis. Reproduced from Ref. [170] with permission from MDPI Micromachines (CC by 4.0) (II) (A) Image shows the size of a microchip compared to a coin and (B) depicts how target cells are captured by aptamers with immune responses Reproduced from Ref. [172] with permission from Elsevier.
Figure 11
Figure 11
(I) (a) Image of the LOC on PCB and (b) schematic representation of the portable system comprising the LOC, the temperature control unit, and the software for the analysis. Reproduced from Ref. [170] with permission from MDPI Micromachines (CC by 4.0) (II) (A) Image shows the size of a microchip compared to a coin and (B) depicts how target cells are captured by aptamers with immune responses Reproduced from Ref. [172] with permission from Elsevier.
Figure 1
Figure 1
(A) This figure depicts the basic parts of a microfluidic device and some key targets analytes (i.e., proteins, cells, DNA, etc.). Reproduced with permission from Ref. [14] Elsevier in Analytical Chemistry. (B) This figure summarizes all the fundamental LOC device detection methods, materials, and fabrication techniques. The most commonly used detection techniques are electrochemical, optical, and colorimetric, and the most commonly employed materials are paper, PDMS, and silicon/glass. Lithography, printing, and laser-based techniques are widely used methods for microfluidic fabrication. Reproduced with permission from Ref. [15] Elsevier Sensors and Actuators A: Physical. (C) The number of papers published during the period 2014–2022 in the thematic area: Microfluidics/LOCS for bacteria detection in Food.
Figure 2
Figure 2
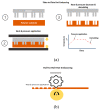
(a) Schematic representation of the main steps during hot embossing. ①–③: The polymer substrate is placed between the two heated plates in which also pressure can be applied (i.e., heated press). The temperature is set to or above the glass transition of the polymer, then pressure is applied, and the pattern is transferred to the softened polymer. Eventually, the temperature is decreased, and the pressure is released. (b) Roll-to-Roll hot embossing is a continuous process and preheating the substrate is not necessary. The upper roll contains the master that is heated, constant pressure is applied, and the pattern is transferred to the substrate.
Figure 3
Figure 3
Schematic illustration of the injection molding process. The temperature profile versus time is also provided. The thermoplastic material is fed into a heated barrel and injected into a mold cavity where it is left to cool down and harden. Eventually, the product or the microfluidic device is fabricated.
Figure 4
Figure 4
(Left) mold fabrication process using SU-8. (Right) PDMS casting on the SU-8 mold for the development of a microfluidic device and subsequent bonding after plasma treatment to seal the device. Reproduced with permission from [25] (CC by 4.0).
Figure 5
Figure 5
CAD design and 3D printing of the microfluidic channel, which is used as a mold to produce PDMS microfluidic chips. Reproduced with permission from [67] (© 2023 Felton et al.), (CC by 4.0).
Figure 6
Figure 6
Milestones in the development of microfluidic paper-based chips. Reproduced with permission from [87].
Figure 7
Figure 7
Fabrication of μPADs with wax printing: Paraffin wax is printed on filter paper, then it cools and becomes solid while forming the desired microfluidic patterns. Reproduced with permission from Ref. [93].
Figure 8
Figure 8
① Using inkjet printing of poly(styrene) with toluene and colored ink, to visualize the paper’s structure. Reproduced with permission from Ref. [85] 2008 American Chemical Society. ② Micro-PADs fabricated via printing a pattern on chromatography paper with an ink-jet printer. Reproduced with permission from Ref. [82] PMC Open Access Subset. ③ Hydrophilic channels can be created on paper by printing hydrophobic PDMS, followed by introducing a 10-μL sample into the channels. Reproduced with permission from Ref. [103] © 2023 Copyright American Chemical Society.
Figure 9
Figure 9
Optical lithography is a high-quality technique with many applications. The basic process of photolithography on paper-based microfluidics involves impregnating an entire sheet of paper with a negative photoresist, then exposing it to UV light through a photomask to crosslink the photoresist in the desired pattern and developing the paper in solvent to remove any unexposed resist. (a) Optical lithography on paper for the fabrication of a paper based device and (b) Plasma processing, cut out of the device and final modification steps on the paper based device. Reproduced with permission from Ref. [31].
Figure 10
Figure 10
This figure depicts the three components that comprise a biosensor. First, the analyzer identifies biological elements (i.e., cells), the bioreceptor, which is responsible for binding target analytes, and the transducer, which converts current energy into other forms. This biosensor is positioned on top of a graphite substrate. Although different stable, transparent, stretchable, biocompatible, and transportable materials can be used in place of graphite as a biosensor’s substrate. Reproduced with permission from Ref. [132] (CC by 4.0).
Figure 12
Figure 12
(A) Schematic illustration of the microfluidic disc, consisting of 24 inlets and outlets respectively, in order to conduct tests simultaneously. The inlet allows the fluid to enter and cross the microchannels, which form zig-zag structures. (B) The second image focuses on a part of the microchip, where the microchannels are crisscrossing, forming a larger zigzag. (C) The third image focuses on a microchannel’s part, that consists of multiple and in-a-row microchambers, in which targeted cells are trapped by the centrifugal force. (D) The dimensions of a microchamber, into which there are shaped cavities as well as the width of the microchannel, which corresponds to 100 μm are depicted. Reproduced from Ref. [179] with permission from MDPI Micromachines (CC by 4.0).
Figure 13
Figure 13
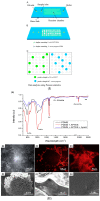
(I) (A) A schematic representation of a microfluid platform placed upon a glass substrate is depicted. The microdevice is composed of two inlets, one for the sample and the other for the mineral-saturated polydimethylsiloxane oil. The addition of the oil has the purpose to prevent the evaporation and crisscrossing of the droplet. Furthermore, in the center of the microdevice, there are the reaction chambers where fluorescent probes, specially designed to bind with L. monocytogenes or E. coli are contained. (B) An illustration of the microfluidic chamber, where the two bacteria have been trapped and detected. (C)The detected bacteria have reacted with the fluorescent probes, producing color. The green color corresponds to the positive test for E. coli identification, while the blue corresponds to L. monocytogenes. Reproduced from Ref. [188] with permission from Elsevier B.V. Biosensors and Bioelectronics. (II) (A) From the above diagram we conclude that the PDMS + APTES + ApoH structure has a better intensity in comparison with the PDMS + APTES and the simple PDMS. In addition, we notice that from 600 to 3000 wavelength there is a difference in intensity between the 3 structures, while from 3000 and up the difference is insignificant. (B) An image of the sponge prior to the fluorescence (C) Picture of the fluorescent PDMS sponge (D) A cross-sectional view of the PDMS sponge after bacterial capturing (E) PDMS sponge and its natural cavities (F) Targeted bacteria trapped in the cavities of the sponge, that works correspondingly to the microchambers (G) An up-close image of the bacteria on the sponge’s surface. Reproduced with permission from Ref. [189] with permission from Elsevier B.V. Food control.
Figure 14
Figure 14
(A) In figure A the sites where EDTA has been loaded are depicted, resulting in a noticeable change in the color after the reaction has occurred. The color change is depending on whether there is a negative or positive control. (B) In the second figure, the primers were pre-loaded on the microchip, for the capturing of the targeted cells, which causes a color change. In both images, the distance between the outputs is indicated and corresponds to 10 μm. Reproduced from Ref. [195] with permission from the Society of Chemical Industry.
Figure 15
Figure 15
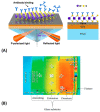
(A) In this figure, a microchannel is depicted in which antibodies bind to WS2. The substrate of the microchannel is composed of silicon, and beneath it is a gold film. Additionally, polarized light is positioned in the microchannel’s center. The light source emits polarized incident light, while the detector collects the reflected light, whose intensity is diminished due to the resonance angle (SPR). Surface plasmon resonance permits optical investigation of the molecular interaction between a moving molecule and a fixed molecule on a substrate. Reproduced with permission from Ref. [207] CC by 4.0). (B) An illustration of the heater plate is shown in which the plate is divided into three sections, based on the conducted procedure and the necessary temperature for the PCR amplification. Reproduced with permission from [206]. Copyright © 2023 Shou-Yu Ma et al.

Similar articles

Cited by

References

    1. Sedighi A., Li P.C. Challenges and Future Trends in DNA Microarray Analysis. Compr. Anal. Chem. 2014;63:25–46. doi: 10.1016/B978-0-444-62651-6.00002-7. - DOI
    1. Escarpa A. Lights and shadows on Food Microfluidics. Lab Chip. 2014;14:3213–3224. doi: 10.1039/C4LC00172A. - DOI - PubMed
    1. Ghallab Y., Badawy W. Sensing methods for dielectrophoresis phenomenon: From bulky instruments to lab-on-a-chip. IEEE Circuits Syst. Mag. 2004;4:5–15. doi: 10.1109/MCAS.2004.1337805. - DOI
    1. Yager P., Edwards T., Fu E., Helton K., Nelson K., Tam M.R., Weigl B.H. Microfluidic diagnostic technologies for global public health. Nature. 2006;442:412–418. doi: 10.1038/nature05064. - DOI - PubMed
    1. Weng X., Neethirajan S. Ensuring food safety: Quality monitoring using microfluidics. Trends Food Sci. Technol. 2017;65:10–22. doi: 10.1016/j.tifs.2017.04.015. - DOI

LinkOut - more resources