. 2023 Apr 25;16(5):644.
doi: 10.3390/ph16050644.

Lactylation-Related Gene Signature Effectively Predicts Prognosis and Treatment Responsiveness in Hepatocellular Carcinoma

Affiliations

Lactylation-Related Gene Signature Effectively Predicts Prognosis and Treatment Responsiveness in Hepatocellular Carcinoma

Zhe Cheng et al. Pharmaceuticals (Basel). .

Abstract

Background: Hepatocellular carcinoma (HCC) is a malignant tumor associated with high morbidity and mortality. Therefore, it is of great importance to develop effective prognostic models and guide clinical treatment in HCC. Protein lactylation is found in HCC tumors and is associated with HCC progression.

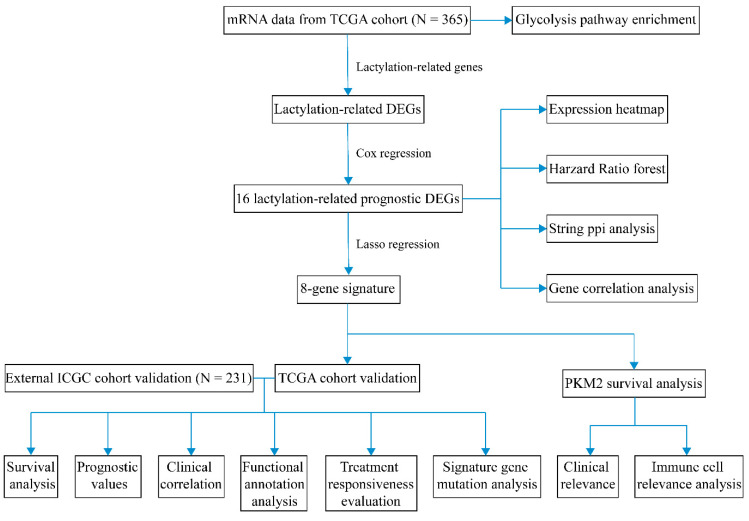
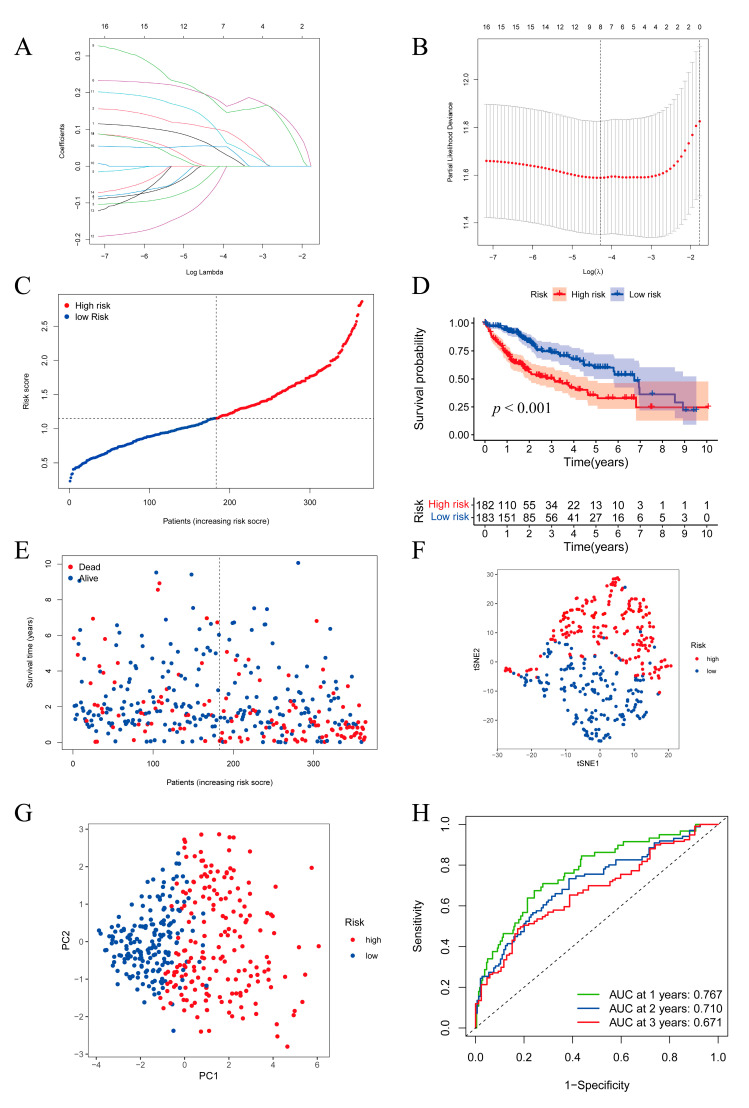
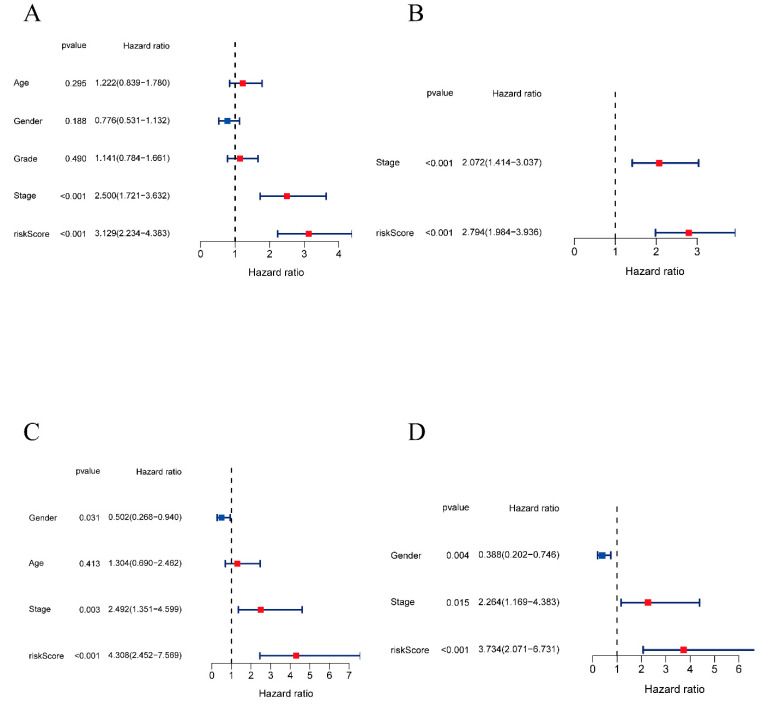
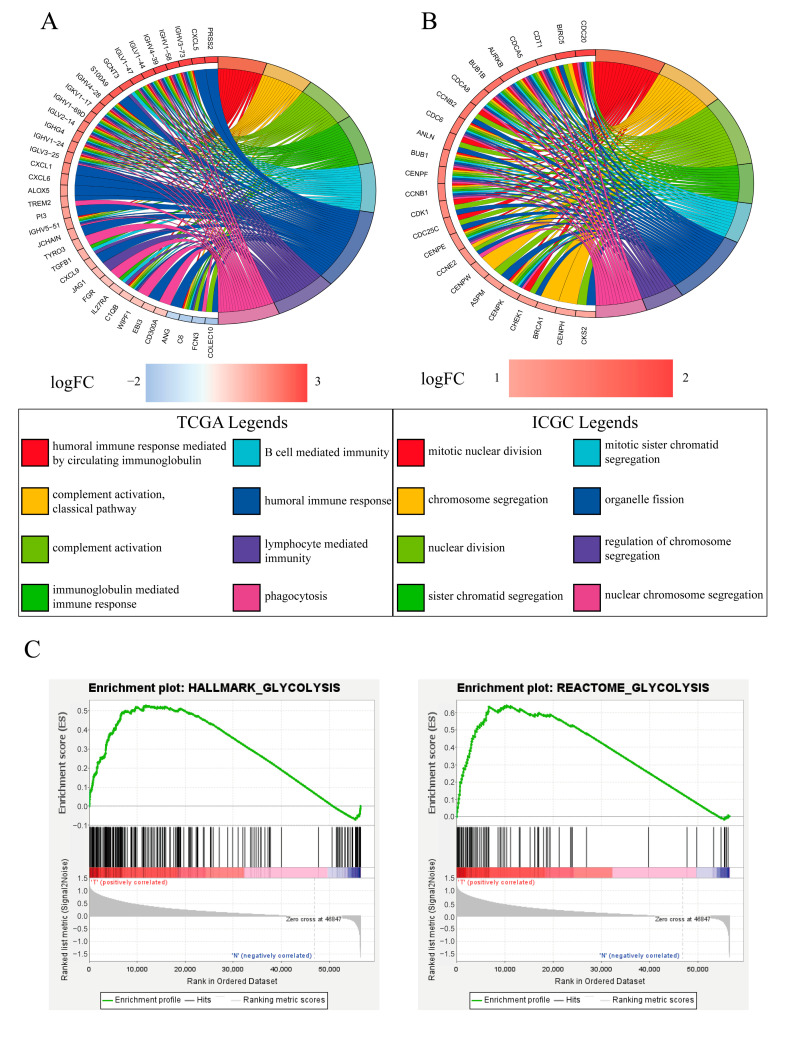
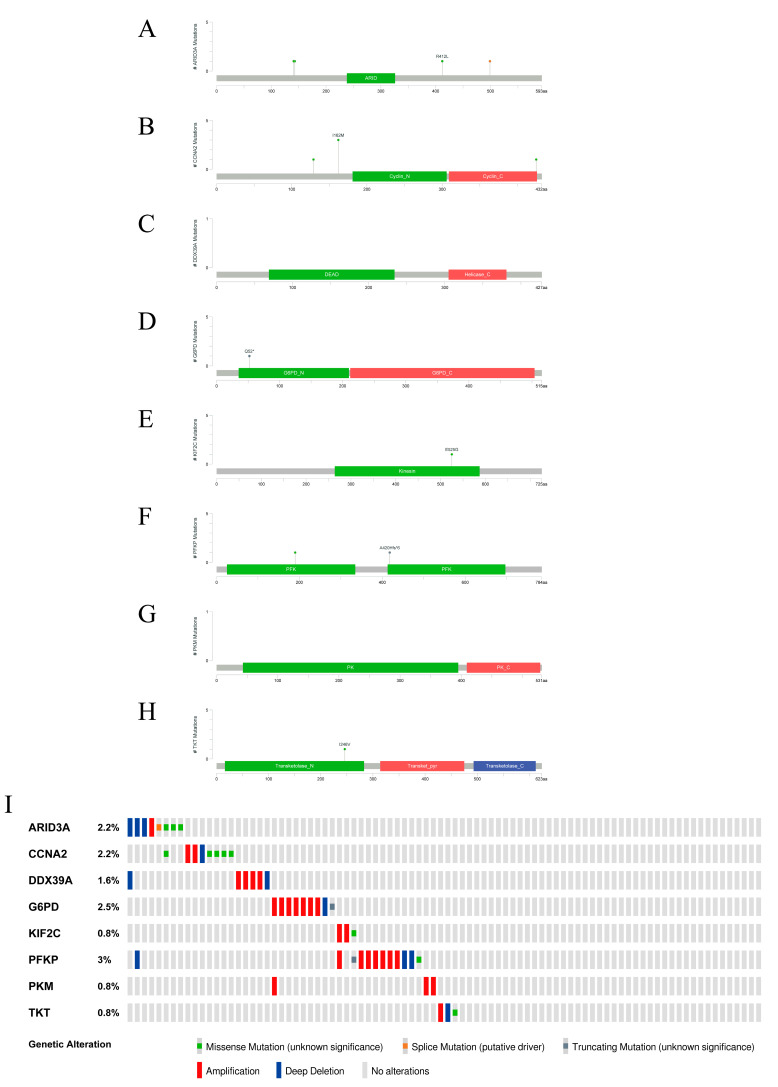
Methods: The expression levels of lactylation-related genes were identified from the TCGA database. A lactylation-related gene signature was constructed using LASSO regression. The prognostic value of the model was assessed and further validated in the ICGC cohort, with the patients split into two groups based on risk score. Glycolysis and immune pathways, treatment responsiveness, and the mutation of signature genes were analyzed. The correlation between PKM2 expression and the clinical characteristics was investigated.

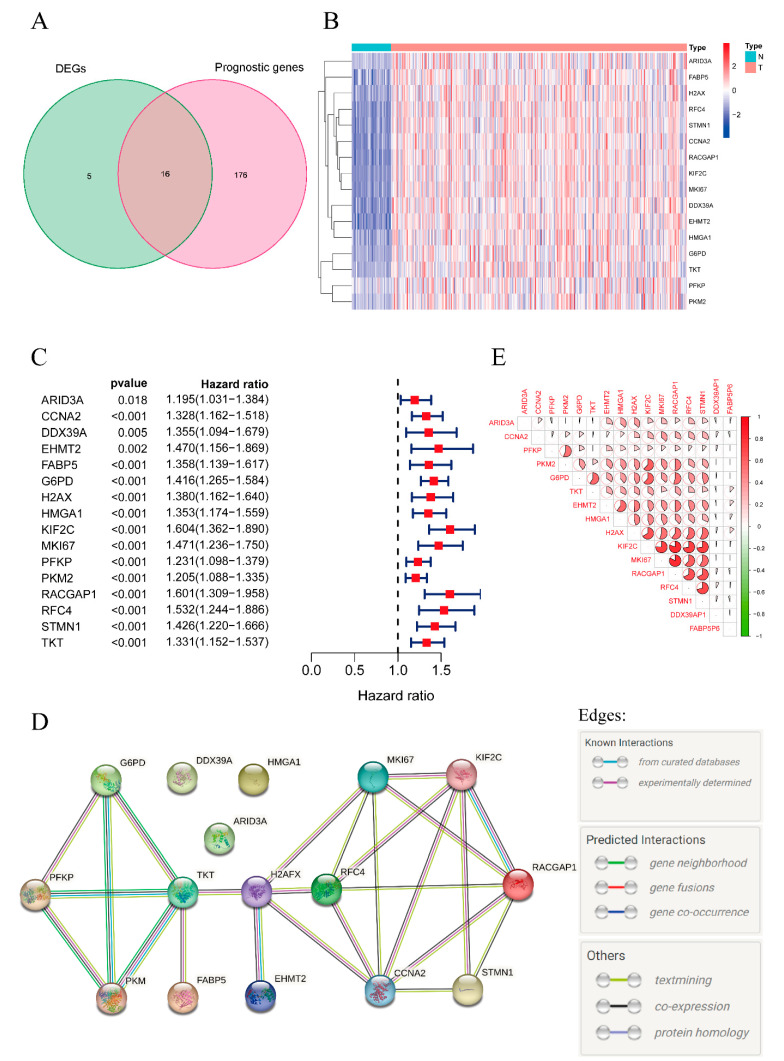
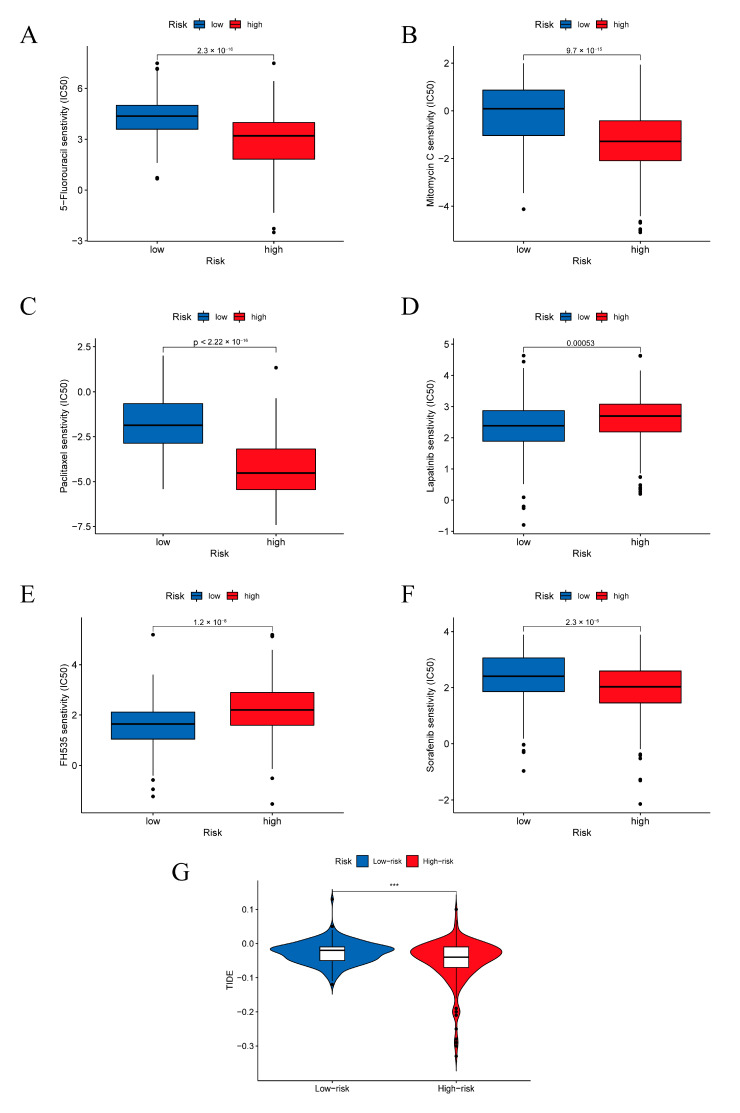
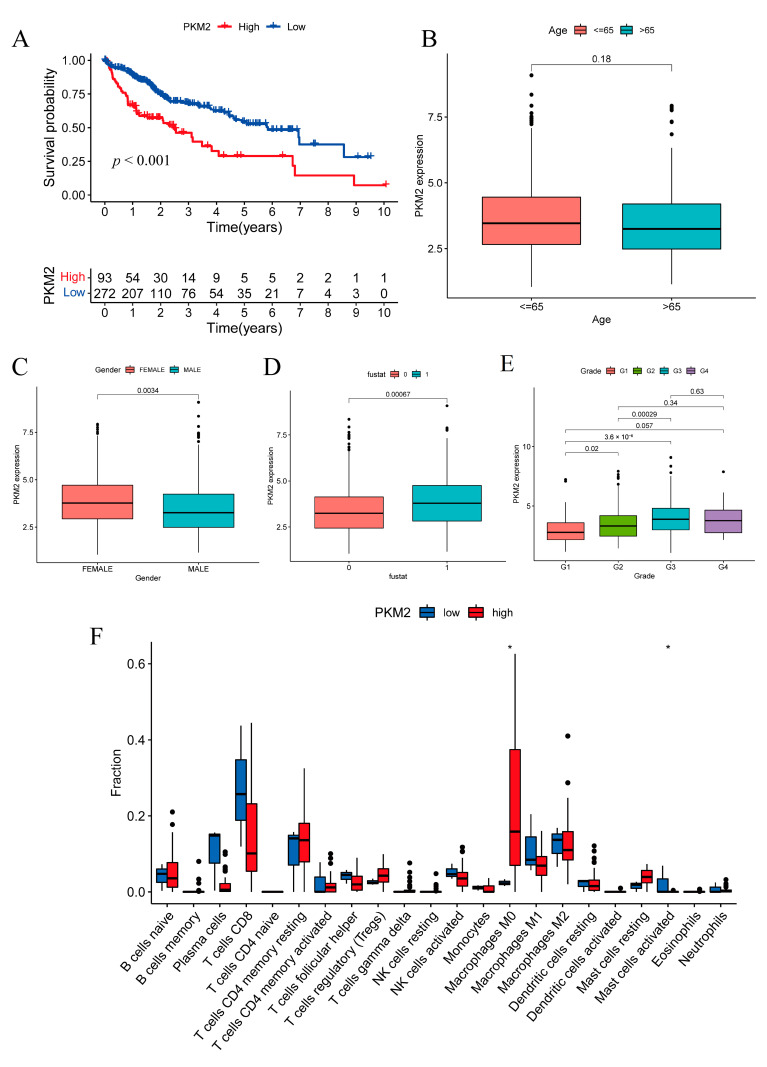
Results: Sixteen prognostic differentially expressed lactylation-related genes were identified. An 8-gene signature was constructed and validated. Patients with higher risk scores had poorer clinical outcomes. The two groups were different in immune cell abundance. The high-risk group patients were more sensitive to most chemical drugs and sorafenib, while the low-risk group patients were more sensitive to some targeted drugs such as lapatinib and FH535. Moreover, the low-risk group had a higher TIDE score and was more sensitive to immunotherapy. PKM2 expression correlated with clinical characteristics and immune cell abundance in the HCC samples.

Conclusions: The lactylation-related model exhibited robust predictive efficiency in HCC. The glycolysis pathway was enriched in the HCC tumor samples. A low-risk score indicated better treatment response to most targeted drugs and immunotherapy. The lactylation-related gene signature could be used as a biomarker for the effective clinical treatment of HCC.

Keywords: hepatocellular carcinoma; lactylation-related genes; prognostic model; protein lactylation; treatment response; tumor immune environment.


Conflict of interest statement

The authors declare no conflict of interest.

Figures

Figure 1
Figure 1
Study workflow diagram.
Figure 2
Figure 2
Identification of prognostic lactylation-related genes in HCC. (A) Venn diagram showing the quantities of the prognostic lactylation-related genes. (B) Heatmap presenting the expression levels of the prognostic lactylation-related genes (Type N: adjacent tissues; T: tumor tissues). (C) Forest plot of prognostic lactylation-related DEGs. (D) PPI network showing known and predicted interactions of proteins and genes among the prognostic lactylation-related DEGs. (E) The results of the gene correlation analysis between intersectional genes.
Figure 3
Figure 3
Construction of the prognostic signature in the TCGA cohort. (A) The gene coefficient profiles determined by LASSO regression. (B) The partial likelihood deviance plotted with log (λ). (C) Distribution of the risk score in the TCGA cohort. (D) Kaplan–Meier survival curves of the HCC overall survival in the TCGA cohort. (E) Distribution of survival status with an increasing risk score in the TCGA cohort. (F) T-SNE analysis of patients in the TCGA cohort. (G) PCA of patients in the TCGA cohort. (H) ROC curves showing that the 8-gene prognostic signature had satisfactory predictive efficacy in the TCGA cohort.
Figure 4
Figure 4
Univariate and multivariate independent prognostic analyses. (A) Univariate independent prognostic analysis in the TCGA cohort. (B) Multivariate independent prognostic analysis in the TCGA cohort. (C) Univariate independent prognostic analysis in the ICGC cohort. (D) Multivariate independent prognostic analysis in the ICGC cohort.
Figure 5
Figure 5
Functional annotation analysis and glycolytic pathway GSEA. (A) GO annotation analysis in the TCGA cohort. (B) GO annotation analysis in the ICGC cohort. (C) GSEA of glycolysis pathway enrichment among the tumor and adjacent tissues.
Figure 6
Figure 6
Evaluation of treatment responsiveness in the TCGA cohort. Responsiveness to the chemical drugs 5-fluorouracil (A), mitomycine C (B), and paclitaxel (C) in the TCGA cohort. Responsiveness to the targeted drugs lapatinib (D), FH535 (E), and sorafenib (F) in the TCGA cohort. (G) Tide scores of patients in the TCGA cohort. *** p < 0.001.
Figure 7
Figure 7
Signature gene structure and mutation distribution. (AH) The structural domains of each gene: ARID3A/DRIL1, CCNA2, DDX39A/DDX39, G6PD, KIF2C/KNSL6, PFKP, PKM, and TKT. (I) The aggregate mutation conditions of the eight genes.
Figure 8
Figure 8
Correlations between PKM2 expression, clinical characteristics and immune cell infiltration. (A) HCC OS was correlated with the PKM2 expression levels in the TCGA cohort. (B) Patient age showed no significant correlation with the PKM2 expression level. (C) Female patients tended to have higher PKM2 expression levels than male patients. (D) Patient survival state correlated with PKM2 expression level (fustat 0: alive, 1: dead). (E) Patient grades partially correlated with the PKM2 expression level (Grades 1, 2, 3) except for Grade 4. (F) Immune cell infiltration analysis indicated that there were differences in the M0 macrophages and activated mast cells between the PKM2 high and low subgroups (The bullets in the figure show the statistical outliers in the data). * p < 0.05.

References

    1. Sung H., Ferlay J., Siegel R.L., Laversanne M., Soerjomataram I., Jemal A., Bray F. Global Cancer Statistics 2020: GLOBOCAN Estimates of Incidence and Mortality Worldwide for 36 Cancers in 185 Countries. CA Cancer J. Clin. 2021;71:209–249. doi: 10.3322/caac.21660. - DOI - PubMed
    1. Wang H.C., Haung L.Y., Wang C.J., Chao Y.J., Hou Y.C., Yen C.J., Shan Y.S. Tumor-associated macrophages promote resistance of hepatocellular carcinoma cells against sorafenib by activating CXCR2 signaling. J. Biomed. Sci. 2022;29:99. doi: 10.1186/s12929-022-00881-4. - DOI - PMC - PubMed
    1. Chu Y.D., Fan T.C., Lai M.W., Yeh C.T. GALNT14-mediated O-glycosylation on PHB2 serine-161 enhances cell growth, migration and drug resistance by activating IGF1R cascade in hepatoma cells. Cell Death Dis. 2022;13:956. doi: 10.1038/s41419-022-05419-y. - DOI - PMC - PubMed
    1. Liu P.H., Hsu C.Y., Hsia C.Y., Lee Y.H., Su C.W., Huang Y.H., Lee F.Y., Lin H.C., Huo T.I. Prognosis of hepatocellular carcinoma: Assessment of eleven staging systems. J. Hepatol. 2016;64:601–608. doi: 10.1016/j.jhep.2015.10.029. - DOI - PubMed
    1. Zhang D., Tang Z., Huang H., Zhou G., Cui C., Weng Y., Liu W., Kim S., Lee S., Perez-Neut M., et al. Metabolic regulation of gene expression by histone lactylation. Nature. 2019;574:575–580. doi: 10.1038/s41586-019-1678-1. - DOI - PMC - PubMed

LinkOut - more resources