. 2023 May 11;16(5):732.
doi: 10.3390/ph16050732.

Nonselective and A2a-Selective Inhibition of Adenosine Receptors Modulates Renal Perfusion and Excretion Depending on the Duration of Streptozotocin-Induced Diabetes in Rats

Affiliations

Nonselective and A2a-Selective Inhibition of Adenosine Receptors Modulates Renal Perfusion and Excretion Depending on the Duration of Streptozotocin-Induced Diabetes in Rats

Joanna Dorota Sitek et al. Pharmaceuticals (Basel). .

Abstract

Long-lasting hyperglycaemia may alter the role of adenosine-dependent receptors (P1R) in the control of kidney function. We investigated how P1R activity affects renal circulation and excretion in diabetic (DM) and normoglycaemic (NG) rats; the receptors' interactions with bioavailable NO and H2O2 were also explored. The effects of adenosine deaminase (ADA, nonselective P1R inhibitor) and P1A2a-R-selective antagonist (CSC) were examined in anaesthetised rats, both after short-lasting (2-weeks, DM-14) and established (8-weeks, DM-60) streptozotocin-induced hyperglycaemia, and in normoglycaemic age-matched animals (NG-14, NG-60, respectively). The arterial blood pressure, perfusion of the whole kidney and its regions (cortex, outer-, and inner medulla), and renal excretion were determined, along with the in situ renal tissue NO and H2O2 signals (selective electrodes). The ADA treatment helped to assess the P1R-dependent difference in intrarenal baseline vascular tone (vasodilation in DM and vasoconstriction in NG rats), with the difference being more pronounced between DM-60 and NG-60 animals. The CSC treatment showed that in DM-60 rats, A2aR-dependent vasodilator tone was modified differently in individual kidney zones. Renal excretion studies after the ADA and CSC treatments showed that the balance of the opposing effects of A2aRs and other P1Rs on tubular transport, seen in the initial phase, was lost in established hyperglycaemia. Regardless of the duration of the diabetes, we observed a tonic effect of A2aR activity on NO bioavailability. Dissimilarly, the involvement of P1R in tissue production of H2O2, observed in normoglycaemia, decreased. Our functional study provides new information on the changing interaction of adenosine in the kidney, as well as its receptors and NO and H2O2, in the course of streptozotocin diabetes.

Keywords: adenosine receptors; hydrogen peroxide; hyperglycaemia; nitric oxide; renal blood flow; renal excretion; streptozotocin.


Conflict of interest statement

The authors declare no conflict of interest.

Figures

Figure 1
Figure 1
Blood, plasma (ad), and renal excretion parameters (e,f) for Tac:Cmd:SD rats before (Day 0) and 14 or 60 days after streptozotocin administration. Measurements in tail vein samples and in metabolic cages were performed before i.p. streptozotocin (STZ) injection (Day: 0), and 3 days before acute experiments performed on day 14 (light grey boxes) or 60 (dark grey boxes) after STZ administration. The value distribution is shown as a box-and-whisker plot (the low and upper boundary of the box indicate 25th and 75th percentiles, respectively; the median is shown as the line inside the box; the mean value is marked with “×”. Whiskers drawn below and above the box show the 10th and 90th percentiles, respectively); N values are indicated in square brackets; p = 0.05 was taken as borderline significance: * different vs. the preceding day 0; † different vs. day 14.
Figure 2
Figure 2
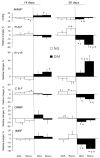
Effects of adenosine deaminase (ADA) on systemic and renal haemodynamics in normo- and hyperglycaemic rats (NG and DM, respectively) determined from acute experiments performed 14 or 60 days after streptozotocin or vehicle injection. The maximal stable responses induced by ADA and the values measured at the end of recovery period are shown as absolute MABP changes, and as percent mean differences (mean ± SEM) from the baseline values for other parameters. MABP, RVR and RBF, CBF, OMBF, IMBF—mean arterial blood pressure, renal vascular resistance and whole kidney, cortical, outer, and inner medullary blood flow, respectively. p = 0.05 was set as borderline significance: * different vs. the preceding baseline value, † different vs. the change in the corresponding NG group, & different vs. the change in the 14-day group.
Figure 3
Figure 3
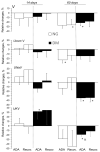
Effects of adenosine deaminase (ADA) on excretory function of the kidneys in normo- and hyperglycaemic rats (NG and DM, respectively) measured in acute experiments performed 14 or 60 days after streptozotocin or vehicle injection. The maximal stable responses induced by ADA are provided, as well as the values measured in the last period of recovery after ADA infusion, and are shown as percent mean differences (mean ± SEM) from the preceding baseline value. V and UosmV, UNaV, and UKV—urine flow and renal excretion of total solute, sodium, and potassium, respectively. p = 0.05 was set as borderline significance: * different vs. the preceding baseline value, & different vs. the change in the 14-day group.
Figure 4
Figure 4
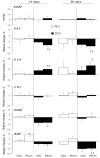
Effects of CSC (A2a receptor antagonist) on systemic and renal haemodynamics in normo- and hyperglycaemic rats (NG and DM, respectively), determined 14 or 60 days after streptozotocin or vehicle injection. The maximal stable responses induced by CSC and the values measured at the end of the recovery period are shown as absolute MABP changes and as percent mean differences (mean ± SEM) from baseline values for other parameters. MABP, RVR and RBF: CBF, OMBF, and IMBF—mean arterial blood pressure, renal vascular resistance and blood flow: whole kidney, cortical, outer, and inner medullary, respectively. p = 0.05 was set as borderline significance: * different vs. the preceding baseline value; † different vs. the change in the corresponding NG group.
Figure 5
Figure 5
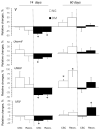
Effects of CSC (A2a receptor antagonist) on excretory function of the kidneys in normo- and hyperglycaemic rats (NG and DM, respectively), determined 14 or 60 days after streptozotocin or vehicle injection. The maximal stable CSC induced responses and the values observed in the last period of recovery after CSC infusion withdrawal are shown as mean differences from baseline values (mean ± SEM). V and UosmV, UNaV, and UKV—urine flow and renal excretion of total solute, sodium, and potassium, respectively. p = 0.05 was set as borderline significance: * different vs. the preceding baseline value.
Figure 6
Figure 6
Effects of adenosine deaminase (ADA) or its solvent (Rs) on NO and H2O2 signals in situ in the kidney medulla of normo- and hyperglycaemic rats (NG and DM, respectively), measured in acute experiments 14 (a,c) or 60 days (b,d) after streptozotocin or vehicle injection. The time course of changes induced by ADA or Rs (Ringer solution), observed after drug or solvent withdrawal. The data are expressed as mean differences (mean ± SEM) from baseline, N = 5–8. p = 0.05 was set as borderline significance: * different vs. the preceding baseline value, † different vs. the change in the corresponding NG group, and # different vs. the change in solvent-infused rats.
Figure 7
Figure 7
Effects of A2a receptor antagonist (CSC) or its solvent (S) on in situ NO and H202 signals in the kidney medulla of normo- and hyperglycaemic rats (NG and DM, respectively), measured in acute experiments 14 (a,c) or 60 days (b,d) after streptozotocin or vehicle injection. The time course of changes induced by CSC or S (8% DMSO in saline solution), observed after drug or solvent withdrawal, are shown as mean differences (mean ± SEM) from baseline. N = 5–8. p = 0.05 was set as borderline significance: * different vs. the preceding baseline value, † different vs. the change in the corresponding NG group, and # different vs. the change in solvent-infused rats.

Similar articles

Cited by

References

    1. Antonioli L., Blandizzi C., Csóka B., Pacher P., Haskó G. Adenosine signalling in diabetes mellitus—Pathophysiology and therapeutic considerations. Nat. Rev. Endocrinol. 2015;11:228–241. doi: 10.1038/nrendo.2015.10. - DOI - PubMed
    1. Peleli M., Carlstrom M. Adenosine signaling in diabetes mellitus and associated cardiovascular and renal complications. Mol. Asp. Med. 2017;55:62–74. doi: 10.1016/j.mam.2016.12.001. - DOI - PubMed
    1. Komers R., Anderson S. Paradoxes of nitric oxide in the diabetic kidney. Am. J. Physiol. Physiol. 2003;284:F1121–F1137. doi: 10.1152/ajprenal.00265.2002. - DOI - PubMed
    1. Palm F., Cederberg J., Hansell P., Liss P., Carlsson P.-O. Reactive oxygen species cause diabetes-induced decrease in renal oxygen tension. Diabetologia. 2003;46:1153–1160. doi: 10.1007/s00125-003-1155-z. - DOI - PubMed
    1. Forbes J.M., Coughlan M.T., Cooper M.E. Oxidative Stress as a Major Culprit in Kidney Disease in Diabetes. Diabetes. 2008;57:1446–1454. doi: 10.2337/db08-0057. - DOI - PubMed