Review
. 2023 Apr 23;15(5):1323.
doi: 10.3390/pharmaceutics15051323.

Recent Advances of Fe(III)/Fe(II)-MPNs in Biomedical Applications

Affiliations
Review

Recent Advances of Fe(III)/Fe(II)-MPNs in Biomedical Applications

Weipeng Chen et al. Pharmaceutics. .

Abstract

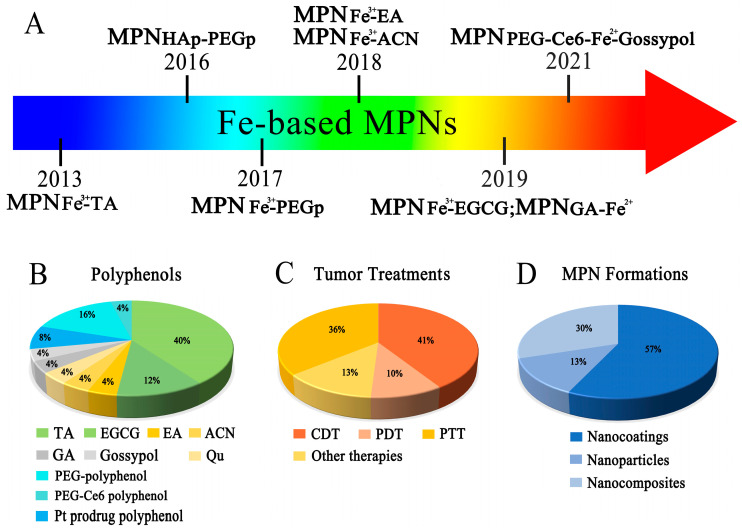
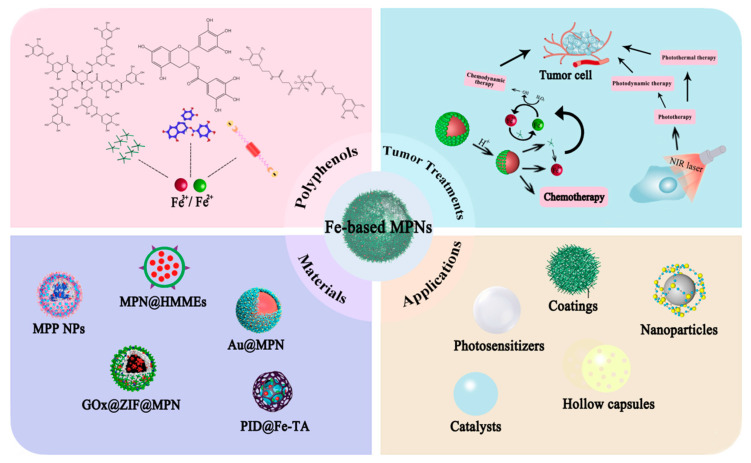
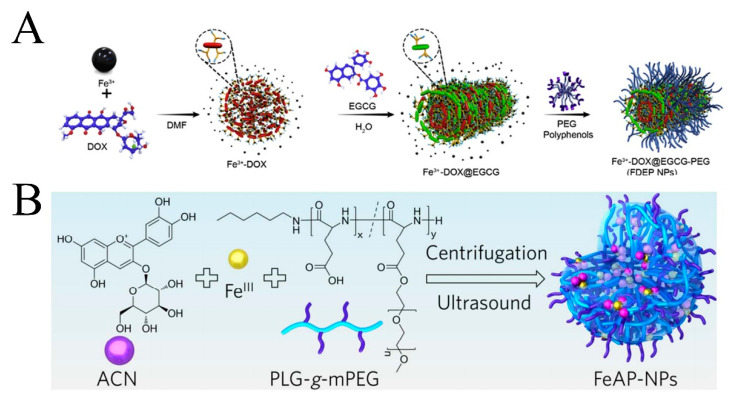
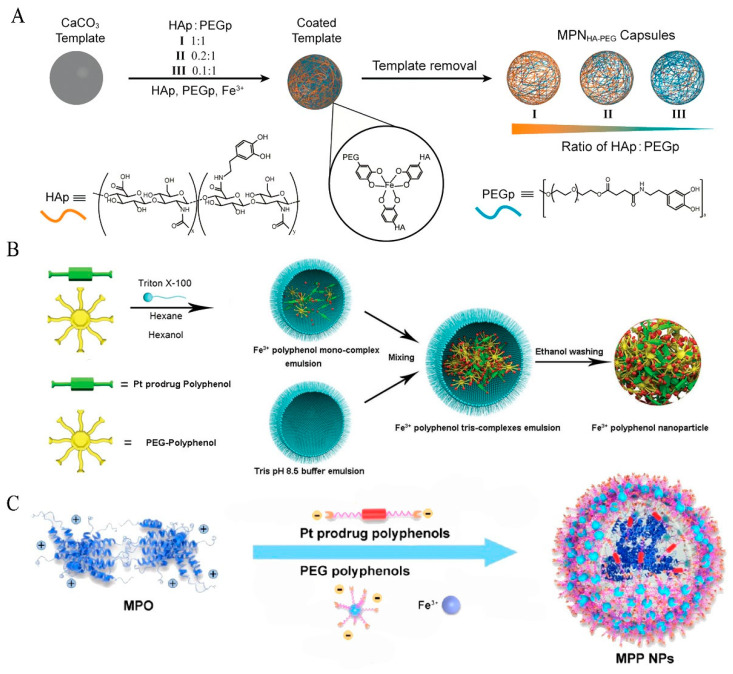
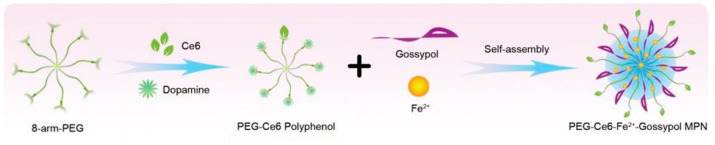
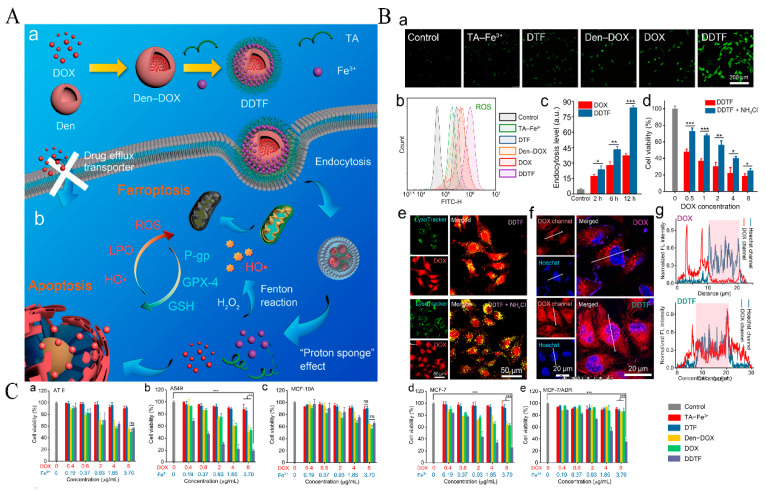
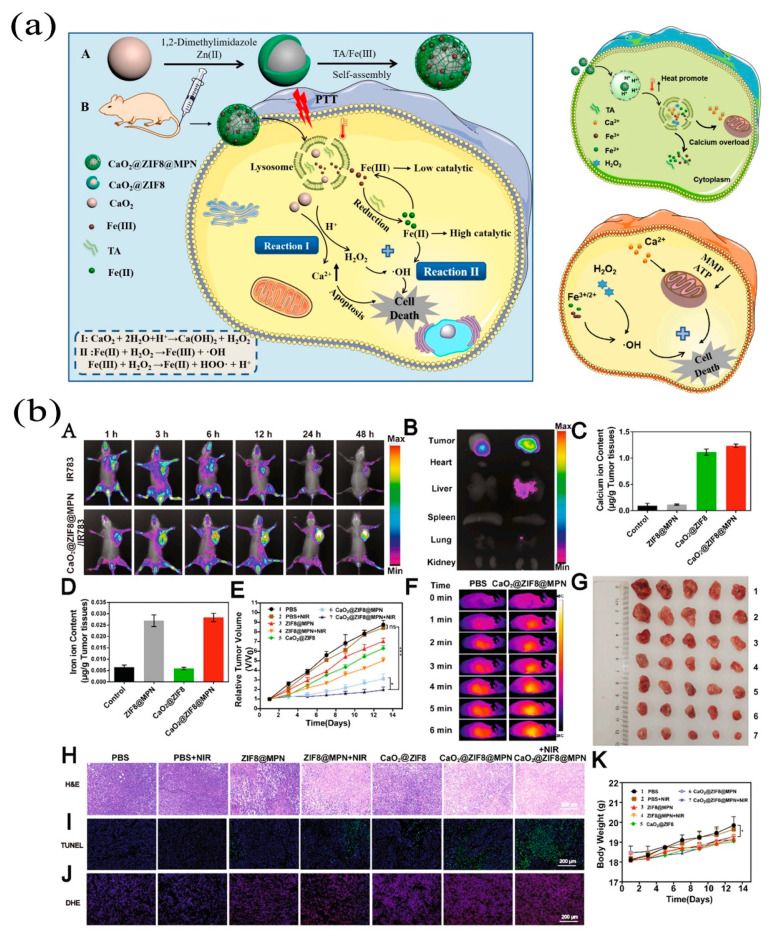
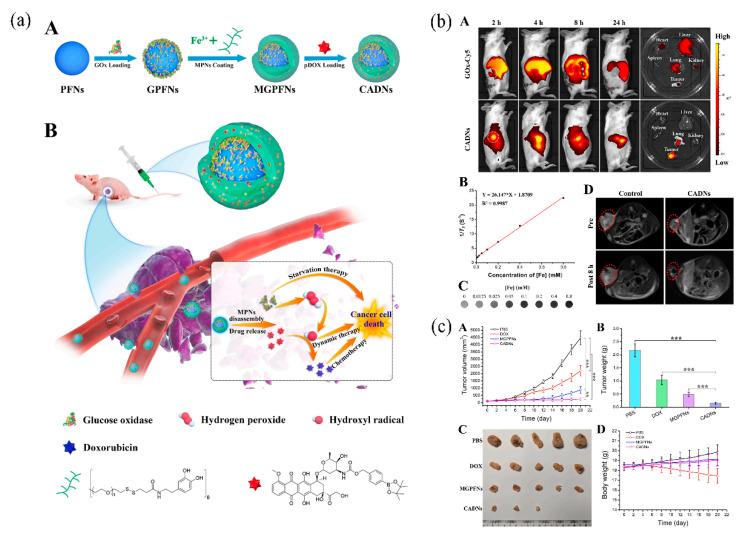
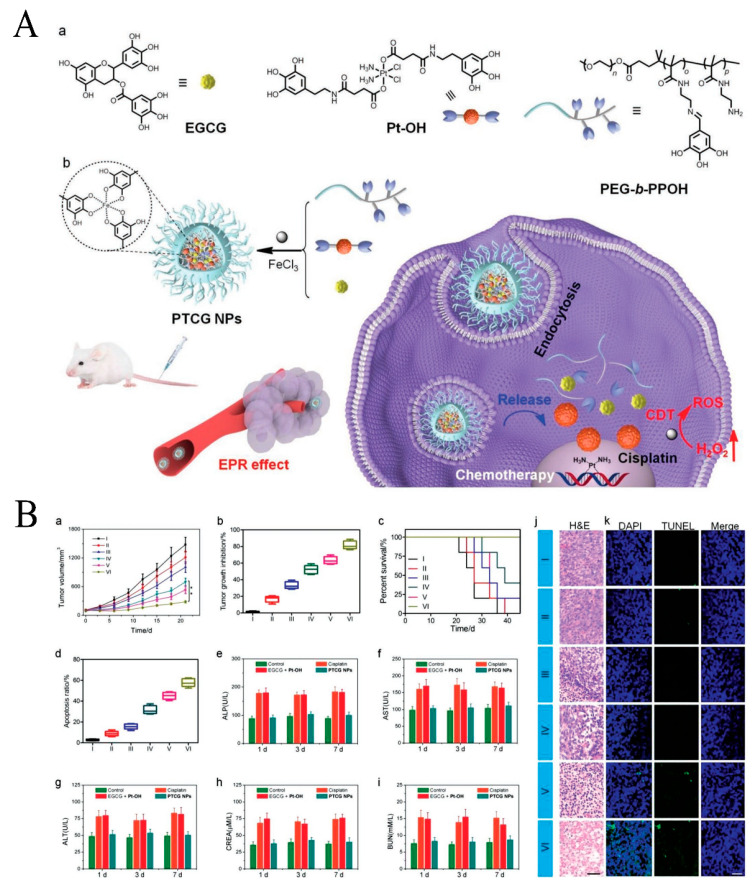
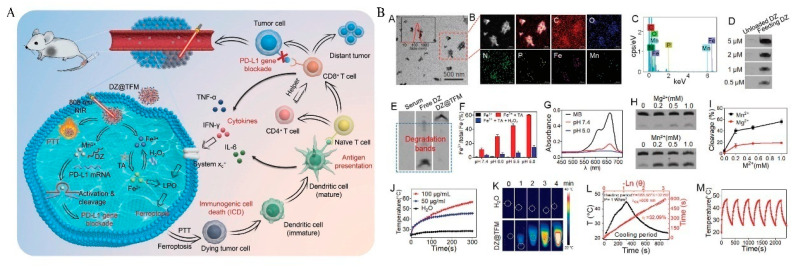
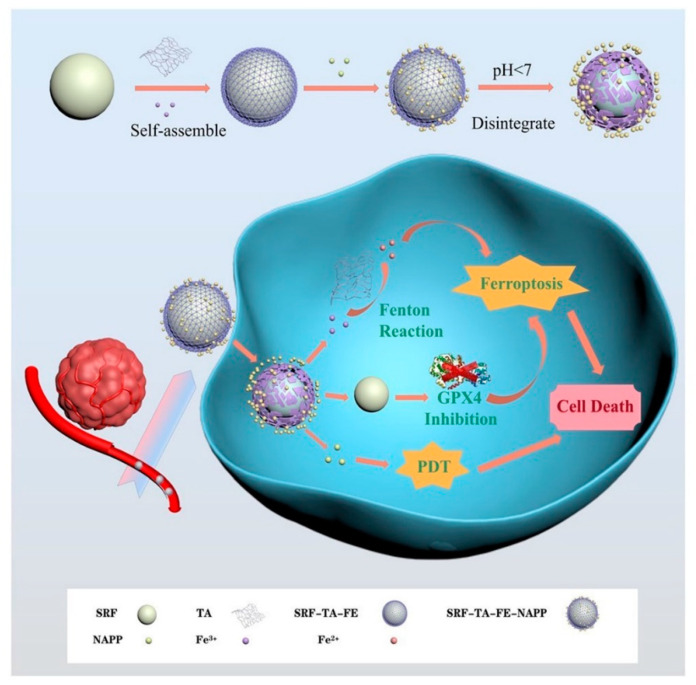
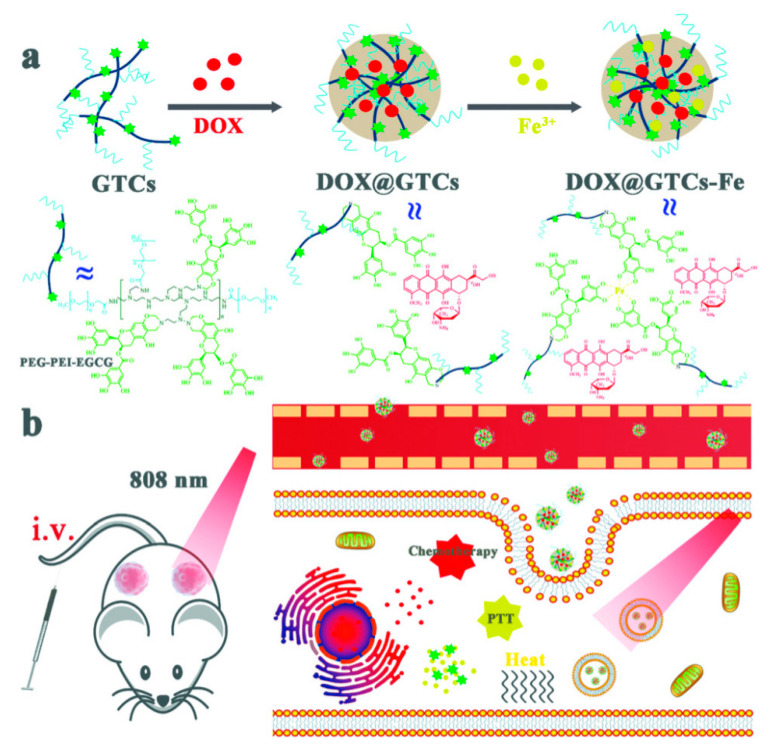
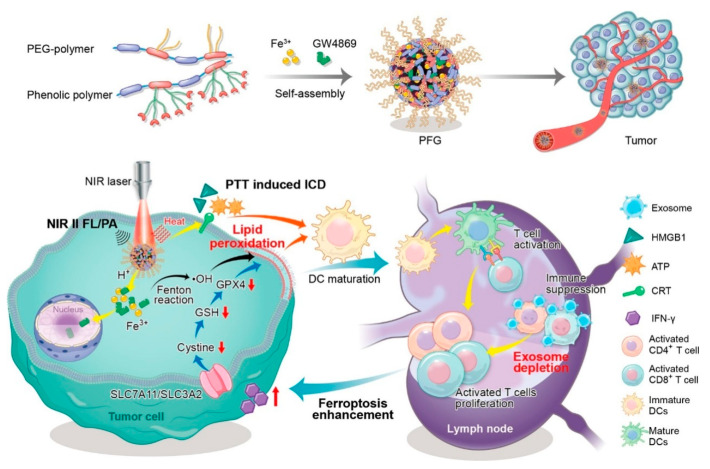
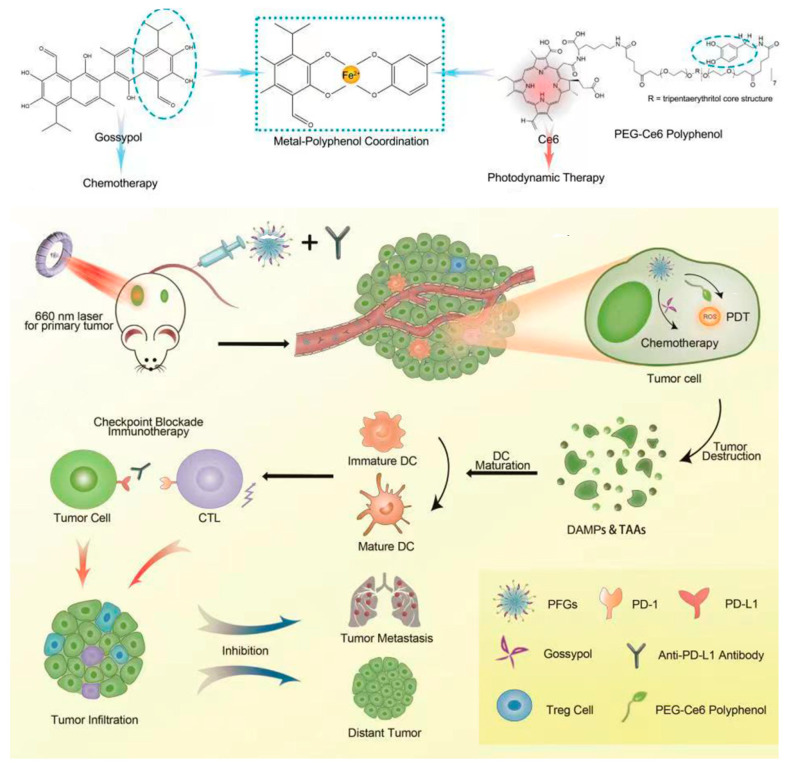
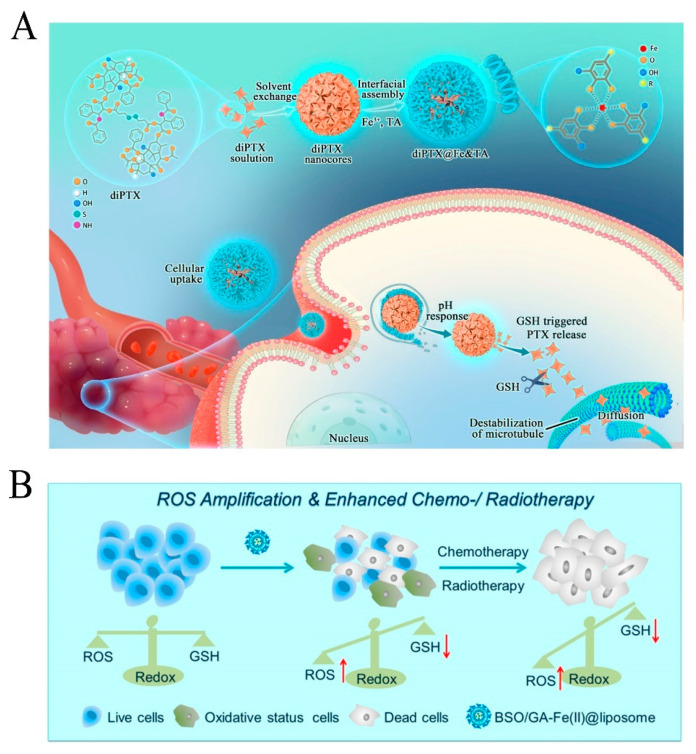
Metal-phenolic networks (MPNs) are a new type of nanomaterial self-assembled by metal ions and polyphenols that have been developed rapidly in recent decades. They have been widely investigated, in the biomedical field, for their environmental friendliness, high quality, good bio-adhesiveness, and bio-compatibility, playing a crucial role in tumor treatment. As the most common subclass of the MPNs family, Fe-based MPNs are most frequently used in chemodynamic therapy (CDT) and phototherapy (PTT), where they are often used as nanocoatings to encapsulate drugs, as well as good Fenton reagents and photosensitizers to improve tumor therapeutic efficiency substantially. In this review, strategies for preparing various types of Fe-based MPNs are first summarized. We highlight the advantages of Fe-based MPNs under the different species of polyphenol ligands for their application in tumor treatments. Finally, some current problems and challenges of Fe-based MPNs, along with a future perspective on biomedical applications, are discussed.

Keywords: CDT; Fe-based MPN; Fenton reaction; PTT; tumor treatment.


Conflict of interest statement

The authors declare no conflict of interest.

Figures

Figure 1
Figure 1
(A) Milestones in developing Fe-based MPNs in tumor treatment [14,33,34,35,36,37,38,39]. Pie charts (B) show the percentage of used polyphenols by Fe-based MPNs, (C) different therapies by Fe-based MPNs in tumor treatments, and (D) the formation of Fe-based MPNs. The above data are according to Table 1 and Table 2.
Scheme 1
Scheme 1
Scheme of polyphenol use and the therapeutic mechanism of Fe-based MPNs with representative materials and applications.
Figure 2
Figure 2
(a) Assembly of MPN capsules from various metals. Assembly of TA and metal ions to form an MPN film on a particulate template, followed by the subsequent formation of an MPN capsule. Reprinted with permission from Ref. [12] (copyright 2014, Wiley). (b) FeIII–TA films were prepared on PS substrates with various shapes (planar, spherical, and ellipsoidal) and sizes (D = 120 nm to 10 mm). (A) Photograph of PS slides before (top) and after (bottom) FeIII-TA coating. (BK) Microscopy images of FeIII-TA capsules: DIC images (B,I,J), AFM images (C), TEM images (EG,K), SEM image (D), and fluorescence microscopy image (H). It is reprinted with permission from Ref. [14] (copyright 2013, Ejima).
Figure 3
Figure 3
(A) Schematic illustration of the synthesis and functions of GA–Fe(II) nanocomplexes. (B) A scheme showing the preparation of BSO/GA–Fe(II)@liposome. (C) A scheme showing 99mTc-labeled nanoparticles. (D) Schematic illustration of the amplified oxidative stress via the effective •OH production and GSH depletion to induce cell death. Reprinted with permission from Ref. [33] (copyright 2019, Dong).
Figure 4
Figure 4
(A) Formulation and characterization of nanoparticles and the proposed mechanism of enhanced anticancer effects. Reprinted with permission from Ref. [34] (copyright 2019, Shan). (B) Schematic illustration for the preparation and structure of FeAP-NPs. Reprinted with permission from Ref. [35] (copyright 2018, Xu).
Figure 5
Figure 5
(A) Illustrates the metal–phenolic assembly of MPNHA-PEG capsules. MPNHA-PEG capsules with three different HA/PEG ratios were prepared by adding HA-polyphenol (HAp, orange) and PEG-polyphenol (PEGp, blue), at three different ratios, to a suspension of CaCO3 particles, followed by adding FeIII, increasing the pH, and dissolving the templates. Reprinted with permission from Ref. [37] (copyright 2016, Ju). (B) Schematic of the PtP NP self-assembly process. Reprinted with permission from Ref. [38] (copyright 2017, Dai). (C) Self-assembly of MPP NPs and the ROS generation process. The positively charged surface of MPO can adsorb negatively charged polyphenol derivatives by electrostatic interactions. The Fe3+ can crosslink all the polyphenol derivatives together to form MPP NPs. Reprinted with permission from Ref. [74] (copyright 2018, Dai).
Figure 6
Figure 6
Schematic illustrations of the fabrication process of PFGs. Reprinted with permission from Ref. [39] (copyright 2021, Zhang).
Figure 7
Figure 7
(A) Schematic showing the construction of DDTF nanocomplexes and their application for apoptosis/ferroptosis-mediated cancer therapy. (a) The dendrimer (Den)−DOX nanocomplex (Den−DOX) is first prepared by mixing DOX with the ethylenediamine core amine-terminated G4 polyamidoamine (PAMAM)dendrimer, and then tannic acid and iron ions are added to the above mixture to form MPNs (TA−Fe3+) on the surface of the Den−DOX nanocomplex, resulting in the formation of Den−DOX−Fe3+−TA (abbreviated as DDTF) nanodrug. (b) The significantly enhanced DOX uptake in the form of DDTF results in cell apoptosis via the induction of ROS generation. Meanwhile, the ferric ions in DDTF can facilitate the Fenton reaction and raise the ROS level. The elevated ROS level may inhibit the GPX-4 activity, block the synthesis of GSH, and finally hinder the clearance of intracellular LPO, which may eventually lead to cell ferroptosis. (B) ROS levels (reflected by the DCF fluorescence) of the A549 cells after various treatments, as observed by confocal microscopy (a) and measured by flow cytometry (b). (c) Endocytosis levels of DOX and DDTF (evaluated via the DOX fluorescence intensities, as measured by flow cytometry) in the A549 cells incubated with DOX or DDTF for various periods. * p < 0.05, ** p < 0.01, *** p < 0.001. (d) Viabilities of the DDTF-treated A549 cells without or with the pretreatment with NH4Cl (30 mM) at different DDTF concentrations (expressed as DOX concentrations). * p < 0.05, ** p < 0.01, *** p < 0.001. For (ad), the cells without drug treatment were used as the control groups. (e) Confocal microscopic images of the DDTF-treated A549 cells, without or with the pretreatment with NH4Cl (30 mM), for 8 h. The lysosomes were stained with LysoTracker Green (abbreviated as LysoTracker). (f) Confocal microscopic images of the DOX or DDTF-treated A549 cells for 4 h. The nuclei were visualized by Hoechst 33342 (abbreviated as Hoechst). (g) Normalized line-scan fluorescence (FL) intensities of the white arrow marked positions in (f). The pink areas indicate the nuclear positions. The DOX content in (ac) and (eg) was 4 μg/mL. (C) Relative viabilities of the AT II (a), A549 (b), MCF-10A (c), MCF-7 (d), and MCF-7/ADR (e) cells subjected to the treatment with various concentrations of TA-Fe3+, DTF, Den-DOX, DOX, or DDTF. ** p < 0.01, *** p < 0.001, ns: nonsignificant difference. Reprinted with permission from Ref. [40] (copyright 2019, Guo).
Figure 8
Figure 8
(a) Schematic illustration of CaO2@ZIF8@MPN as a pH-responsive free radical and ion nanogenerator for enhanced tumor CDT and ion therapy. (A) Preparation of CaO2@ZIF8@MPN and the (B) process of CaO2@ZIF8@MPN responds to lysosomal acid environments, and NIR laser irradiation promotes the release of Ca2+, H2O2, Fe3+, and TA, finally achieving H2O2 self-supply and iron ion self-circulation mediated enhanced CDT. The schematic illustration of CaO2@ZIF8@MPN could be internalized into the MCF-7 cells, generating sufficient H2O2, Fe3+, and Ca2+ via self-acidolysis. More importantly, the generated Ca2+ could be specifically distributed in mitochondria. Schematic illustration of explosive production of •OH, mitochondrial membrane potential, and ATP level decline, thus leading to the apoptosis of MCF-7 cells. (b) Anti-tumor effect in vivo. (A) Fluorescence images of tumor-bearing mice at different times after injection with free IR783 and CaO2@ZIF8@MPN/IR783; (B) the fluorescence images of ex vivo tumors and major organs after injection with free IR783 and CaO2@ZIF8@MPN/IR783 for 48 h; (C,D) the Ca2+ and Fe3+ content in tumors after being treated with different formulations (n = 3); (E,K) relative tumor volume and body weight of tumor-bearing mice after treatment (n = 5); (F) thermal imaging of tumor-bearing mice after injected with CaO2@ZIF8@MPN and then irradiated by NIR laser for different times (808 nm, 2 W/cm2); (G) photos of tumor tissues after treated for 14 d (n = 5); (H,I) H&E staining and TUNEL staining of tumor tissues collected from different groups, scale bar: 200 μm; (J) ROS generation in tumors from mice receiving different treatments, scale bar: 200 μm. * p < 0.05 and *** p < 0.001 determined by Student’s t-test. Reprinted with permission from Ref. [41] (copyright 2021, Liu).
Figure 9
Figure 9
Schematic illustrations of the Au@MPN with the ability to self-supply H2O2 for enhanced chemodynamic therapy. (A) Preparation of Au@MPN and their disassembly process in the presence of ATP or in an acidic environment. (B) The antitumor mechanism of Au@MPN for enhanced chemodynamic therapy. Reprinted with permission from Ref. [42] (copyright 2022, Peng).
Figure 10
Figure 10
(a) Antitumor effect of Au@MPN after intratumoral injection. (A) Schematic illustration of the antitumor process of Au@MPN intratumoral injection. (BD) Individual tumor growth curves from mice treated with PBS, AuNPs, and Au@MPN. (E) Relative tumor volumes from mice after the indicated treatments. (F) Photos of tumors extracted from mice receiving the indicated treatments. (G) The weights of tumor tissues from mice receiving the indicated treatments. (H) Representative H&E staining images of tumor tissues and major organs collected from mice with the indicated treatments. (b) Antitumor effect of Au@MPN after intravenous injection. (A) Schematic illustration of the antitumor process of Au@MPN/PEG intravenous injection. (BD) Individual tumor growth curves from mice treated with PBS, AuNPs, and Au@MPN/PEG. (E) Relative tumor volume from mice receiving the indicated treatments. (F) Photos of tumors extracted from mice receiving the indicated treatments. (G) The weights of tumor tissues from mice receiving the indicated treatments (H) Representative H&E staining images of tumor tissues and major organs collected from mice receiving the indicated treatments. * p < 0.05, ** p < 0.01, and *** p < 0.005. Reprinted with permission from Ref. [42] (copyright 2022, Peng).
Figure 11
Figure 11
(A) Schematic illustration of the preparation of G5.NHAc-Toy@TF nanocomplexes for MR imaging and chemotherapy/CDT of tumors in vivo through ERS amplification. Reprinted with permission from Ref. [43] (copyright 2022, Wang). (B) Schematic diagram showing the fabrication of HGTFT nanoreactors and their applications for starvation therapy, CDT, and chemotherapy. Reprinted with permission from Ref. [44] (copyright 2020, Guo).
Figure 12
Figure 12
(A) (a) Time-dependent fluorescence pictures of the 4T1 tumor-bearing mice that were i.v. injected with HGTFT-Cy7 and (b) corresponding fluorescence levels of HGTFT-Cy7 in the tumor areas. “Pre” indicates the mouse before drug treatment. The tumor regions of the mice in (a) were marked using green dotted circles. * p < 0.05, ** p < 0.01, and *** p < 0.001, versus control, ns: nonsignificant difference. (c) Ex vivo fluorescence pictures of the major organs and tumor regions of the HGTFT-Cy7-injected mice sacrificed at various time points and (d) corresponding fluorescence levels. ** p < 0.01 and *** p < 0.001. The pictures in (a,c) and the intensities in (b,d) are based on the fluorescence of Cy7. The abbreviations H, Li, S, Lu, K, and T in (c,d) represent the heart, liver, spleen, lung, kidneys, and tumor, respectively. (e) Routine blood analysis data of the mice sacrificed on the 14th day after the intravenous injection of PBS (control), HAS-GOx, TPZ, or HGTFT. ** p < 0.01 and *** p < 0.001, versus control, ns: nonsignificant difference. The blood indexes WBC, RBC, PLT, HGB, MCV, and MCH represent numbers of white blood cells, red blood cells, platelets, hemoglobin concentration, mean corpuscular volume, and mean corpuscular hemoglobin, respectively. (B) (a) Representative optical microscopic pictures of the H&E-stained tumor slices from the 4T1 tumor-bearing nude mice, taken at day 14, after being treated with different formulations. (b) Tumor growth profiles of the mice in the different groups. * p < 0.05, ** p < 0.01, and *** p < 0.001. (c) Tumor growth inhibition rates of different formulations. * p < 0.05, ** p < 0.01, and *** p < 0.001. (d) Representative immunofluorescence staining results of HIF-1α, caspase-3, and Bcl-2, as well as representative TUNEL assay results of tumor tissue slices from the 4T1 tumor-bearing nude mice, sacrificed at day 14, after being treated with different formulations. (e) Apoptosis/necrosis rates determined by the TUNEL assay. *** p < 0.001, ns: nonsignificant difference. (f) Body weight changes of the mice subjected to the treatments of different formulations. “ns” represents a nonsignificant difference. Reprinted with permission from Ref. [44] (copyright 2020, Guo).
Figure 13
Figure 13
(a) Schematic illustrations for (A) the preparation of CADNs and (B) their application in cancer combination therapy. (b) (A) In vivo fluorescence imaging of 4 T1 tumor-bearing mice at different times (2, 4, 8, and 24 h) after being intravenously injected with GOx-Cy5 or GOx-Cy5 loaded CADNs. Main organs and tumors were collected after 24 h. White dot circles represented tumor sites. (B) Transverse relaxation values (1/T2) of CADNs varied with various Fe concentrations. (C) T2-weighted MRI images of CADNs with various Fe concentrations measured at 3.0 T. (D) In vivo T2-weighted MRI images of four T1 tumor-bearing mice before and after being injected with PBS or CADNs. Red dot circles indicated tumors. (c) Evaluation of in vivo antitumor activities of PBS, DOX, MGPFNs, and CADNs in MCF-7 cells bearing nude BALB/c mice. (A) Records of tumor volumes at different set time points in the treatment process. ** p < 0.01 and *** p < 0.001. (B) Weights and (C) photographs of excised tumors at the end of treatment. *** p < 0.001. (D) Body weight changes of nude mice in various groups during the therapeutic process. Reprinted with permission from Ref. [55] (copyright 2022, Chen).
Figure 14
Figure 14
(A) (a) The chemical structures and cartoon illustration of the building blocks (EGCG, Pt-OH, PEG-b-PPOH) used for the preparation of PTCG NPs. (b) High tumor accumulation of PTCG NPs through the EPR effect followed by cellular internalization. The nanomedicine opens a floodgate, specifically in cancer cells, to release drugs (EGCG and cisplatin) and ROS to realize chemo/chemodynamic therapy. (B) (a) Tumor growth–inhibition curves and (b) tumor growth–inhibition rate of the mice bearing HepG2 tumors after different treatments (n = 5), ** p < 0.01. (c) Survival rate of the mice after different treatments. (d) Apoptosis ratio of the tumor cells for the mice after different treatments. (ei) Blood biochemistry tests of ALP (e), AST (f), ALT (g), CREA (h), and BUN (i) from the mice treated with different formulations. Untreated healthy mice were used as the control. (j) H&E and (k) TUNEL staining of the tumor tissues from the mice treated with different formulations. The scale bar = 100 µm. I, Control; II, EGCG NPs; III, EGCG + Pt-OH; IV, cisplatin; V, Pt-OH NPs; VI, PTCG NPs. Data are expressed as means ± s.d. Reprinted with permission from Ref. [54] (copyright 2019, Ren).
Figure 15
Figure 15
(A) Schematic illustration of DZ@TFM for PTT-enhanced cyclically amplified tumor ferroptosis-immunotherapy. (B) Preparation and characterizations of DZ@TFM. (A) TEM image and dynamic light scattering (inset), (B) elemental mapping images, and (C) energy disperse X-ray spectroscopy (EDS) analysis of DZ@TFM. PAGE images for (D) DZ loading capacity characterization and (E) protection effect against serum. (F) Measurement of Fe2+ content with different treatments (n = 3). (G) The degradation of MB under pH 5.0 or 7.4 conditions in the presence of H2O2. (H) PAGE images showing DZ activity for substrate cleavage and (I) the cleavage quantification (n = 3). (J) Photothermal curves of DZ@TFM with 808 nm laser irradiation at different concentrations. (K) Photothermal images of DZ@TFM solutions with laser exposure. (L) Calculation of the photothermal conversion efficiency at 808 nm. (M) Continuous irradiation–cooling cycle profiles of DZ@TFM. Reprinted with permission from Ref. [46] (copyright 2019, Liu).
Figure 16
Figure 16
Preparation and mechanism diagram of SRF@FeIIITA–NAPP. Due to the low pH environment inside tumor cells, FeIIITA cleavage releases SRF to induce ferroptosis, NAPP is activated under a specific wavelength (660 nm) for PDT, Fe3+ is under the action of TA, and the oxidation–reduction into Fe2+ is used for the occurrence of the Fenton reaction, which catalyzes the high concentration of ROS in tumor cells to enhance ferroptosis and the efficacy of PDT. Reprinted with permission from Ref. [47] (copyright 2022, Zhou).
Figure 17
Figure 17
Schematic illustrations of (a) covalently-assembled GTCs from EGCG and PEI–PEG to load DOX for DOX@GTCs nanoparticles and, further, for DOX@GTCs–Fe by chelating with ferric ions and (b) intravenous injection of both nanoparticles for effective chemo-photothermal cancer treatment under near-infrared irradiation. Reprinted with permission from Ref. [51] (copyright 2019, Yu).
Figure 18
Figure 18
Schematic illustrations of PFG MPNs for phototheranostic effect, relief of exosomal immunosuppression, ferroptosis enhancement, and immune stimulation. A self-assembly process for the preparation of PFG MPNs was first presented. After intravenous injection, PFG MPNs could generate heat under laser irradiation, achieving PTT-augmented ICD by using a precise NIR II FL/PA imaging track. Meanwhile, released GW4869 from PFG MPNs strongly induced exosome depletion, resulting in antitumor immune activation against tumor cells. Additionally, the reactivated T cell proliferated and secreted high levels of IFN-γ to downregulate ferroptosis-relevant molecules (including SLC7A11, SLC3A2, cystine, GSH, and GPX4), enhancing the ferroptosis induced by rich Fe3+ released from PFG MPNs. Reprinted with permission from Ref. [56] (copyright 2022, Xie).
Figure 19
Figure 19
Schematic illustrations of the fabrication process of PFGs. PFGs combined with a PD-L1 checkpoint blockade for immune response enhancement and inhibiting tumor proliferation and metastasis. DAMPs: damage-associated molecular patterns. TAAs: tumor-associated antigens. Reprinted with permission from Ref. [39] (copyright 2021, Zhang).
Figure 20
Figure 20
(A) The procedure for fabricating diPTX@Fe&TA nanoparticles, as well as intracellular pH and redox-triggered programmed drug release. Reprinted with permission from Ref. [48] (copyright 2022, Yi). (B) ROS-mediated chemo-/radiotherapy sensitization. Schematic illustration of the efficient disruption of redox homeostasis in the tumor by BSO/GA–Fe(II)@liposome for enhanced chemo/radiotherapy. Reprinted with permission from Ref. [33] (copyright 2019, Dong).

Similar articles

Cited by

References

    1. Bray F., Ferlay J., Soerjomataram I., Siegel R.L., Torre L.A., Jemal A. Global cancer statistics 2018: GLOBOCAN estimates of incidence and mortality worldwide for 36 cancers in 185 countries. CA Cancer. J. Clin. 2018;68:394–424. doi: 10.3322/caac.21492. - DOI - PubMed
    1. Ferlay J., Colombet M., Soerjomataram I., Parkin D.M., Pineros M., Znaor A., Bray F. Cancer statistics for the year 2020: An overview. Int. J. Cancer. 2021;149:778–789. doi: 10.1002/ijc.33588. - DOI - PubMed
    1. Li M.M., Yin S.H., Lin M.Z., Chen X.L., Pan Y., Peng Y.Q., Sun J.B., Kumar A., Liu J.Q. Current status and prospects of metal-organic frameworks for bone therapy and bone repair. J. Mater. Chem. B. 2022;10:5105–5128. doi: 10.1039/D2TB00742H. - DOI - PubMed
    1. Liu W.C., Yan Q.W., Xia C., Wang X.X., Kumar A., Wang Y., Liu Y.W., Pan Y. Recent advances in cell membrane coated metal–organic frameworks (MOFs) for tumor therapy. J. Mater. Chem. B. 2021;9:4459–4474. doi: 10.1039/D1TB00453K. - DOI - PubMed
    1. Yang K., Zhao S.J., Li B.L., Wang B.H., Lan M.H., Song X.Z. Low temperature photothermal therapy: Advances and perspectives. Coordin. Chem. Rev. 2022;454:214330. doi: 10.1016/j.ccr.2021.214330. - DOI