. 2023 Apr 26;15(5):1060.
doi: 10.3390/v15051060.

Recombinant Virus Quantification Using Single-Cell Droplet Digital PCR: A Method for Infectious Titer Quantification

Affiliations

Recombinant Virus Quantification Using Single-Cell Droplet Digital PCR: A Method for Infectious Titer Quantification

Ksenija Korotkaja et al. Viruses. .

Abstract

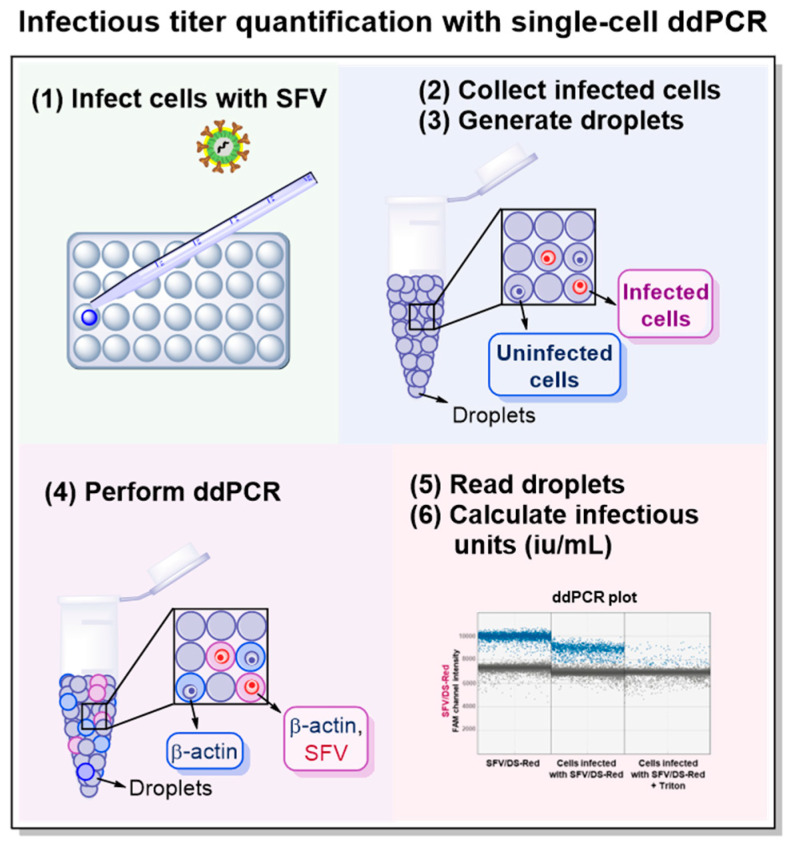
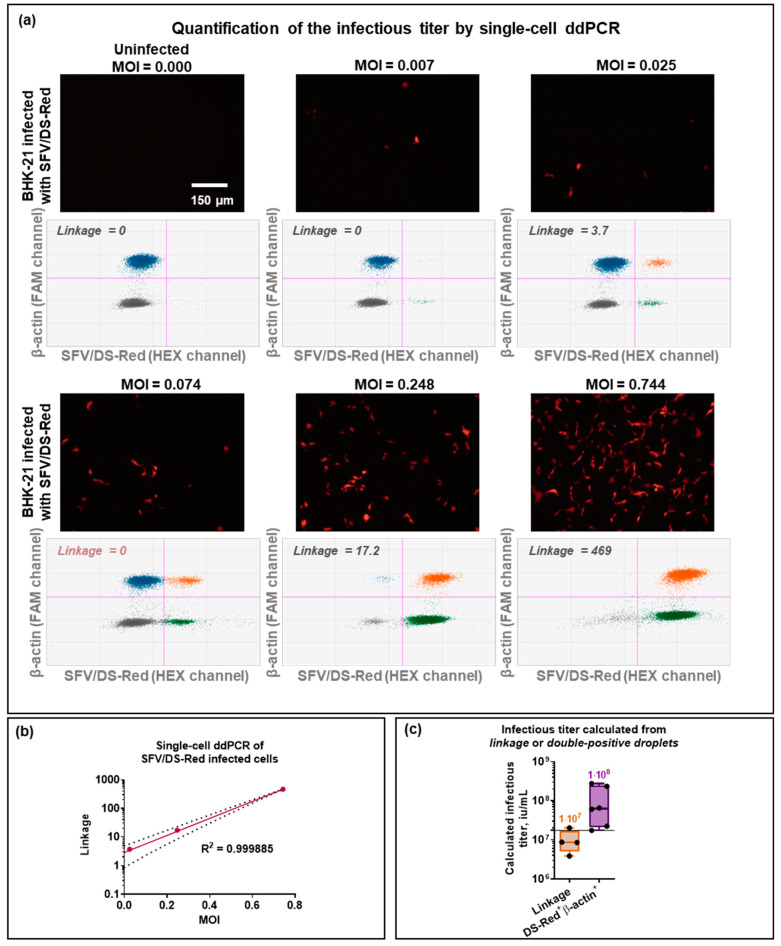
The quantification of viruses is necessary for both research and clinical applications. The methods available for RNA virus quantification possess several drawbacks, including sensitivity to inhibitors and the necessity of a standard curve generation. The main purpose of this study was to develop and validate a method for the quantification of recombinant, replication-deficient Semliki Forest virus (SFV) vectors using droplet digital PCR (ddPCR). This technique demonstrated stability and reproducibility using various sets of primers that targeted inserted transgenes, as well as the nsP1 and nsP4 genes of the SFV genome. Furthermore, the genome titers in the mixture of two types of replication-deficient recombinant virus particles were successfully measured after optimizing the annealing/extension temperature and virus:virus ratios. To measure the infectious units, we developed a single-cell ddPCR, adding the whole infected cells to the droplet PCR mixture. Cell distribution in the droplets was investigated, and β-actin primers were used to normalize the quantification. As a result, the number of infected cells and the virus infectious units were quantified. Potentially, the proposed single-cell ddPCR approach could be used to quantify infected cells for clinical applications.

Keywords: Semliki Forest virus; alphaviruses; ddPCR; infectious titer; replication-deficient virus particles; single-cell ddPCR.


Conflict of interest statement

The authors declare no conflict of interest.

Figures

Figure 1
Figure 1
The scheme illustrating the process of preparing Semliki Forest virus (SFV) replication-deficient virus particles. (1) The packaging of recombinant RNAs (rSFV1-DsRed or rSFV1-CFP) into virus particles was achieved by co-electroporation with SFV-Helper1 RNA encoding virus structural genes. The helper RNA was not packaged into the particles, ensuring the production of replication-deficient SFV. (2) The cell cultivation medium containing replication-deficient virus particles was harvested, centrifuged, and filtered. (3) Virus particles were purified/concentrated by ultracentrifugation through double sucrose cushions. (4) Cells were infected with SFV particles. (5) About 24 h after infection, cells expressing the fluorescent protein gene (DS-Red or CFP) were counted using fluorescent microscopy, and the infectious titer was calculated as infectious units per mL (iu/mL).
Figure 2
Figure 2
Correlation between virus particle genome equivalents (genome titer, vp/mL) and infectious titer (iu/mL). The recombinant SFV particles (SFV/DS-Red and SFV/CFP) with respective infectious titers were used for the quantification of genome equivalents using ddPCR. The titer of the genome that allowed for the clearest separation between positive and negative droplets was chosen as the optimal titer to quantify SFV particles using ddPCR. (a) Quantification of SFV/DS-Red using DS-Red_7816-FAM primer set; (b) Quantification of SFV/CFP using CFP_8011-HEX primer set. Each column represents an individual well of ∼20,000 droplets with a respective set of primers/probes. NTC—non-template control; blue—droplets positive in FAM channel; green—droplets positive in HEX channel; purple—optimal titer; grey—negative droplets. (c) Correlation between the infectious titer and the genome titer.
Figure 3
Figure 3
ddPCR quantification of the SFV/DS-Red virus particles with different primer sets. Primer and probe set targeting the DS-Red transgene (DS-Red_7603-FAM, DS-Red_7603-HEX, DS-Red_7816-FAM) and SFV genome (SFV_6004-FAM, SFV_1204-FAM, SFV_1204-HEX) were used for quantification. FAM and HEX indicate the fluorophore used in the probe design. Data are expressed as the mean of at least three experiments ± the standard error of the mean (SEM).
Figure 4
Figure 4
Temperature optimization of premixed SFV/DS-Red and SFV/CFP virus particles SFV/DSRedSFV/CFP=110 amplified with DS-Red_7816-FAM and CFP_8011-HEX primer/probe set combinations. (a,b) A thermal gradient for duplex SFV/DS-Red and SFV/CFP quantification: (a) DS-Red FAM channel, (b) CFP HEX channel. (c) Two-dimensional (2D) droplet distribution at optimal annealing/extension temperature (Ta = 61.4 °C). Blue—droplets positive in the FAM channel; green—droplets positive in the HEX channel; orange—droplets positive in both FAM and HEX channels; grey—droplets negative in both FAM and HEX channels.
Figure 5
Figure 5
Quantification of premixed SFV/DS-Red and SFV/CFP virus particles with DS-Red_7816-FAM and CFP_8011-HEX primer/probe set combination. The concentration of one alphavirus remained constant while the concentration of the other increased. (a) A linear regression between ddPCR determined genome titer (vp/mL) and the number of infectious virus particles added to the reaction mixture (iu/mL). (On the left) SFV/CFP is constant, SFV/DS-Red varies (R2 = 0.9997); (on the right) SFV/DS-Red is constant, SFV/CFP varies (R2 = 0.9997). The dashed line represents a 95% confidence interval. (b) Boxplot graph of virus particle genome titer per mL quantified by ddPCR in the mix of two types of virus particles.
Figure 6
Figure 6
Quantification of premixed SFV/DS-Red and SFV/CFP virus particles with a DS-Red_7816-FAM and CFP_8011-HEX primer set combination. Two types of recombinant virus particles were premixed in two SFV/DS-Red:SFV/CFP ratios: 1-to-70 and 1-to-7. (a,b) The linear regression between the infectious titer and the ddPCR calculated genome titer: (a) SFV/DSRedSFV/CFP= 170; (b) SFV/DSRedSFV/CFP = 17. The dashed line represents a 95% confidence interval. (c) Boxplot graph of virus particle genome titers quantified in the mix with an SFV/DS-Red:SFV/CFP ratio of 1:70 and 1:7.
Figure 7
Figure 7
Scheme illustrating the steps involved in the quantification of the infectious virus particle titer with single-cell ddPCR. (1) Cell infection with replication-deficient recombinant Semliki Forest virus (SFV). (2) Infected cell collection by trypsinization 24 h after infection. After collection, cells should be filtered, washed, and counted. (3) Cell encapsulation into droplets with QX200™ Droplet Generator. (4) Reverse Transcriptase ddPCR with two primer/probe sets: first targeting the cell housekeeping gene (β-actin) and second targeting viral genome (SFV). (5) Droplet primary analysis with QX200™ Droplet Reader and further analysis using droplet distribution ddPCR plots. (6) Calculation of infectious titer.
Figure 8
Figure 8
Single-cell ddPCR. (a,b) Uninfected BHK-21 cells were collected, stained with WGA Alexa Fluor 488 (green), counted, and then 20,000 cells were encapsulated into droplets with Droplet Generator: (a) Bright-field and fluorescent microscopy of droplets with uninfected BHK-21 cells stained with WGA Alexa Fluor 488; (b) Proportion of droplets containing 0, 1, 2, and 3 encapsulated cells. (c) Histogram of 1000 and 2000 uninfected BHK-21 cells quantified using (i) only β-actin-FAM primers or (ii) β-actin-FAM primers in combination with DS-Red_7603-HEX primers. Arrows indicate shifts in fluorescence intensity.
Figure 9
Figure 9
Quantification of SFV/DS-Red infectious titer with single-cell ddPCR. BHK-21 were infected with SFV/DS-Red virus particles, encoding the red fluorescent protein gene. After 24 h, infected cells were photographed, collected, counted, and 2000 cells were added to the ddPCR reaction to quantify β-actin and DS-Red genes with a β-actin-FAM and DS-Red_7603-HEX primer set combination. (a) Fluorescent microscopy and 2D droplet distribution of BHK-21 cells infected with SFV/DS-Red at several MOI. Blue—droplets positive in the FAM channel; green—droplets positive in the HEX channel; orange—droplets positive in both FAM and HEX channels; grey—droplets negative in both FAM and HEX channels. (b) Correlation between MOI and Linkage between β-actin-positive and DS-Red-positive droplet populations calculated in QuantaSoft Analysis Pro. The dashed line represents a 95% confidence interval. (c) Calculated infectious titer of SFV/DS-Red using Linkage and double-positive droplet number. The line represents the reference infectious titer (1.73 × 10⁷ iu/mL) determined by direct fluorescent microscopy. MOI—a multiplicity of infections.

Similar articles

Cited by

References

    1. Heider S., Metzner C. Quantitative Real-Time Single Particle Analysis of Virions. Virology. 2014;462:199. doi: 10.1016/j.virol.2014.06.005. - DOI - PMC - PubMed
    1. Sidstedt M., Rådström P., Hedman J. PCR Inhibition in QPCR, DPCR and MPS—Mechanisms and Solutions. Anal. Bioanal. Chem. 2020;412:2009–2023. doi: 10.1007/s00216-020-02490-2. - DOI - PMC - PubMed
    1. Baer A., Kehn-Hall K. Viral Concentration Determination through Plaque Assays: Using Traditional and Novel Overlay Systems. J. Vis. Exp. 2014;93:e52065. - PMC - PubMed
    1. Lei C., Yang J., Hu J., Sun X. On the Calculation of TCID50 for Quantitation of Virus Infectivity. Virol. Sin. 2021;36:141–144. doi: 10.1007/s12250-020-00230-5. - DOI - PMC - PubMed
    1. Hindson B.J., Ness K.D., Masquelier D.A., Belgrader P., Heredia N.J., Makarewicz A.J., Bright I.J., Lucero M.Y., Hiddessen A.L., Legler T.C., et al. High-Throughput Droplet Digital PCR System for Absolute Quantitation of DNA Copy Number. Anal. Chem. 2011;83:8604. doi: 10.1021/ac202028g. - DOI - PMC - PubMed

Publication types