. 2023 Apr 28;15(5):1077.
doi: 10.3390/v15051077.

A Recombinant Chimeric Cedar Virus-Based Surrogate Neutralization Assay Platform for Pathogenic Henipaviruses

Affiliations

A Recombinant Chimeric Cedar Virus-Based Surrogate Neutralization Assay Platform for Pathogenic Henipaviruses

Moushimi Amaya et al. Viruses. .

Abstract

The henipaviruses, Nipah virus (NiV), and Hendra virus (HeV) can cause fatal diseases in humans and animals, whereas Cedar virus is a nonpathogenic henipavirus. Here, using a recombinant Cedar virus (rCedV) reverse genetics platform, the fusion (F) and attachment (G) glycoprotein genes of rCedV were replaced with those of NiV-Bangladesh (NiV-B) or HeV, generating replication-competent chimeric viruses (rCedV-NiV-B and rCedV-HeV), both with and without green fluorescent protein (GFP) or luciferase protein genes. The rCedV chimeras induced a Type I interferon response and utilized only ephrin-B2 and ephrin-B3 as entry receptors compared to rCedV. The neutralizing potencies of well-characterized cross-reactive NiV/HeV F and G specific monoclonal antibodies against rCedV-NiV-B-GFP and rCedV-HeV-GFP highly correlated with measurements obtained using authentic NiV-B and HeV when tested in parallel by plaque reduction neutralization tests (PRNT). A rapid, high-throughput, and quantitative fluorescence reduction neutralization test (FRNT) using the GFP-encoding chimeras was established, and monoclonal antibody neutralization data derived by FRNT highly correlated with data derived by PRNT. The FRNT assay could also measure serum neutralization titers from henipavirus G glycoprotein immunized animals. These rCedV chimeras are an authentic henipavirus-based surrogate neutralization assay that is rapid, cost-effective, and can be utilized outside high containment.

Keywords: Cedar virus; Hendra virus; Nipah virus; antibody; chimera; henipavirus; reverse genetics; serum; vaccine; virus neutralization; virus-host cell interaction.


Conflict of interest statement

C.C.B is a United States federal employee and co-inventor on United States and foreign patents pertaining to soluble forms of Nipah virus and Hendra virus G glycoproteins, and Cedar Virus and Methods of Use, whose assignees are the United States as represented by the Henry M. Jackson Foundation for the Advancement of Military Medicine, Inc. (Bethesda, MD, USA). All other authors declare no conflict of interest.

Figures

Figure 1
Figure 1
Schematic representation of the optimized rCedV plasmid and the genomes of the generated rCedV chimeric viruses. (A) The pOLTV5opt-rCedV plasmid illustrates the location and sequences of the T7 optimal promoter (T7opt) and the Hammerhead Ribozyme A (HHRbzA). The long arrows indicate regions of self-cleavage. Unique restriction sites MluI and SphI used to construct the rCedV chimeric plasmids are shown. (B) The genomes and the lengths of the generated chimeras are schematically diagrammed as rCedV-NiV-B, rCedV-NiV-B-GFP, rCedV-NiV-B-Luc, rCedV-HeV, rCedV-HeV-GFP, and rCedV-HeV-Luc. pOLTV5opt-rCedV, optimized pOLTV5-rCedV plasmid; T7min, T7 minimal promoter; T7opt, T7 optimal promoter; HHRbzA, Hammerhead Ribozyme A; 3′Le, 3′ Leader; 5′Tr, 5′ Trailer; HDVRbz, hepatitis delta virus ribozyme; T7t, T7 terminator.
Figure 2
Figure 2
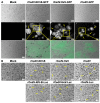
Syncytia induced by rCedV expressing NiV-B or HeV envelope glycoproteins. Vero E6 cells were uninfected (Mock) or infected with either rCedV-NiV-B, rCedV-NiV-B-GFP, rCedV-NiV-B-Luc, rCedV-HeV, rCedV-HeV-GFP, rCedV-HeV-Luc, rCedV, rCedV-GFP or rCedV-Luc at a MOI of 0.01. All images were taken 24 h post-infection. (A) Cells infected with GFP-expressing viruses. Transmitted light (top row), fluorescence (middle row), and merged (bottom row) images are shown. The respective zoomed-in fluorescence images (3rd row) are regions from the yellow boxes. (B) Cells infected with non-reporter or Luc expressing rCedV chimeras were fixed, stained, and then imaged for syncytia. The images taken with transmitted light are shown. Images were captured with a Zeiss Axio Observer A1 inverted microscope using a 5× objective. Arrows indicate giant multinucleated cells (syncytia). Representative images from three independent experiments are shown. Scale bar, 50 µm.
Figure 3
Figure 3
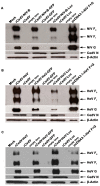
Expression of NiV-B and HeV envelope glycoproteins in infected cells. Vero E6 cells were uninfected (Mock) or infected at a MOI of 0.01 with either rCedV-NiV-B, rCedV-NiV-B-GFP, rCedV-NiV-B-Luc (A), rCedV-HeV, rCedV-HeV-GFP, rCedV-HeV-Luc (B,C), rCedV, rCedV-GFP or rCedV-Luc. As a reference, cells were co-transfected with a total of 2 µg of pcDNA3.1-NiV-F and pcDNA3.1-NiV-G (pcDNA3.1-NiV F + G), or pcDNA3.1-HeV-F and pcDNA3.1-HeV-G (pcDNA3.1-HeV F + G). Cells were harvested at 24 h post-infection (A,B) (rCedV-NiV-B and rCedV-HeV chimeras) or 48 h post-infection (C) (rCedV-HeV chimeras only), lysates were prepared and total protein (~30 µg) resolved by SDS-PAGE followed by western blot assay. The subsequent membrane was probed with HeV and NiV cross-reactive monoclonal antibodies (mAbs) against F glycoprotein (mAb 5G7) and G glycoprotein (mAb 48D3), polyclonal rabbit serum to CedV-N and β-actin. Representative images from two independent experiments are shown.
Figure 4
Figure 4
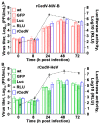
Replication kinetics of rCedV chimeras. Infectious virus titers (PFU/mL) determined from supernatants harvested at the indicated time points from Vero E6 cells infected at a MOI of 0.01 with rCedV-NiV-B (clear red bar), rCedV-NiV-B-GFP (dotted red bar), rCedV-NiV-B-Luc (striped red bar) (A), rCedV-HeV (clear green bar), rCedV-HeV-GFP (dotted green bar) or rCedV-HeV-Luc (striped green bar) (B). As a reference, separate populations of Vero E6 cells were also infected with rCedV (blue bar) (A,B). Normalized relative light units (RLU) for CedV-NiV-B-Luc (A) and rCedV-HeV-Luc (B) infected cells are represented on the right y-axes as black dashed lines. These data represent mean ± standard deviation from three independent experiments. Virus titers and luciferase activity levels at 0 h post-infection indicate the lower limit of detection for the plaque assay and the luminometer, respectively. Statistical analysis was performed in GraphPad Prism 9 by two-way ANOVA followed by Tukey’s post hoc test (α = 0.05).
Figure 5
Figure 5
Ephrin-B2 and ephrin-B3 receptors facilitate rCedV-NiV-B-GFP and rCedV-HeV-GFP infection. Confluent HeLa-USU-ephrin-B2 (A), HeLa-USU-ephrin-B3 (B), and HeLa-USU (C) cells were uninfected (Mock) or infected with rCedV-NiV-B-GFP, rCedV-HeV-GFP, or rCedV-GFP at a MOI of 0.5. Infected cells were imaged for fluorescence and syncytia at 24 h post-infection. In each panel, transmitted light (1st column), fluorescence (2nd column), and merged (3rd column) images are shown. Zoomed-in regions are from the yellow boxes. Images were captured with a Zeiss Axio Observer A1 inverted microscope using a 5× objective. Representative images from two independent experiments are shown. Scale bar, 50 µm.
Figure 6
Figure 6
rCedV chimeras induce an IFN-β response. HeLa-CCL-2 cells were uninfected (Mock) or infected with rCedV-NiV-B, rCedV-HeV, or rCedV at a MOI of either 0.5 or 1.0 or transfected with Poly I:C (10 μg/mL) for 24 h. IFN-α and IFN-β mRNA expression were determined by qPCR. Fold changes were calculated relative to 18S ribosomal RNA and normalized to mock samples using the 2(−ΔΔCt) method. These data represent mean ± standard deviation from two independent experiments, each performed in triplicate. Statistical analysis was performed with all samples in GraphPad Prism 9 by performing t-tests of each virus against Mock (asterisk *) or each virus against Poly I:C (hash #). **** p < 0.0001, # p = 0.011, ## p = 0.012, ### p = 0.0001 and #### p < 0.0001.
Figure 7
Figure 7
Neutralization of rCedV-NiV-B-GFP and rCedV-HeV-GFP by plaque reduction neutralization test (PRNT). Nine-point dose-response neutralization profiles for mAbs m102.4, h5B3.1, 12B2, and 1F5 against rCedV-NiV-B-GFP and rCedV-HeV-GFP at BSL-2 (A), at BSL-4 (B,C) and authentic NiV-B and HeV at BSL-4 (B,C). The diluted mAbs were incubated with an equal volume of either rCedV-NiV-B-GFP, rCedV-HeV-GFP, NiV-B, or HeV at an MOI of 0.0001 for 1 h at 37 °C, 5% CO2. MOI was calculated for a tentative 106 cells/well and 0.4 mL virus and antibody mixture per well. Neutralization percent (%) was calculated based on PFU for each virus without mAb. These data represent mean ± standard deviation and are plotted as a non-linear regression curve fit with variable slope. BSL-2 studies are representative of two independent experiments, each performed in duplicate, and BSL-4 studies are from a single experiment performed in duplicate. The limit of detection for this assay was 50 PFU. Red circles and lines represent rCedV-NiV-B-GFP, red triangles and dashed lines represent NiV-B, green squares and lines represent rCedV-HeV-GFP, and green triangles and dashed lines represent HeV. The thick black line divides the BSL-2 PRNT from the BSL-4 PRNT.
Figure 8
Figure 8
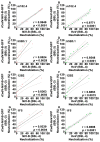
Correlation analysis of plaque reduction neutralization test (PRNT) neutralization values. Pearson correlation analysis of PRNT neutralization (%) values of rCedV-NiV-B-GFP versus NiV-B (A,C,E,G) and rCedV-HeV-GFP versus HeV (B,D,F,H) with mAbs m102.4, h5B3.1, 12B2 or 1F5. The Pearson correlation coefficient ‘r,’ p-value (two-tailed), linear regression line (solid lines), and 95% confidence intervals (dashed lines) are represented. Pearson’s r ≥ 0.8 and p-value < 0.05 indicate a strong significant positive correlation.
Figure 9
Figure 9
Neutralization profiles of NiV and HeV cross-reactive monoclonal antibodies by fluorescence reduction neutralization test (FRNT). Seven-point dose-response neutralization profiles for mAbs m102.4, h5B3.1, 12B2, and 1F5 against rCedV-NiV-B-GFP and rCedV-HeV-GFP. Neutralization percent (%) was calculated based on fluorescent foci for each virus without mAb. These data represent mean ± standard deviation from three independent experiments, each performed in triplicate. Data are plotted as non-linear regression curve fit with variable slope. The limit of detection for this assay was 50 fluorescent foci. Red circles and lines represent rCedV-NiV-B-GFP, and green squares and lines represent rCedV-HeV-GFP.
Figure 10
Figure 10
Correlation analysis of neutralization assays using the GFP expressing rCedV chimeric viruses. Pearson correlation analysis of neutralization (%) values from plaque reduction neutralization tests (PRNTs) (y-axes) and fluorescence reduction neutralization tests (FRNTs) (x-axes) performed with rCedV-NiV-B-GFP (A,C,E,G) and with rCedV-HeV-GFP (B,D,F,H) with mAbs m102.4, h5B3.1, 12B2 or 1F5. The Pearson correlation coefficient ‘r,’ p-value (two-tailed), linear regression line (solid lines), and 95% confidence intervals (dashed lines) are represented. Pearson’s r ≥ 0.8 and p-value < 0.05 indicate a strong significant positive correlation.
Figure 11
Figure 11
Neutralization profiles of NHP immunized sera against the GFP expressing rCedV chimeras by fluorescence reduction neutralization test (FRNT). Seven-point dose-response neutralization profiles of rhesus macaque sera collected on day 42 (A) and day 84 (B) post-immunization against rCedV-NiV-B-GFP and rCedV-HeV-GFP are shown. Neutralization percent (%) was calculated based on fluorescent foci for each virus without serum. These data represent mean ± standard deviation from two independent experiments, each performed in triplicate. Data are plotted as non-linear regression curve fit with variable slope. The limit of detection for this assay was 50 fluorescent foci. Animal ID numbers are 171269, 180274, 180606, and 180227. Red circles and lines represent rCedV-NiV-B-GFP, and green squares and lines represent rCedV-HeV-GFP.
Figure 12
Figure 12
Neutralization profiles of rabbit immunized sera against rCedV chimeras expressing GFP. Seven-point dose-response neutralization profiles of HeV-sG (left) and HeV-sGtet (right) immunized sera against rCedV-NiV-B-GFP and rCedV-HeV-GFP are shown. Neutralization percent (%) was calculated based on fluorescent foci for each virus without serum. These data represent mean ± standard deviation from two independent experiments, each performed in triplicate. Data are plotted as non-linear regression curve fit with variable slope. The limit of detection for this assay was 50 fluorescent foci. Red circles and lines represent rCedV-NiV-B-GFP, and green squares and lines represent rCedV-HeV-GFP.

References

    1. Wang L.-F., Mackenzie J.S., Broder C.C. Henipaviruses. In: Knipe D.M., Howley P.M., editors. Fields Virology. Volume 1. Lippincott Williams & Wilkins; Philadelphia, PA, USA: 2013. pp. 1070–1085.
    1. Marsh G.A., de Jong C., Barr J.A., Tachedjian M., Smith C., Middleton D., Yu M., Todd S., Foord A.J., Haring V., et al. Cedar virus: A novel Henipavirus isolated from Australian bats. PLoS Pathog. 2012;8:e1002836. doi: 10.1371/journal.ppat.1002836. - DOI - PMC - PubMed
    1. Lee S.H., Kim K., Kim J., No J.S., Park K., Budhathoki S., Lee S.H., Lee J., Cho S.H., Cho S., et al. Discovery and Genetic Characterization of Novel Paramyxoviruses Related to the Genus Henipavirus in Crocidura Species in the Republic of Korea. Viruses. 2021;13:2020. doi: 10.3390/v13102020. - DOI - PMC - PubMed
    1. Zhang X.A., Li H., Jiang F.C., Zhu F., Zhang Y.F., Chen J.J., Tan C.W., Anderson D.E., Fan H., Dong L.Y., et al. A Zoonotic Henipavirus in Febrile Patients in China. N. Engl. J. Med. 2022;387:470–472. doi: 10.1056/NEJMc2202705. - DOI - PubMed
    1. Drexler J.F., Corman V.M., Muller M.A., Maganga G.D., Vallo P., Binger T., Gloza-Rausch F., Rasche A., Yordanov S., Seebens A., et al. Bats host major mammalian paramyxoviruses. Nat. Commun. 2012;3:796. doi: 10.1038/ncomms1796. - DOI - PMC - PubMed

Publication types

Supplementary concepts

LinkOut - more resources