. 2023 Sep;94(3):442-456.
doi: 10.1002/ana.26710. Epub 2023 Jun 14.

Regional Glymphatic Abnormality in Behavioral Variant Frontotemporal Dementia

Affiliations

Regional Glymphatic Abnormality in Behavioral Variant Frontotemporal Dementia

Deming Jiang et al. Ann Neurol. 2023 Sep.

Erratum in

Abstract

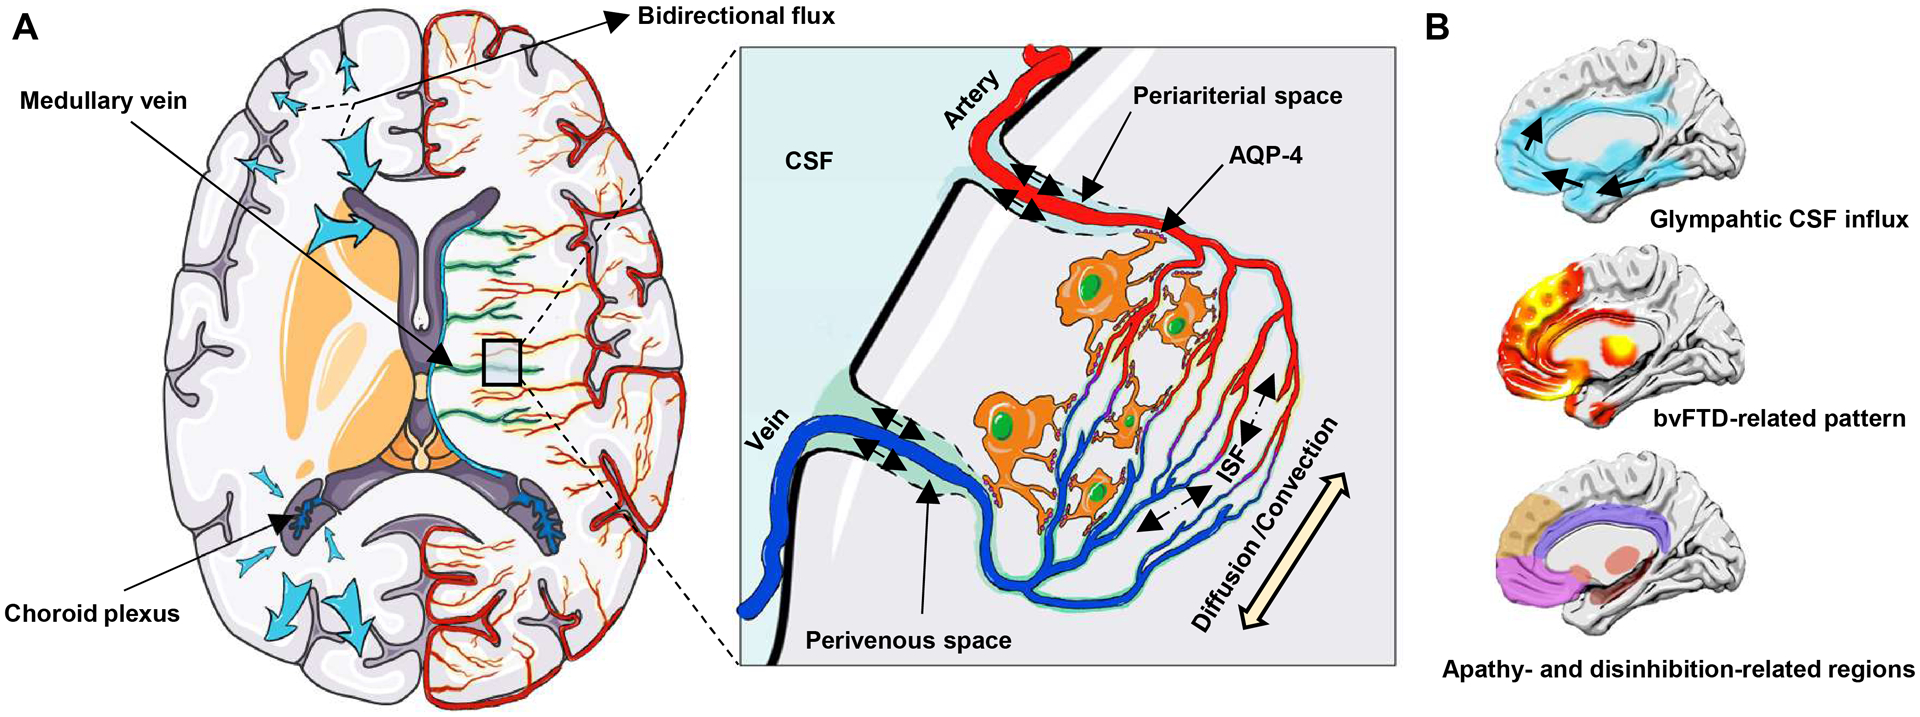
Objectives: Glymphatic function has not yet been explored in behavioral variant frontotemporal dementia (bvFTD). The spatial correlation between regional glymphatic function and bvFTD remains unknown.

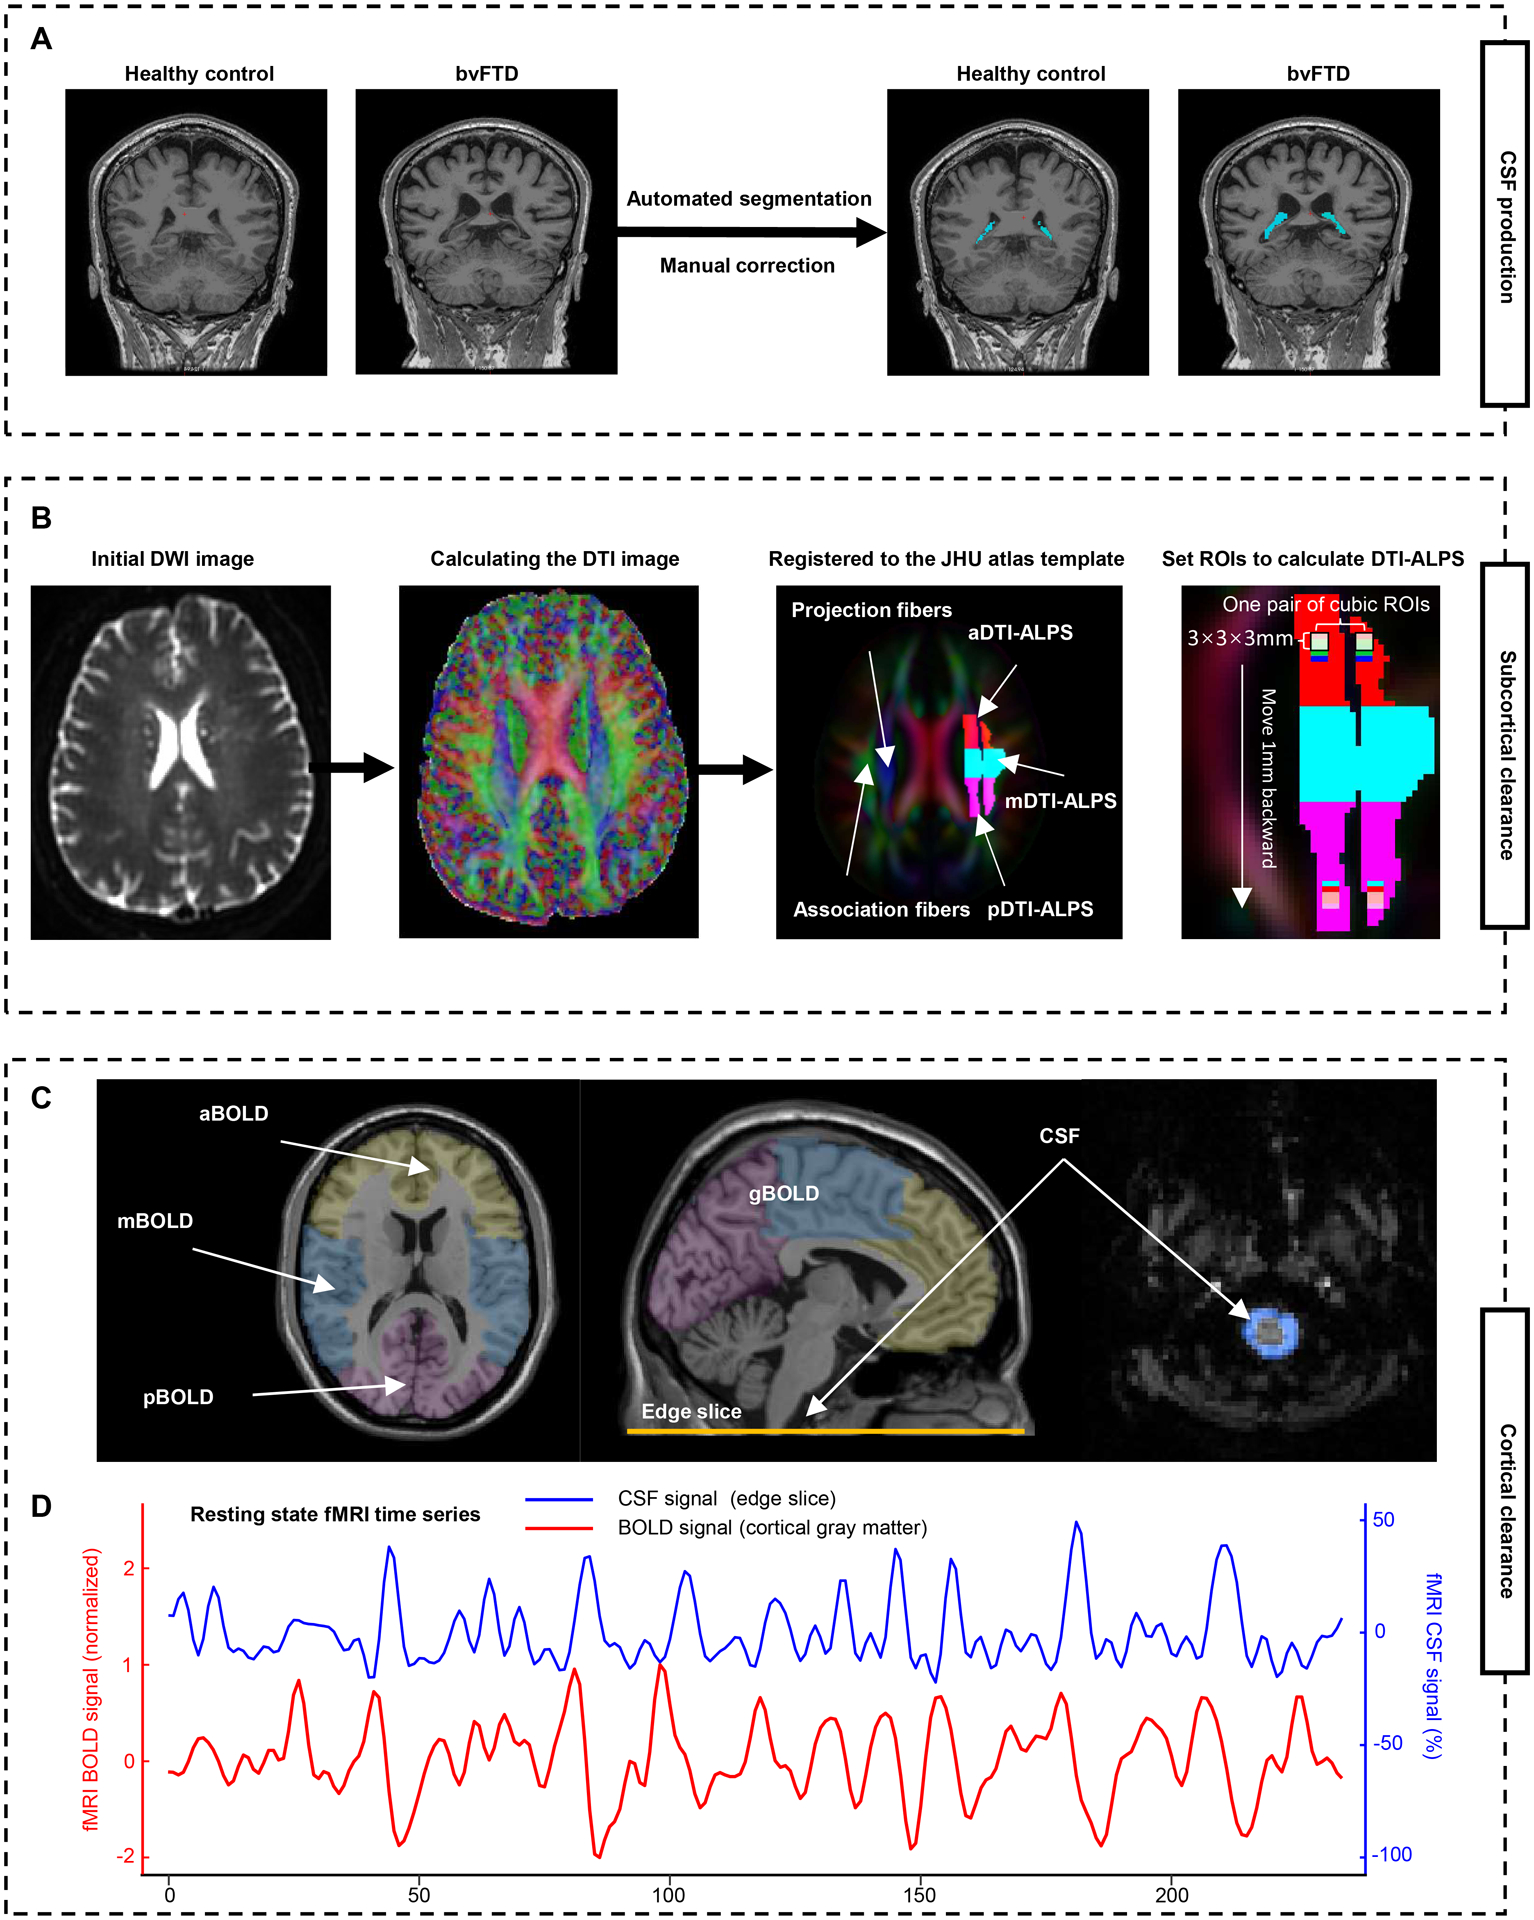
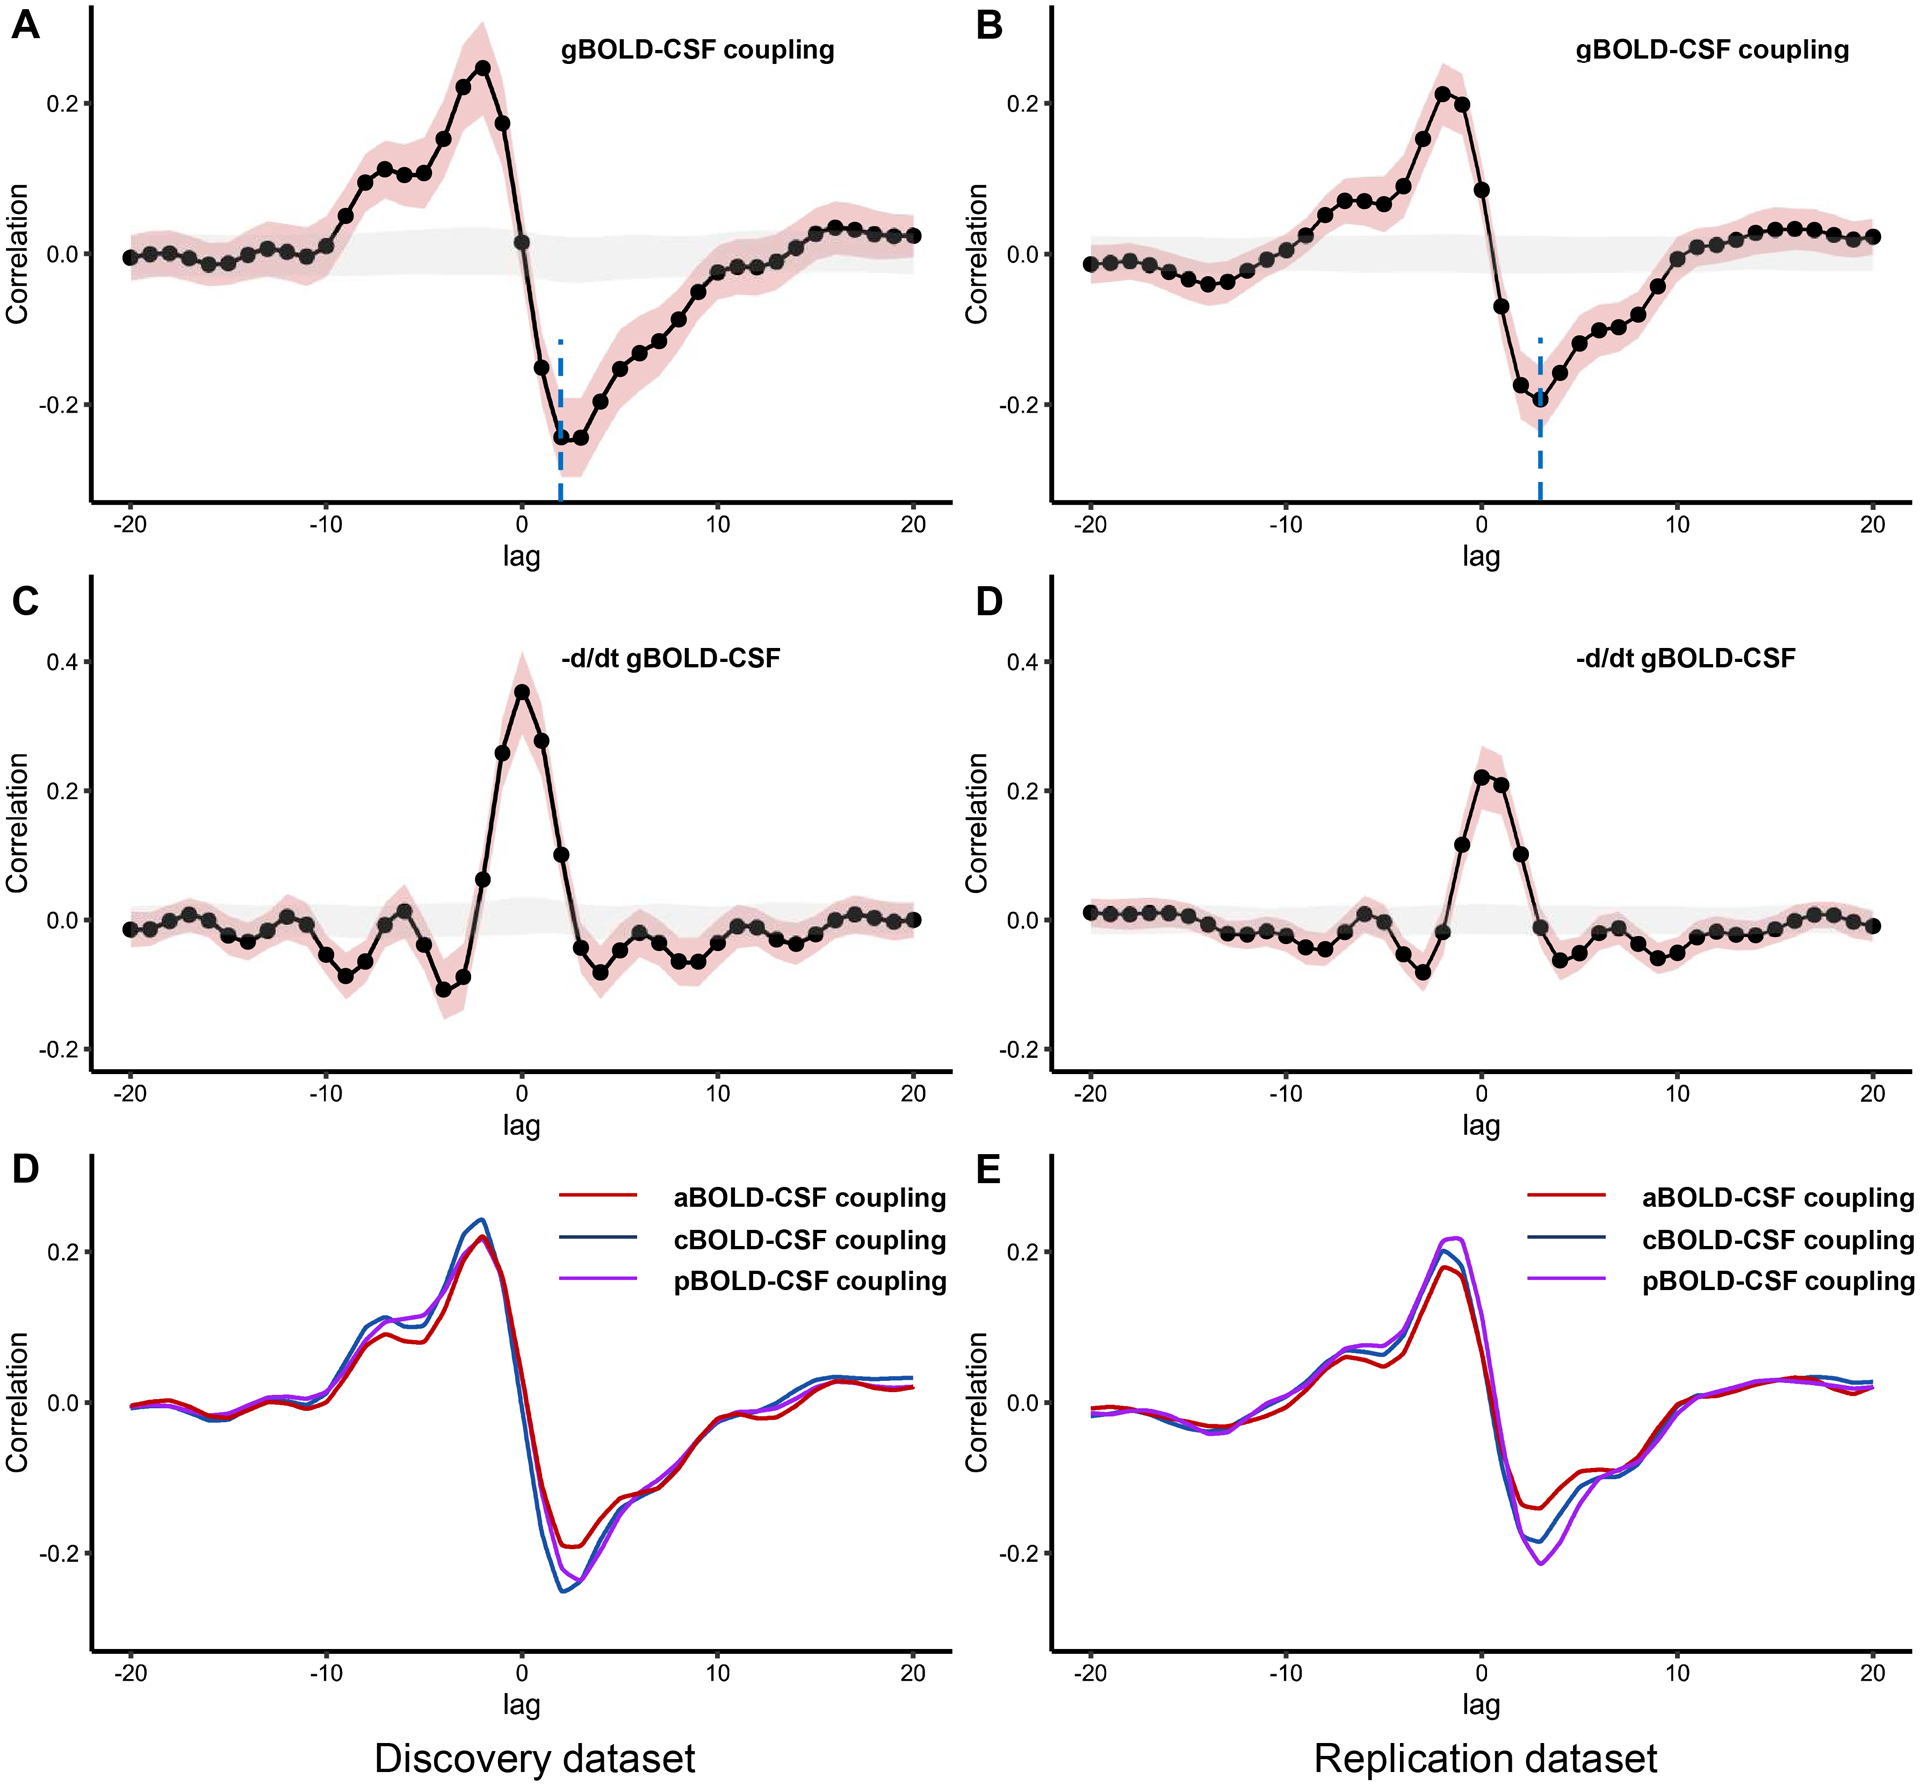
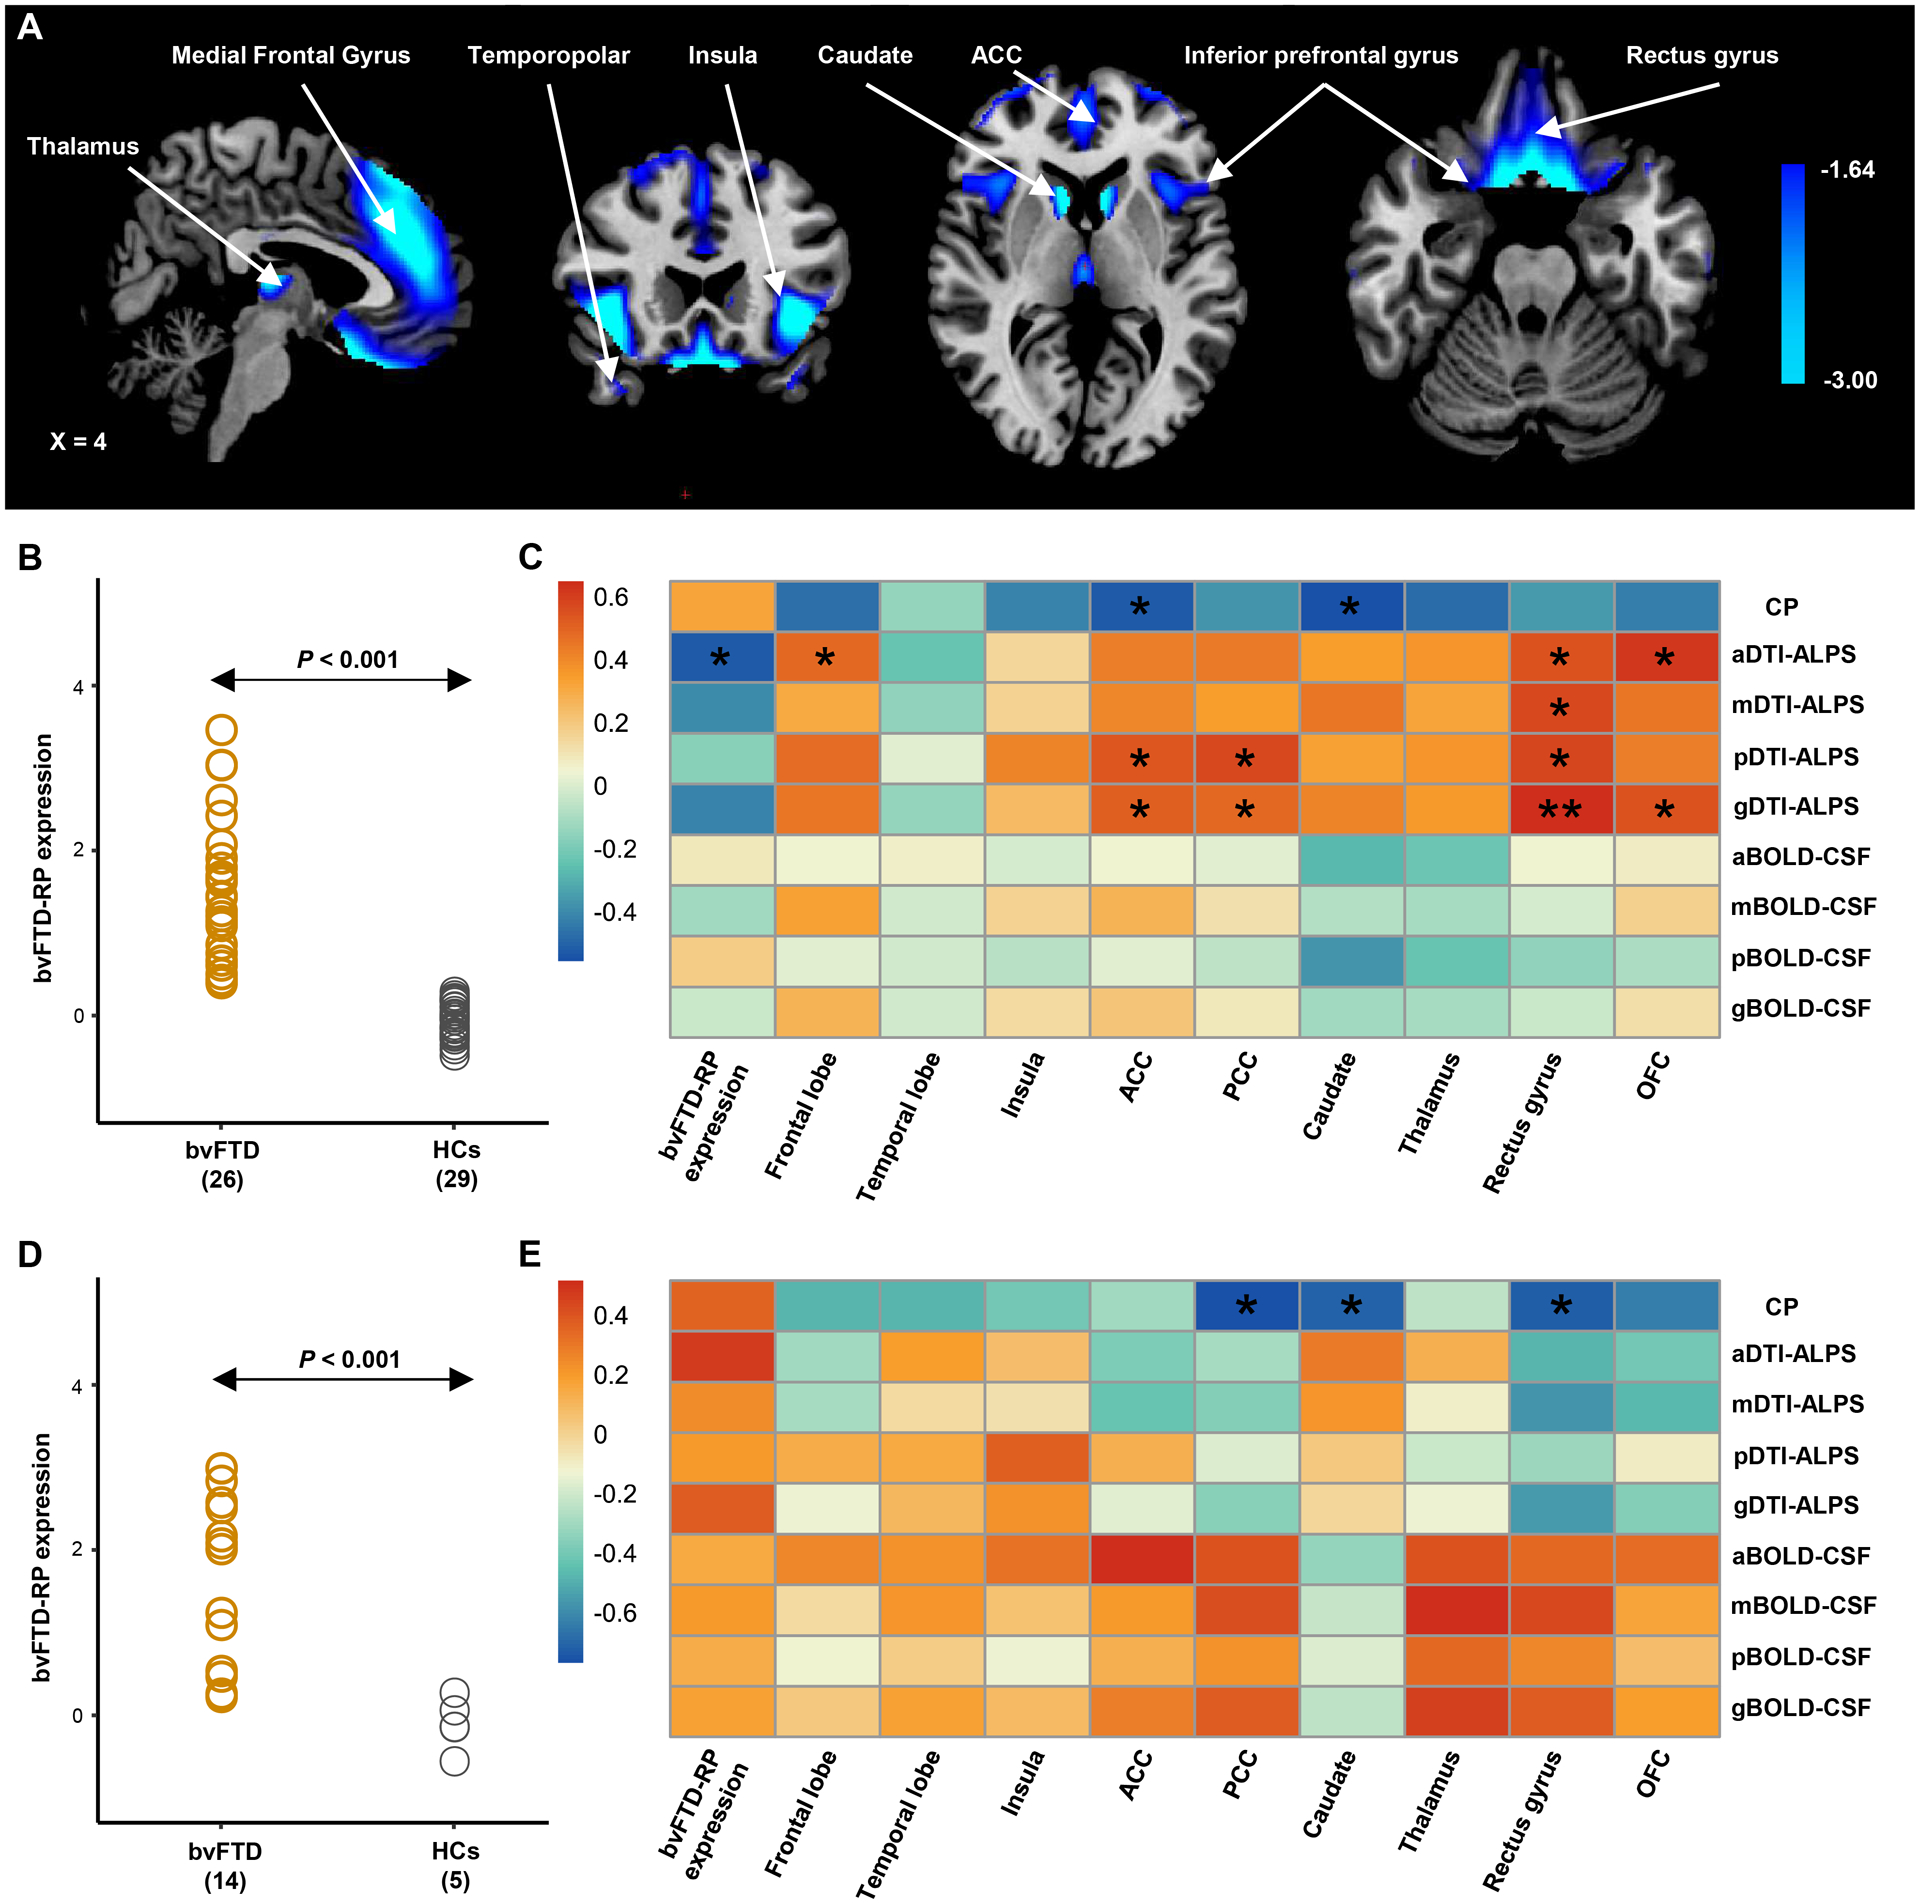
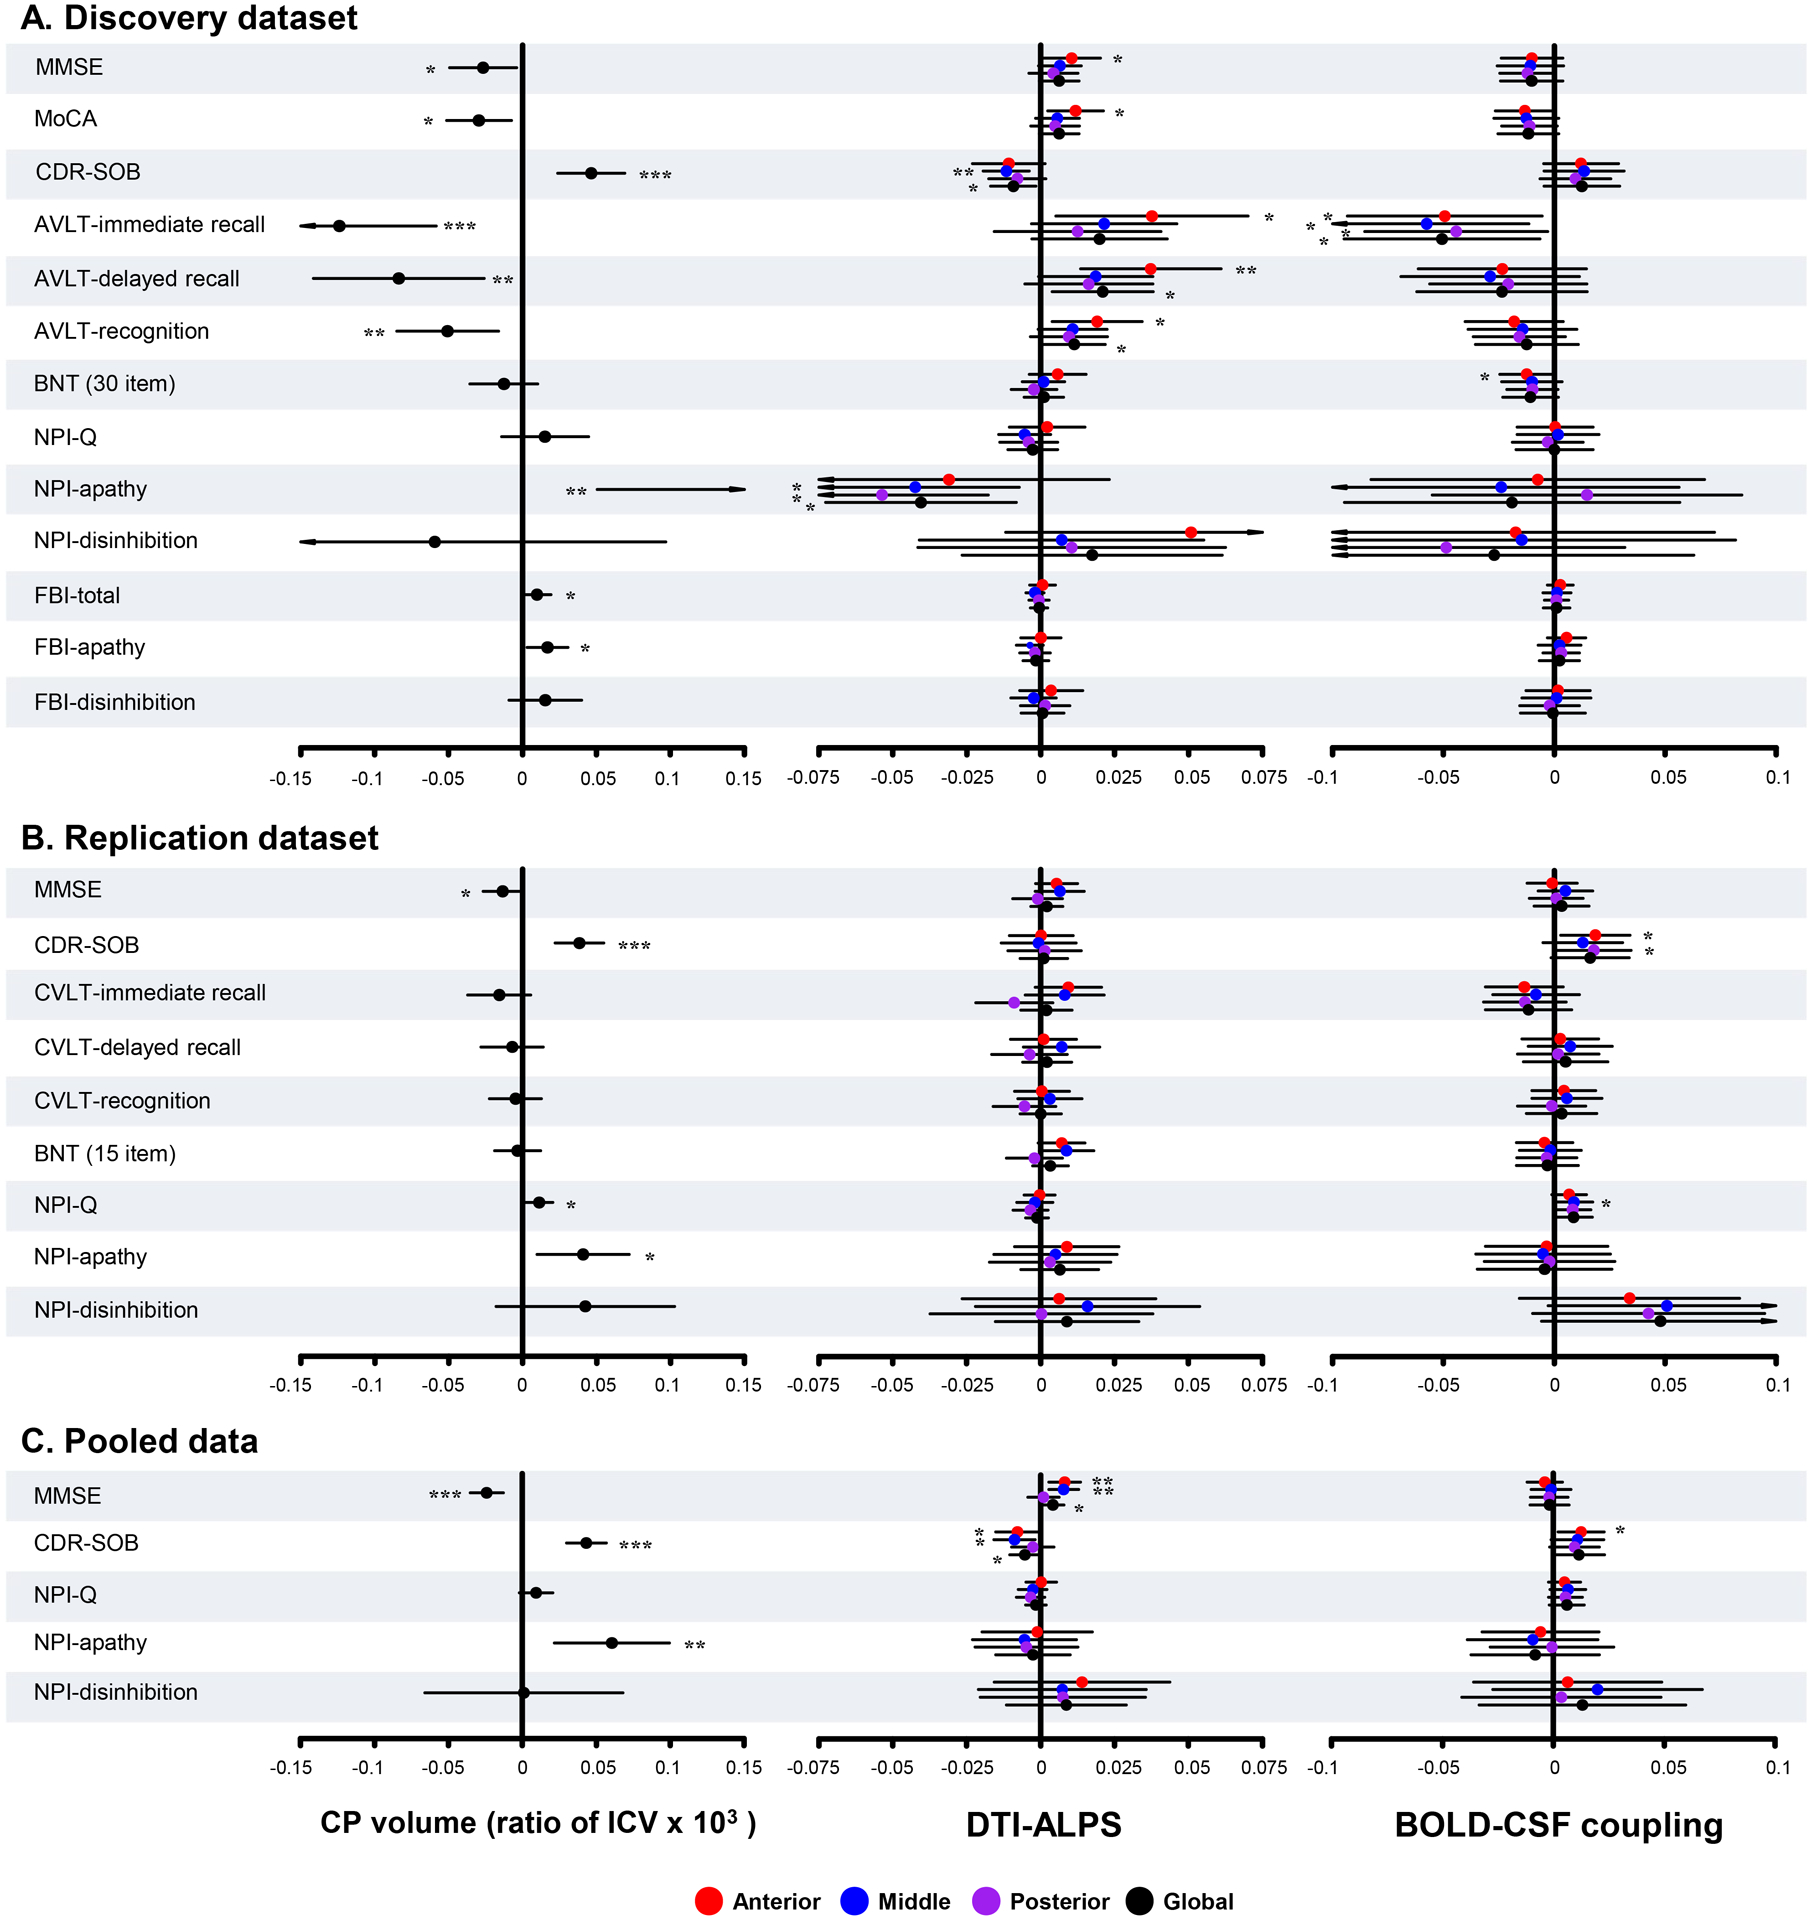
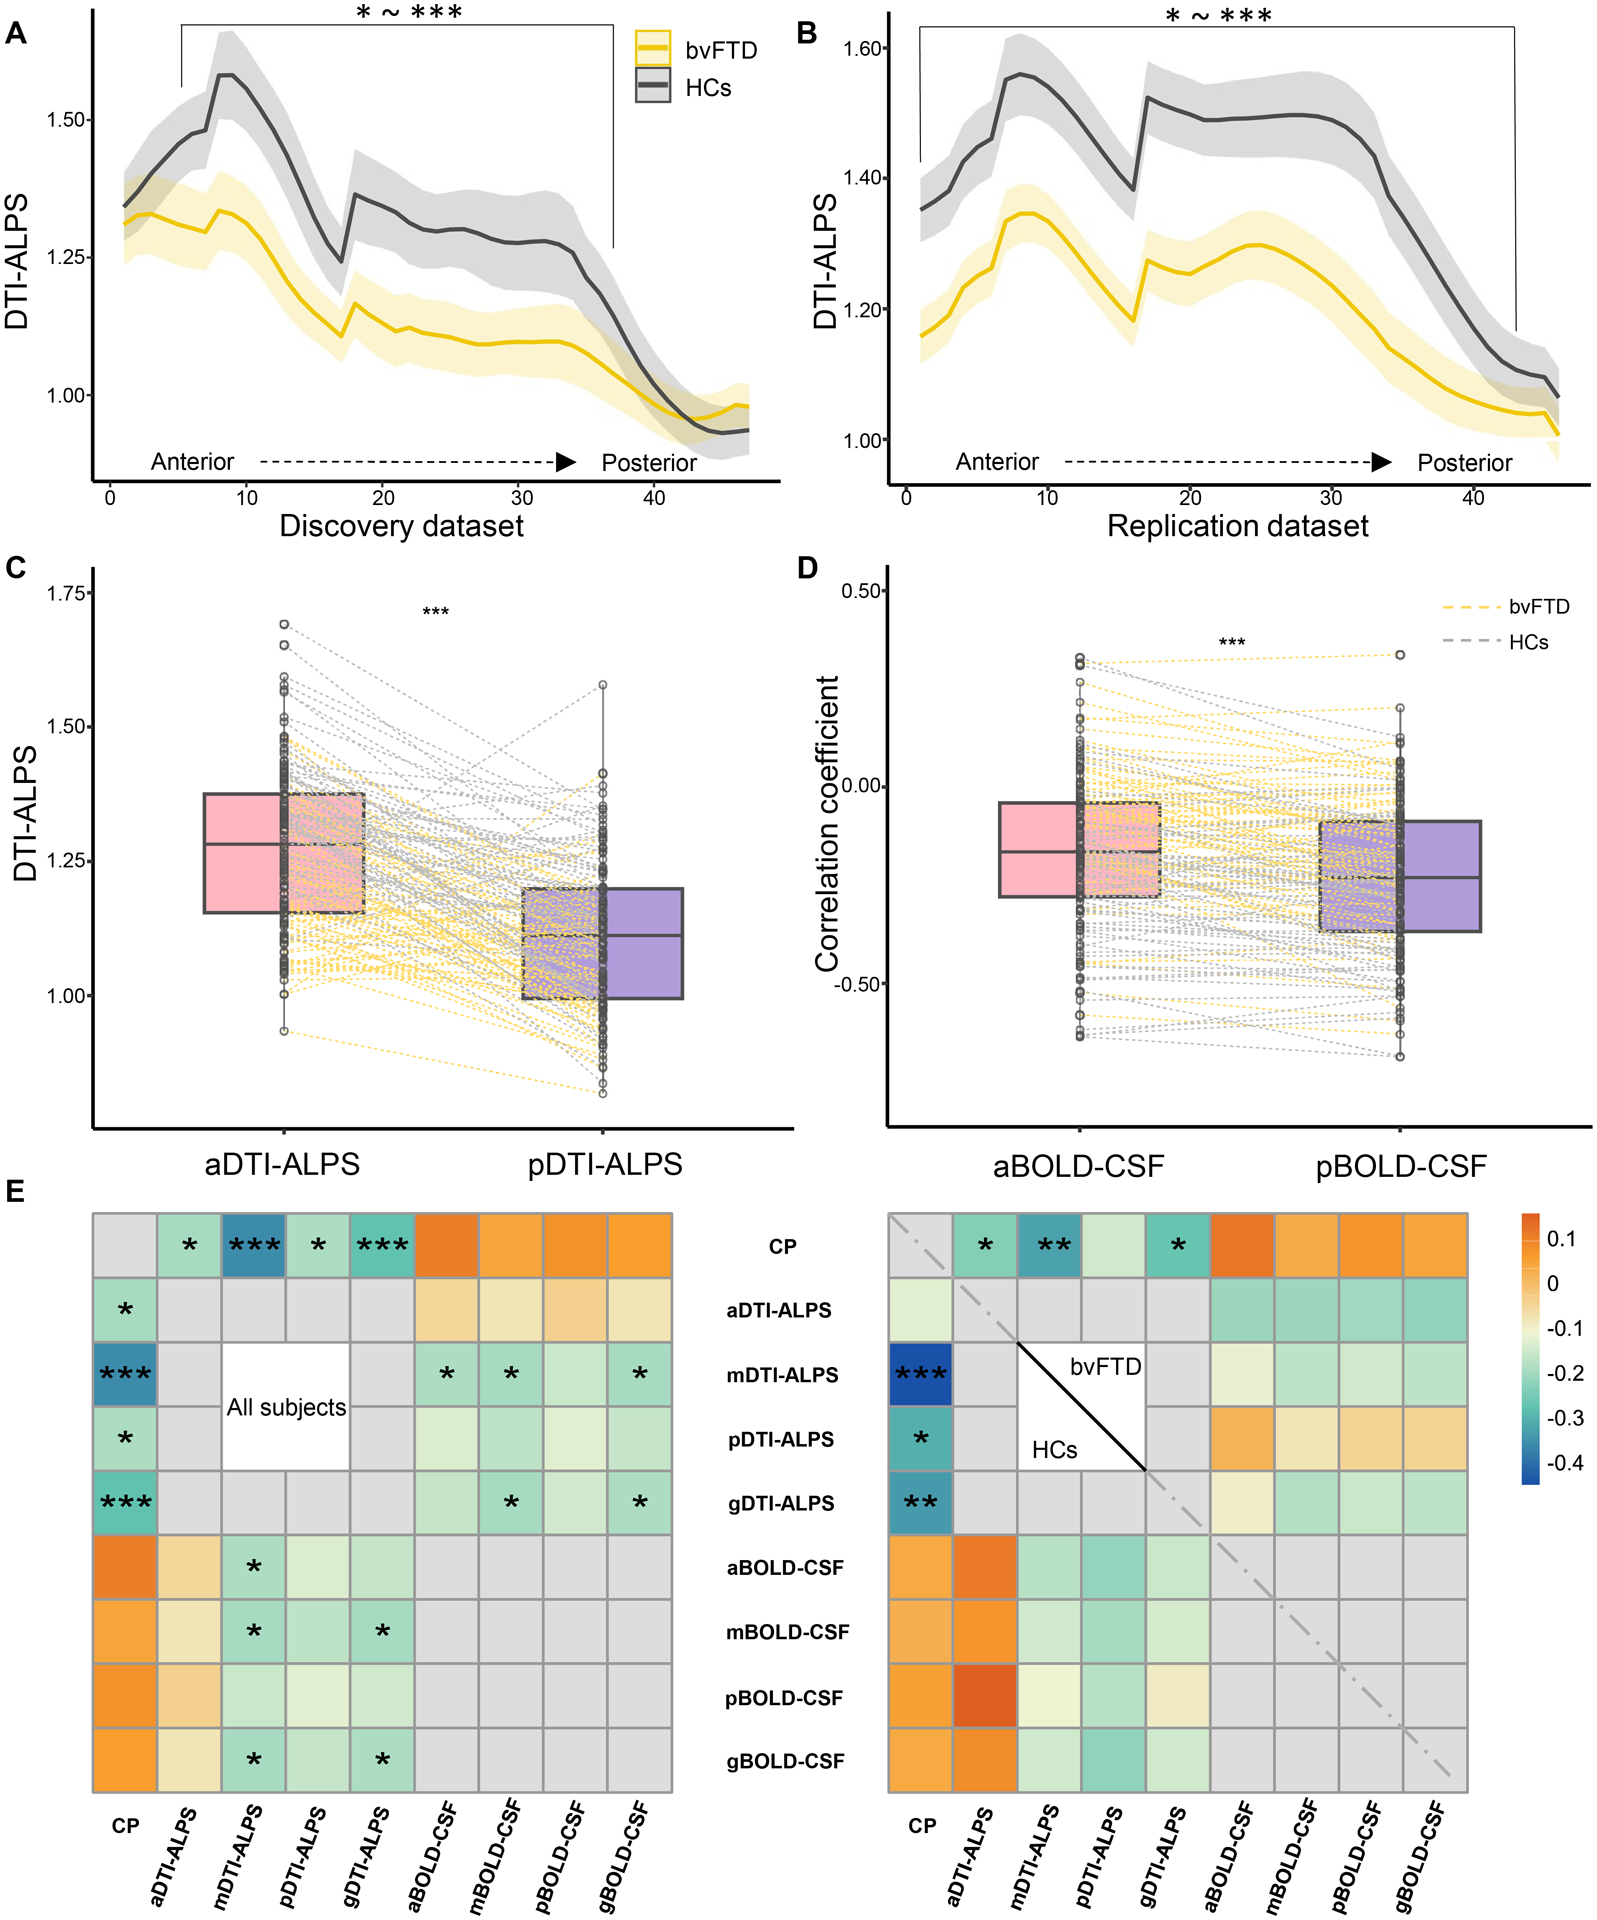
Method: A total of 74 patients with bvFTD and 67 age- and sex-matched healthy controls (HCs) were selected from discovery dataset and replication dataset. All participants underwent neuropsychological assessment. Glymphatic measures including choroid plexus (CP) volume, diffusion tensor imaging along the perivascular (DTI-ALPS) index, and coupling between blood-oxygen-level-dependent signals and cerebrospinal fluid signals (BOLD-CSF coupling), were compared between the two groups. Regional glymphatic function was evaluated by dividing DTI-ALPS and BOLD-CSF coupling into anterior, middle, and posterior regions. The bvFTD-related metabolic pattern was identified using spatial covariance analysis based on l8 F-FDG-PET.

Results: Patients with bvFTD showed higher CP volume (p < 0.001); anterior and middle DTI-ALPS (p < 0.001); and weaker anterior BOLD-CSF coupling (p < 0.05) than HCs after controlling for cortical gray matter volume in both datasets. In bvFTD from the discovery dataset, the anterior DTI-ALPS was negatively associated with the expression of the bvFTD-related metabolic pattern (r = -0.52, p = 0.034) and positively related with regional standardized uptake value ratios of l8 F-FDG-PET in bvFTD-related brain regions (r range: 0.49 to 0.62, p range: 0.017 to 0.047). Anterior and middle glymphatic functions were related to global cognition and disease severity.

Interpretation: Our findings reveal abnormal glymphatic function, especially in the anterior and middle regions of brain in bvFTD. Regional glymphatic dysfunction may contribute to the pathogenesis of bvFTD. ANN NEUROL 2023;94:442-456.


Conflict of interest statement

Potential Conflicts of Interest

The authors have no conflicts of interest to declare.

Figures

Figure 1:
Figure 1:. Glymphatic system and the spatial correlation with bvFTD.
(A) Choroid plexuses secret CSF. CSF inflows from periariterial spaces to the brain parenchyma, mixes with ISF by the diffusion and convection movement, and then outflows through perivenous spaces, which is facilitated by AQP-4 water channels on astroctytic end-feet. The glymphatic pathway may have different clearance rates in different brain regions and may drive CSF-ISF bidirectionally into either the ventricles or subarachnoid space (blue arrow). (B) Spatial correlation between the glymphatic CSF influx and bvFTD related pattern, and apathy- and disinhibition-related brain regions. The bvFTD-related pattern is identified from the discovery dataset by the multivariate spatial covariance analysis based on 18F-FDG-PET imaging data. bvFTD = behavioral variant frontotemporal dementia; CSF = cerebrospinal fluid; ISF = interstitial fluid.
Figure 2:
Figure 2:. Schematic of the multi-parametric assessment approaches for the glymphatic function.
(A) Automated segmentation and manual correction of choroid plexus within the lateral ventricles. (B) MRI processing approach for DTI-ALPS calculation and segmentation. Initial DWI image is coregistered to the corresponding T1-weighted image, and then calculated the DTI image. The FA map is registered to the FA map of the JHU atlas template. The ROIs were extracted and segmented into three parts based on the atlas labels (anterior, superior, and posterior corona radiata, and superior longitudinal fasciculus). Additionally, 46 parts of 3 × 3 × 3 mm3 cubic ROIs are drawn in the left projection and association fibers. (C) To calculate the BOLD-CSF coupling, the global BOLD signal is extracted from the cortical gray matter region of cerebrum, then is divide into three parts: anterior BOLD, middle BOLD, and posterior BOLD. The CSF signals are extracted from the edge slice of fMRI acquisition located between the upper spinal cord/medulla oblongata and lower cerebellum. (D) A strong coupling between the global cortical BOLD signals and CSF signals was observed in a representative healthy control. a/m/pDTI-ALPS = anterior/middle/posterior diffusion along perivascular space index; g/a/m/pBOLD-CSF coupling = the coupling between blood-oxygen-level-dependent signals from global/anterior/middle/posterior cortical gray matter and cerebrospinal fluid signals; FA = fractional anisotropy; ROIs = regions of interests; JHU atlas = Johns Hopkins University atlas.
Figure 3:
Figure 3:. The cross-correlation analysis between the BOLD signal and the CSF signal.
(A-B) The mean gBOLD-CSF cross-correlation function (−20~+20s) displays positive peaks at time lags −2~−3 s (r = 0.21–0.24, P < 0.001, permutation test) and a negative peak at time lags 2~3 s (r = −0.19–−0.24, P < 0.001, permutation test; blue dotted line). (C-D) The mean negative first-order derivative gBOLD signals couple with CSF signals. Large positive peaks are seen at time lags 0s (r = 0.22–0.35, P < 0.001, permutation test). (E-F) Anterior, middle, and posterior BOLD-CSF coupling show different coupling strength at negative peaks. Shaded red is 95% interval of the mean correlation coefficient across subjects. Shaded grey is 95% interval of mean correlation coefficient across random pairs 1000 times repeatedly. g/a/m/pBOLD-CSF coupling = the coupling between blood-oxygen-level-dependent signals from global/anterior/middle/posterior cortical gray matter and cerebrospinal fluid signals.
Figure 4:
Figure 4:. Behavioral variant frontotemporal dementia-related pattern (bvFTD-RP) and the spatial correlation with the glymphatic function.
(A) The bvFTD-RP was identified from the 18F-FDG PET data of 26 patients with bvFTD and 29 age- and sex-matched healthy controls from the discovery dataset using the spatial covariance analysis (SSM/PCA). Voxel weights on metabolic network regions reliable based on bootstrap estimation. Metabolic reductions were observed in bilateral metabolic reductions in the thalamus, caudate, insular, ACC, OFC, rectus gyrus, inferior and middle frontal gyrus, and temporopolar. (B) Individual bvFTD-RP expression significantly (P < 0.001, Student’s t test between groups) separated the bvFTD patients from the healthy controls from the discovery dataset, and this finding was validated in the replication dataset (D). (C-E) Heatmap shows the partial correlation analysis between glymphatic measures and the bvFTD-RP expression and the regional SUVRs value of nine ROIs in bvFTD patients from the discovery dataset (C) and replication dataset (E). P values were adjusted for age, sex and frontotemporal volume, and corrected for multiple comparisons using the false discovery rate approach. g/a/m/pDTI-ALPS = global/anterior/middle/posterior diffusion along perivascular space index; g/a/m/pBOLD-CSF coupling = the coupling between blood-oxygen-level-dependent signals from global/anterior/middle/posterior cortical gray matter and cerebrospinal fluid signals; SUVRs= standardized uptake value ratios; ACC = anterior cingulate gyri; PCC = posterior cingulate gyri; OFC = orbitofrontal cortex; bvFTD = behavioral variant frontotemporal dementia; HCs = healthy controls. *P < 0.05, **P < 0.01.
Figure 5:
Figure 5:. Regression analysis between glymphatic measures and neuropsychological test scores.
Forest plots show the results in the discovery dataset (A), the replication dataset (B), and the pooled data (C). The X axis shows the unstandardized β. P values were adjusted for age, sex, years of education, frontotemporal volume (discovery dataset), and scanning sites (replication dataset and pooled data). MMSE = Mini-Mental State Examination; MoCA = Montreal Cognitive Assessment; BNT = Boston Naming Test; AVLT = Auditory verbal learning test; CVLT = California Verbal Learning Test; CDR = Clinical Dementia Rating score; SOB = sum of boxes; NPI-Q = Neuropsychiatry Inventory Questionnaire; FBI = Frontal Behavioral Inventory; CP = choroid plexus; ICV = intracranial volume; g/a/m/pDTI-ALPS = global/anterior/middle/posterior diffusion along perivascular space index; g/a/m/pBOLD-CSF coupling = the coupling between blood-oxygen-level-dependent signals from global/anterior/middle/posterior cortical gray matter and cerebrospinal fluid signals. *P < 0.05, **P < 0.01, ***P < 0.001.
Figure 6:
Figure 6:. Glymphatic gradient and the relationship between different regional glymphatic functions.
(A-B) show the DTI-ALPS gradient and inter-group differences. (C-D) show the paired-sample t-test between aDTI-ALPS and pDTI-ALPS, and aBOLD-CSF coupling and pBOLD-CSF coupling, respectively. (E) Heatmaps show the relationship between glymphatic measures in the whole cohort and in the groups separately. P values in heatmaps were adjusted for age, sex, scanning sites (right), and groups (left). bvFTD = behavioral variant frontotemporal dementia; HCs = healthy controls. CP = choroid plexus; ICV = intracranial volume; g/a/m/pDTI-ALPS = global/anterior/middle/posterior diffusion along perivascular space index; g/a/m/pBOLD-CSF coupling = the coupling between blood-oxygen-level-dependent signals from global/anterior/middle/posterior cortical gray matter and cerebrospinal fluid signals. *P < 0.05, **P < 0.01, ***P < 0.001.

Comment in

References

    1. Bang J, Spina S, Miller BL. Frontotemporal dementia. Lancet. 2015;386(10004):1672–1682. - PMC - PubMed
    1. Giannini LAA, Peterson C, Ohm D, et al. Frontotemporal lobar degeneration proteinopathies have disparate microscopic patterns of white and grey matter pathology. Acta Neuropathol Commun. 2021;9(1):30. - PMC - PubMed
    1. Kawles A, Nishihira Y, Feldman A, et al. Cortical and subcortical pathological burden and neuronal loss in an autopsy series of FTLD-TDP-type C. Brain. 2022;145(3):1069–1078. - PMC - PubMed
    1. Scarioni M, Gami-Patel P, Peeters CFW, et al. Psychiatric symptoms of frontotemporal dementia and subcortical (co-)pathology burden: new insights. Brain. Published online February 8, 2022:awac043. - PMC - PubMed
    1. Boland B, Yu WH, Corti O, et al. Promoting the clearance of neurotoxic proteins in neurodegenerative disorders of ageing. Nat Rev Drug Discov. 2018;17(9):660–688. - PMC - PubMed

Publication types

LinkOut - more resources