

From cells to form: A roadmap to study shape emergence in vivo
- PMID: 37243338
- PMCID: PMC10541488
- DOI: 10.1016/j.bpj.2023.05.015
From cells to form: A roadmap to study shape emergence in vivo
Abstract
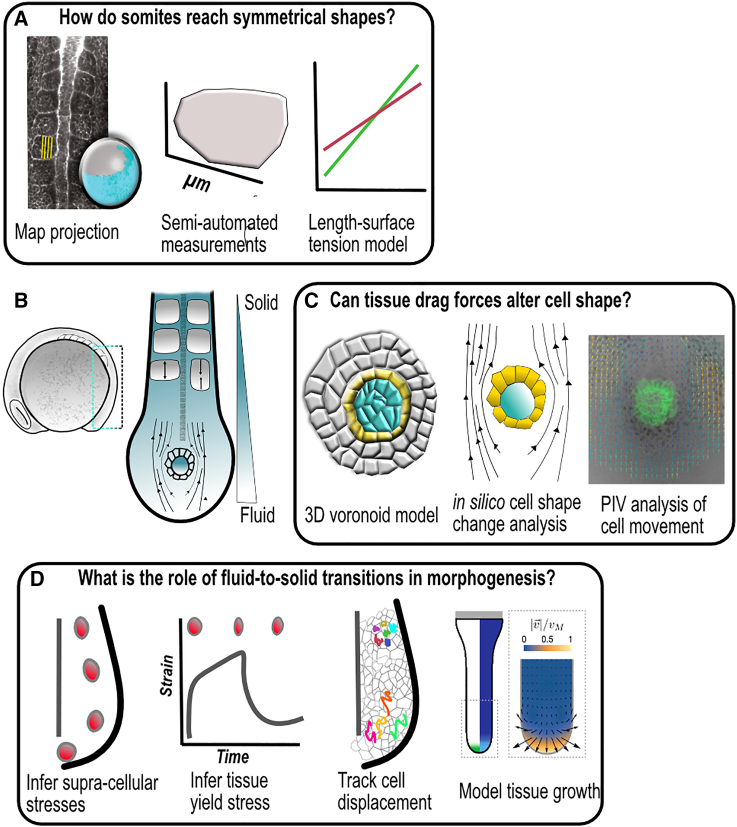
Organogenesis arises from the collective arrangement of cells into progressively 3D-shaped tissue. The acquisition of a correctly shaped organ is then the result of a complex interplay between molecular cues, responsible for differentiation and patterning, and the mechanical properties of the system, which generate the necessary forces that drive correct shape emergence. Nowadays, technological advances in the fields of microscopy, molecular biology, and computer science are making it possible to see and record such complex interactions in incredible, unforeseen detail within the global context of the developing embryo. A quantitative and interdisciplinary perspective of developmental biology becomes then necessary for a comprehensive understanding of morphogenesis. Here, we provide a roadmap to quantify the events that lead to morphogenesis from imaging to image analysis, quantification, and modeling, focusing on the discrete cellular and tissue shape changes, as well as their mechanical properties.
Copyright © 2023 Biophysical Society. Published by Elsevier Inc. All rights reserved.
Conflict of interest statement
Declaration of interests The authors declare no competing interests.
Figures


Similar articles
-
The mechanics of development: Models and methods for tissue morphogenesis.Birth Defects Res C Embryo Today. 2010 Sep;90(3):193-202. doi: 10.1002/bdrc.20185. Birth Defects Res C Embryo Today. 2010. PMID: 20860059 Free PMC article. Review.
-
Using cell deformation and motion to predict forces and collective behavior in morphogenesis.Semin Cell Dev Biol. 2017 Jul;67:161-169. doi: 10.1016/j.semcdb.2016.07.029. Epub 2016 Aug 2. Semin Cell Dev Biol. 2017. PMID: 27496334 Free PMC article. Review.
-
Pulling together: Tissue-generated forces that drive lumen morphogenesis.Semin Cell Dev Biol. 2016 Jul;55:139-47. doi: 10.1016/j.semcdb.2016.01.002. Epub 2016 Jan 8. Semin Cell Dev Biol. 2016. PMID: 26778757 Free PMC article. Review.
-
Mechanical control of tissue shape: Cell-extrinsic and -intrinsic mechanisms join forces to regulate morphogenesis.Semin Cell Dev Biol. 2022 Oct;130:45-55. doi: 10.1016/j.semcdb.2022.03.017. Epub 2022 Mar 30. Semin Cell Dev Biol. 2022. PMID: 35367121 Review.
-
3D viscoelastic drag forces contribute to cell shape changes during organogenesis in the zebrafish embryo.Cells Dev. 2021 Dec;168:203718. doi: 10.1016/j.cdev.2021.203718. Epub 2021 Jul 14. Cells Dev. 2021. PMID: 34273601 Free PMC article.
References
Publication types
MeSH terms
LinkOut - more resources
Full Text Sources
