. 2023 Sep;115(5):1331-1344.
doi: 10.1111/tpj.16322. Epub 2023 Jun 8.

The TOPLESS corepressor regulates developmental switches in the bryophyte Physcomitrium patens that were critical for plant terrestrialisation

Affiliations

The TOPLESS corepressor regulates developmental switches in the bryophyte Physcomitrium patens that were critical for plant terrestrialisation

Barry Causier et al. Plant J. 2023 Sep.

Abstract

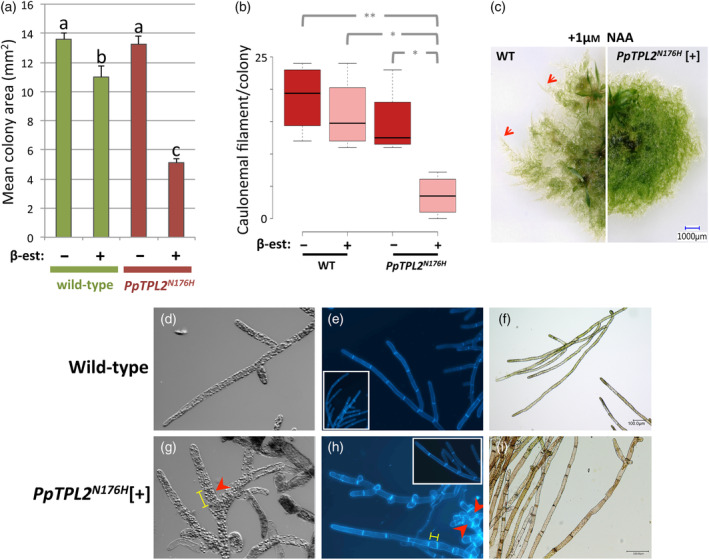
The plant-specific TOPLESS (TPL) family of transcriptional corepressors is integral to multiple angiosperm developmental processes. Despite this, we know little about TPL function in other plants. To address this gap, we investigated the roles TPL plays in the bryophyte Physcomitrium patens, which diverged from angiosperms approximately 0.5 billion years ago. Although complete loss of PpTPL function is lethal, transgenic lines with reduced PpTPL activity revealed that PpTPLs are essential for two fundamental developmental switches in this plant: the transitions from basal photosynthetic filaments (chloronemata) to specialised foraging filaments (caulonemata) and from two-dimensional (2D) to three-dimensional (3D) growth. Using a transcriptomics approach, we integrated PpTPL into the regulatory network governing 3D growth and we propose that PpTPLs represent another important class of regulators that are essential for the 2D-to-3D developmental switch. Transcriptomics also revealed a previously unknown role for PpTPL in the regulation of flavonoids. Intriguingly, 3D growth and the formation of caulonemata were crucial innovations that facilitated the colonisation of land by plants, a major transformative event in the history of life on Earth. We conclude that TPL, which existed before the land plants, was co-opted into new developmental pathways, enabling phytoterrestrialisation and the evolution of land plants.

Keywords: Physcomitrium patens; TOPLESS; land plants; three-dimensional growth; transcriptional corepressor.


Figures

Figure 1
Figure 1
Reduced TPL activity disrupts P. patens development. (a) Typical mock‐treated wild‐type plant (WT[−]). Filamentous growth can be seen at the edge of the plant, with leafy shoots (gametophores) at the centre. (b) Typical wild‐type plant treated with 1 μm β‐estradiol (WT[+]). (c) Typical mock‐treated PpTPL2 N176H transgenic plant (PpTPL2 N176H [−]). Note that plants in panels (b) and (c) are phenotypically similar to the wild‐type plant in (a). (d) PpTPL2 N176H plant treated with 1 μm β‐estradiol (PpTPL2 N176H [+]), showing loss of mature gametophores and red/brown hyperpigmentation. All plants are approximately 6 weeks old. Scale bars = 1 mm.
Figure 2
Figure 2
PpTPL is required for gametophore development. (a) Box and whisker plot for numbers of gametophore structures with at least one leaf counted in dissected 5‐week‐old colonies (n > 10). Centre lines show the medians; box limits indicate the 25th and 75th percentiles as determined by R software; whiskers extend 1.5 times the interquartile range from the 25th and 75th percentiles; outliers are represented by dots. Two independent PpTPL2 N176H lines (I and II) were measured. [−] indicates mock‐treated control plants, [+] indicates plants grown on media supplemented with 1 μm β‐estradiol. Boxes with different letters are significantly different from one another (Tukey HSD inference; P < 0.01). (b) First bud cell divisions in wild‐type plants, with the first oblique division shown in the inset and highlighted with asterisks (scale bar = 50 μm). Subsequent asymmetric cell divisions are marked by asterisks in the main panel. (c, d) Later stages of gametophore formation. (e) The first cell division (marked by asterisks) in PpTPL2 N176H plants treated with 1 μm β‐estradiol (PpTPL2 N176H [+]), which is misoriented relative to wild type (b). (f, g) Subsequent cell divisions are also misoriented in PpTPL2 N176H [+] plants, leading to the production of malformed callus‐like structures in place of normal gametophores (compare panels (d) and (g)).
Figure 3
Figure 3
Genes involved in the switch to 3D growth show altered expression in PpTPL dominant negative plants. Expression profiles of candidate genes linked to 3D growth in PpTPL2 N176H [+] plants relative to controls. Bar colours represent adjusted P‐values (P adj) as a measure of statistical significance (see key inset). Unfilled bars (PpAPB2 and PpAPB3) are not significant.
Figure 4
Figure 4
The expression of genes involved in diverse biological processes is altered in PpTPL dominant negative plants. (a) Enrichment of Gene Ontology (GO) terms associated with genes upregulated in PpTPL2 N176H [+] plants. GO terms associated with biological processes (top) or molecular functions (bottom) are shown. The dendrograms on the left show the relationships between GO terms. The charts on the right shows the log10 (false discovery rate [FDR]) value. (b) Expression profiles of candidate genes linked to flavonoid biosynthesis in PpTPL2 N176H [+] plants relative to controls. Bar colours represent adjusted P‐values (P adj) as a measure of statistical significance (see key inset). (c) Quantification of total flavonoid content in extracts from wild‐type (WT) and PpTPL2 N176H plants, grown in the presence [+] or absence [−] of 1 μm β‐estradiol. Different letters indicate significant differences (Tukey HSD inference; P < 0.01). (d) GO terms enriched for genes downregulated in PpTPL2 N176H [+] plants. The dendrogram to the left shows the relationships between GO terms. The chart on the right shows the log10(FDR) value.
Figure 5
Figure 5
PpTPL is necessary for the chloronema‐to‐caulonema developmental switch. (a) Mean colony area (±SEM; n ≤ 12) for wild‐type and PpTPL2 N176H plants, grown with [+] or without [−] 1 μm β‐estradiol (β‐est). Different letters indicate significant differences (Tukey HSD inference; P < 0.01). (b) Box and whisker plot for average number of caulonemal filaments produced per plant (n = 4) under dark‐grown conditions. Centre lines show the medians; box limits indicate the 25th and 75th percentiles as determined by R software; whiskers extend 1.5 times the interquartile range from the 25th and 75th percentiles. Statistically significant differences between samples are shown (Tukey HSD inference; **P < 0.01, *P < 0.05). (c) Physcomitrium patens plants grown in the presence of 1 μm exogenous auxin (NAA). Wild‐type plant (left) and PpTPL2 N176H plant treated with 1 μm β‐estradiol (right; PpTPL2 N176H [+]). In the presence of NAA, WT plants produce caulonemal filaments (red arrows), giving a feathery colony edge, whilst PpTPL2 N176H [+] plants do not. (d–f) Typical chloronemal filaments produced by wild‐type plants under control conditions. (g–i) Protonemal filaments produced by PpTPL2 N176H plants treated with 1 μm β‐estradiol (PpTPL2 N176H [+]). Note that some cells are swollen (red arrow heads) and/or shorter (yellow bars) than in WT filaments (g and h). Also note the red/brown pigmentation and the heterogeneous nature of some filaments (i). For example, the filaments in (i) have properties of both caulonemata (red/brown pigment not found in chloronemata) and chloronemata (perpendicular cell walls, rather than the oblique cell walls characteristic of caulonemata). Micrographs in panels (d) and (g) are at the same magnification. Micrographs in panels (e) and (h) are at the same magnification. Scale bars in (f) and (i) = 1 μm.
Figure 6
Figure 6
Model for TPL function in the gene regulatory network that controls 3D growth in P. patens. During the initial stages of 3D bud initiation, TPL operates upstream of APB1–4, CKX, CLV signalling and NOG2, all of which are required for normal transition to 3D growth. Arrows and T‐bars indicate gene activation and repression, respectively. A dotted line indicates that any functional interaction remains to be resolved.

References

    1. Afgan, E. , Baker, D. , Batut, B. , van den Beek, M. , Bouvier, D. , Cech, M. et al. (2018) The galaxy platform for accessible, reproducible and collaborative biomedical analyses: 2018 update. Nucleic Acids Research, 46, W537–W544. Available from: 10.1093/nar/gky379 - DOI - PMC - PubMed
    1. Aoyama, T. , Hiwatashi, Y. , Shigyo, M. , Kofuji, R. , Kubo, M. , Ito, M. et al. (2012) AP2‐type transcription factors determine stem cell identity in the moss Physcomitrella patens . Development, 139, 3120–3129. Available from: 10.1242/dev.076091 - DOI - PubMed
    1. Ashton, N.W. & Cove, D.J. (1977) The isolation and preliminary characterization of auxotrophic and analogue resistant mutants of the moss, Physcomitrella patens. Molecular & General Genetics, 154, 87–95.
    1. Ashton, N.W. , Grimsley, N.H. & Cove, D.J. (1979) Analysis of gametophytic development in the moss, Physcomitrella patens, using auxin and cytokinin resistant mutants. Planta, 144, 427–435. Available from: 10.1007/BF00380118 - DOI - PubMed
    1. Baymaz, H.I. , Karemaker, I.D. & Vermeulen, M. (2015) Perspective on unraveling the versatility of ‘co‐repressor’ complexes. Biochimica et Biophysica Acta, 1849, 1051–1056. Available from: 10.1016/j.bbagrm.2015.06.012 - DOI - PubMed

Publication types

MeSH terms

Substances