. 2023 Nov 24;17(11):1870-1881.
doi: 10.1093/ecco-jcc/jjad092.

Bacterial Oncotraits Rather than Spatial Organization Are Associated with Dysplasia in Ulcerative Colitis

Affiliations

Bacterial Oncotraits Rather than Spatial Organization Are Associated with Dysplasia in Ulcerative Colitis

Carlijn E Bruggeling et al. J Crohns Colitis. .

Abstract

Background and aims: Colonic bacterial biofilms are frequently present in ulcerative colitis [UC] and may increase dysplasia risk through pathogens expressing oncotraits. This prospective cohort study aimed to determine [1] the association of oncotraits and longitudinal biofilm presence with dysplasia risk in UC, and [2] the relation of bacterial composition with biofilms and dysplasia risk.

Methods: Faeces and left- and right-sided colonic biopsies were collected from 80 UC patients and 35 controls. Oncotraits [FadA of Fusobacterium, BFT of Bacteroides fragilis, colibactin [ClbB] and Intimin [Eae] of Escherichia coli] were assessed in faecal DNA with multiplex quantitative polymerase chain reaction [qPCR]. Biopsies were screened for biofilms [n = 873] with 16S rRNA fluorescent in situ hybridiation. Shotgun metagenomic sequencing [n = 265], and ki67-immunohistochemistry were performed. Associations were determined with a mixed-effects regression model.

Results: Biofilms were highly prevalent in UC patients [90.8%] with a median persistence of 3 years (interquartile range [IQR] 2-5 years). Biofilm-positive biopsies showed increased epithelial hypertrophy [p = 0.025] and a reduced Shannon diversity independent of disease status [p = 0.015], but were not significantly associated with dysplasia in UC: adjusted odds ratio [aOR] 1.45, 95% confidence interval [CI] 0.63-3.40. In contrast, ClbB independently associated with dysplasia [aOR 7.16, 95% CI 1.75-29.28], and FadA and Fusobacteriales were associated with a decreased dysplasia risk in UC [aOR 0.23, 95% CI 0.06-0.83, p <0.01].

Conclusions: Biofilms are a hallmark of UC; however, because of their high prevalence are a poor biomarker for dysplasia. In contrast, colibactin presence and FadA absence independently associate with dysplasia in UC and might therefore be valuable biomarkers for future risk stratification and intervention strategies.

Keywords: Microbiology; biomarkers; pathology.


Conflict of interest statement

The authors declare no conflicts of interest.

Figures

Graphical Abstract
Graphical Abstract
Figure 1.
Figure 1.
Study workflow from inclusion to collection of data and samples to analysis.
Figure 2.
Figure 2.
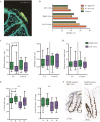
[A] Frequency of oncotraits FadA [green], ClbB [orange], BFT [blue], and Eae [red] in 59 UC patients [B] and 25 controls [C]. Set size represents n patients detected with each oncotrait. Intersection size depicts the number of patients with the combinations of oncotraits [dark blue circles] on the y-axis.
Figure 3.
Figure 3.
Biofilms and cell proliferation in ascending and descending colon biopsies. [A] Example of a bacterial biofilm spanning two colonic crypts in an ulcerative colitis [UC] patient. Cyan = nuclear staining [DAPI], yellow = Eubacteria staining [eub338]. [B] Prevalence of biofilms in ascending and descending colon biopsies at study colonoscopy in controls [n = 34 any, n = 33 ascending, and n = 34 descending biopsies], low-risk[n = 40 any, n = 41 ascending, and n = 40 descending biopsies], and high-risk UC patients [n = 36 any, 37 ascending, and 36 descending biopsies]. [C] Average biofilm thickness [µm] and biofilm length [µm] separated by left- and right-sided colon biopsies in UC patients [left: n = 26; right: n = 34] and controls [left: n = 11; right: n = 15]. Right-sided colon = green, left-sided colon = blue. [D] Average mucus depth measured on PAS-stained right- [n = 16 control, n = 59 UC; green] and left-sided [n = 17 control, n = 51 UC; blue] colon biopsies.[E] Number of cells per crypt and number of ki67-positive cells per crypt in biofilm-positive [dotted boxplots] and biofilm-negative [plain boxplots] in UC patients separated by right- [green][n = 19] and left-sided [n = 22] colon [blue]. N = no biofilm, B = biofilm. [F] Representative pictures of ki-67 staining [brown] in biofilm-negative right colon and biofilm-positive right colon of one UC patient. Mann-Whitney U-test was performed for biofilm thickness and length, and mucus thickness; Independent Students t test was performed for number of cells per crypt and number of ki67-positive cells per crypt of biofilm vs no biofilm.
Figure 4.
Figure 4.
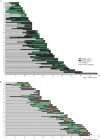
Longitudinal biofilms in patients with and without dysplasia. [A] Ulcerative colitis [UC] patients without dysplasia [n = 38], and [B] UC patients with dysplasia [n = 27]. For each patient left [L] and right-sided [R] colonoscopies are displayed with disease duration on the x-axis. Data are sorted based on disease duration. Green bars represent biofilm-positive episodes, black bars represent biofilm-negative episodes, red squares indicate episodes with dysplasia present.
Figure 5.
Figure 5.
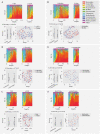
Metagenomic shotgun sequencing of healthy-appearing colon ascendens [right] and descendens [left] in ulcerative colitis [UC] and control patients. Bacterial composition displayed at the order level with Shannon diversity [S. diversity]. Samples were sorted by their correlation to the group’s mean composition. [A] UC [n = 80] vs control [n = 32] patients [three controls failed metagenomics sequencing due to low DNA quality]. [B] No biofilm vs biofilm of UC and control patients. [C] Left vs right colon of UC patients. [D] Biofilms in UC vs control patients. [E] High- [1] vs low- [0] risk UC patients in general. [F] Biofilms in high-risk vs low-risk UC patients.

References

    1. Alatab S, Sepanlou SG, Ikuta K, et al. The global, regional, and national burden of inflammatory bowel disease in 195 countries and territories, 1990–2017: A systematic analysis for the global burden of disease study 2017. Lancet Gastroenterol Hepatol 2020;5:17–30. - PMC - PubMed
    1. Jess T, Rungoe C, Peyrin-Biroulet L.. Risk of colorectal cancer in patients with ulcerative colitis: A meta-analysis of population-based cohort studies. Clin Gastroenterol Hepatol 2012;10:639–45. - PubMed
    1. Lutgens MW, van Oijen MG, van der Heijden GJ, Vleggaar FP, Siersema PD, Oldenburg B.. Declining risk of colorectal cancer in inflammatory bowel disease: An updated meta-analysis of population-based cohort studies. Inflamm Bowel Dis 2013;19:789–99. - PubMed
    1. Burke KE, Nayor J, Campbell EJ, Ananthakrishnan AN, Khalili H, Richter JM.. Interval colorectal cancer in inflammatory bowel disease: The role of guideline adherence. Dig Dis Sci 2020;65:111–8. - PMC - PubMed
    1. Wintjens DSJ, Bogie RMM, van den Heuvel TRA, et al. Incidence and classification of postcolonoscopy colorectal cancers in inflammatory bowel disease: A Dutch population-based cohort study. J Crohns Colitis 2018;12:777–83. - PubMed