. 2023 Jun 27;42(6):112525.
doi: 10.1016/j.celrep.2023.112525. Epub 2023 May 26.

Systemic alterations in neutrophils and their precursors in early-stage chronic obstructive pulmonary disease

Affiliations

Systemic alterations in neutrophils and their precursors in early-stage chronic obstructive pulmonary disease

Theodore S Kapellos et al. Cell Rep. .

Abstract

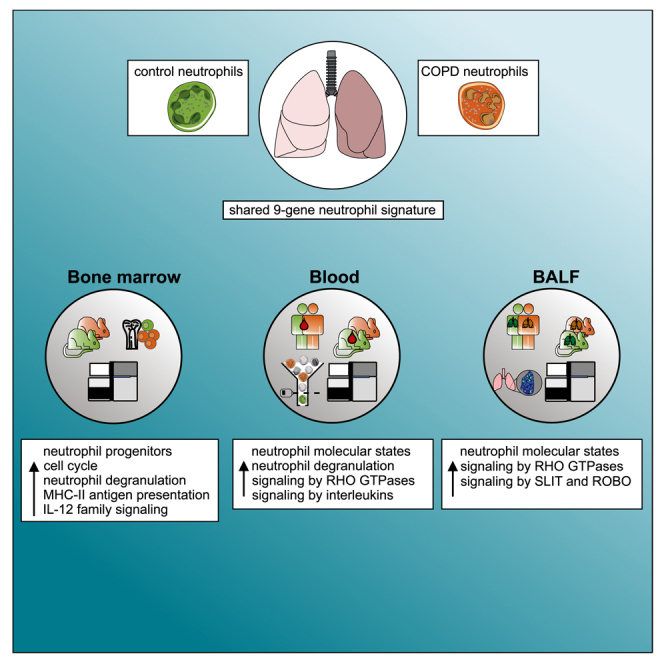
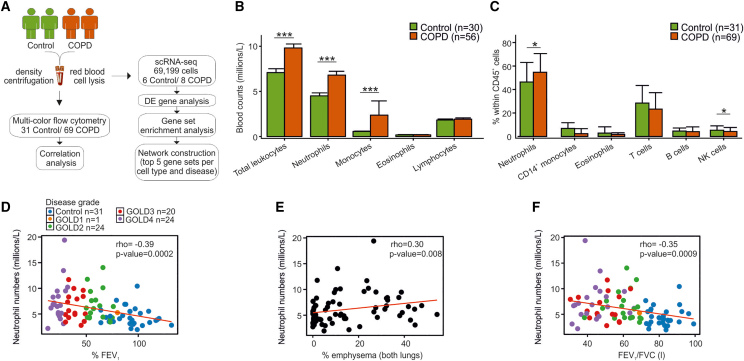
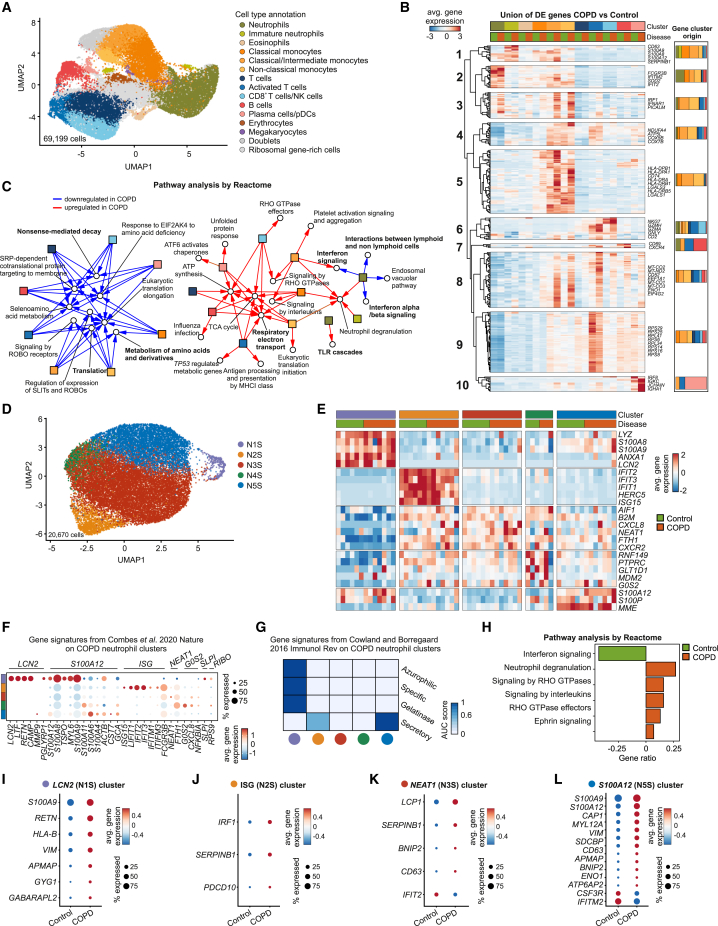
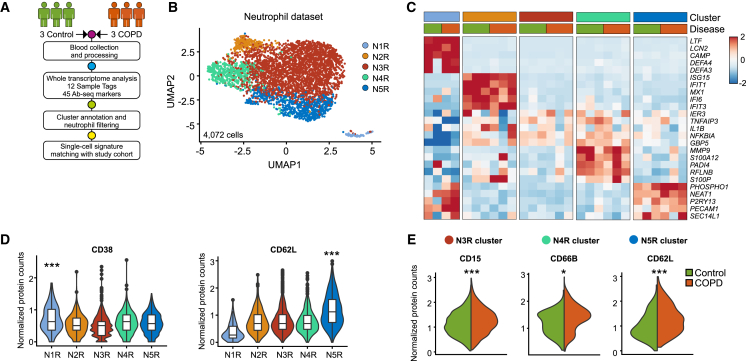
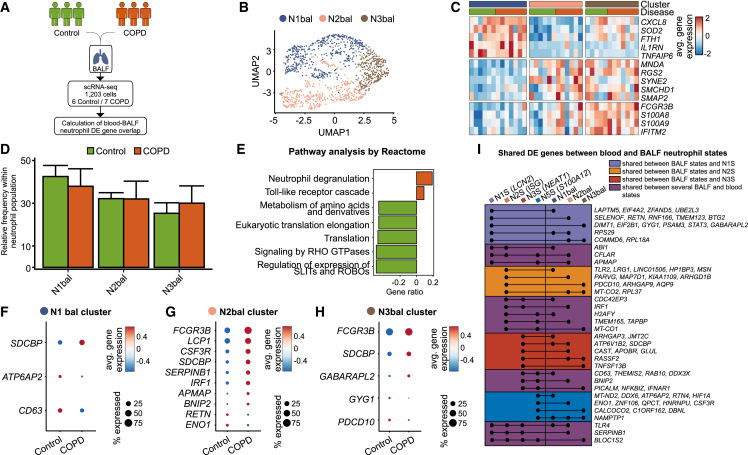
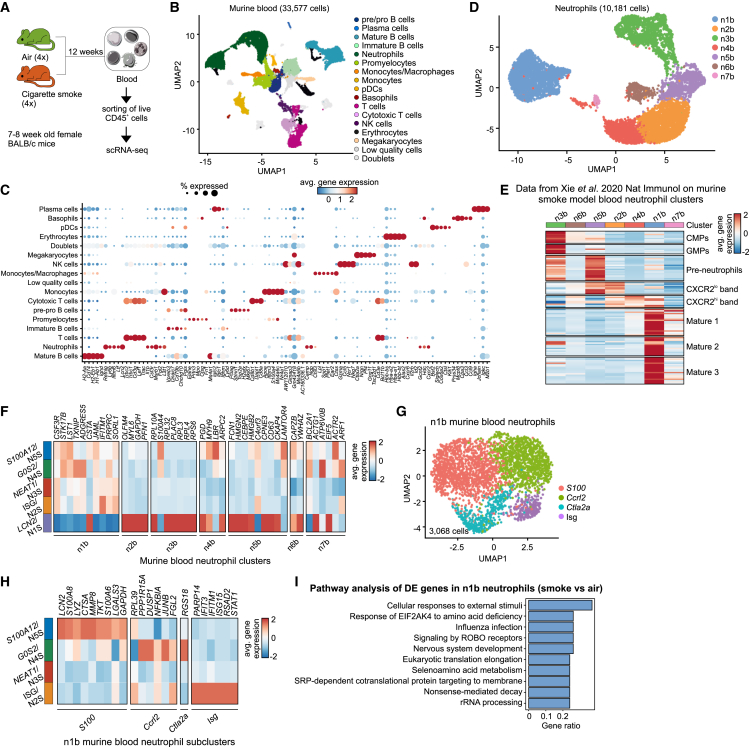
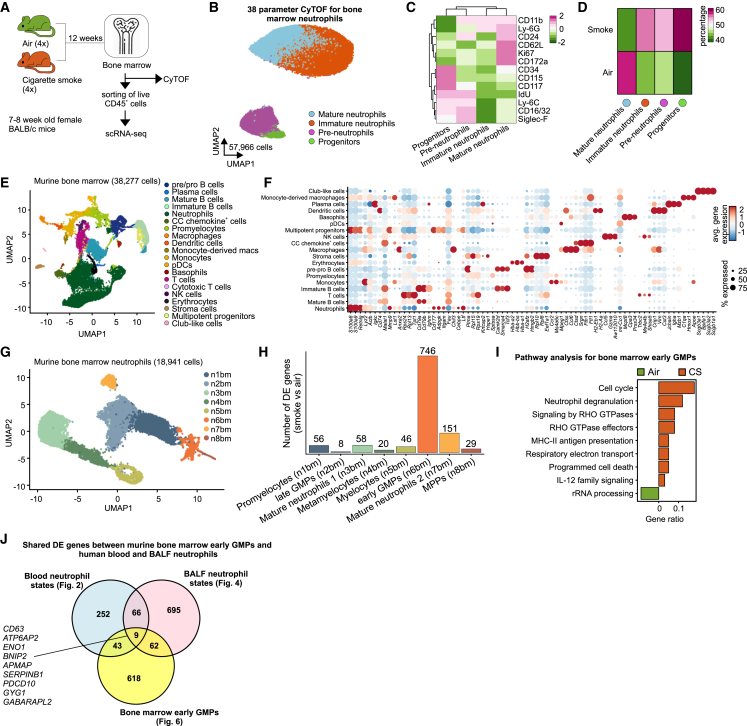
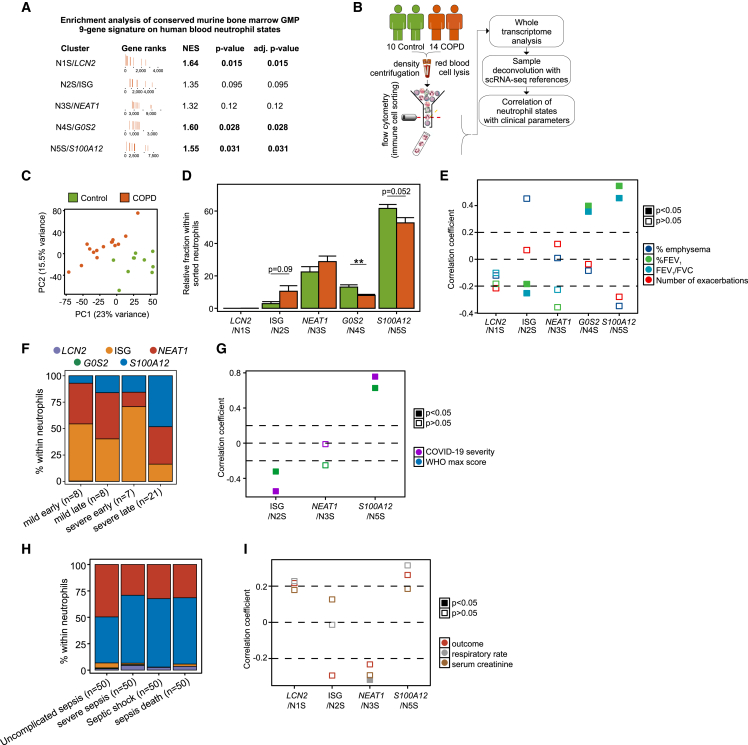
Systemic inflammation is established as part of late-stage severe lung disease, but molecular, functional, and phenotypic changes in peripheral immune cells in early disease stages remain ill defined. Chronic obstructive pulmonary disease (COPD) is a major respiratory disease characterized by small-airway inflammation, emphysema, and severe breathing difficulties. Using single-cell analyses we demonstrate that blood neutrophils are already increased in early-stage COPD, and changes in molecular and functional neutrophil states correlate with lung function decline. Assessing neutrophils and their bone marrow precursors in a murine cigarette smoke exposure model identified similar molecular changes in blood neutrophils and precursor populations that also occur in the blood and lung. Our study shows that systemic molecular alterations in neutrophils and their precursors are part of early-stage COPD, a finding to be further explored for potential therapeutic targets and biomarkers for early diagnosis and patient stratification.

Keywords: CP: Immunology; blood; bone marrow; chronic obstructive pulmonary disease; granulopoiesis; neutrophil; single-cell transcriptomics.


Conflict of interest statement

Declaration of interests The authors have no competing interests.

Figures

None
Graphical abstract
Figure 1
Figure 1
Immune-cell-specific transcriptomic signatures in the blood of control and COPD patients (A) Sample collection and processing pipeline. (B) Bar plot of absolute immune cell counts in the blood of 30 control and 56 COPD patients. Data are represented as the mean ± SD and statistical analysis was carried out with a Wilcoxon test, ∗∗∗p < 0.001. (C) Bar plot of immune cell proportions in the blood of 31 control and 69 COPD patients analyzed by flow cytometry. Data are represented as the mean ± SD and analysis was carried out with a two-tailed t test (neutrophils) or a Wilcoxon test (monocytes, eosinophils, T cells, B cells, NK cells) for non-normally distributed data, p < 0.05. (D–F) Spearman correlation analysis of blood neutrophil counts with (D) percentage forced expiratory volume in 1 s (% FEV1), (E) percentage emphysema in both lungs, and (F) FEV1/FVC ratio. Color code depicts the stratification of COPD patients according to the Global Initiative for Chronic Obstructive Lung Disease (GOLD) guidelines.
Figure 2
Figure 2
Blood neutrophils are transcriptionally heterogeneous in control and COPD patients (A) UMAP (Uniform Manifold Approximation and Projection) representation of 69,199 blood cells from six control and eight COPD patients. Cell clusters were annotated using published canonical gene markers and using label transfer from the GenSigPro classifier. (B) Heatmap of the union of differentially expressed (DE) genes between control and COPD patients for immune cells. Each column represents the scaled average normalized expression per cell type and disease status. Hierarchical clustering grouped the genes in 10 clusters. The bar plots indicate cluster gene cellular origin. (C) Network of the top 5 enriched Reactome gene sets in control or COPD patients. Red arrows depict terms upregulated in COPD, blue arrows terms downregulated in COPD. In bold are gene sets mentioned in the text. (D) UMAP representation of 20,670 neutrophils from the blood of six control and seven COPD patients. (E) Heatmap of the top 5 markers for each neutrophil state. Each column represents the average scaled normalized expression per patient. (F) Dot plot with markers from blood neutrophil states from Combes et al. Circle size represents the percentage of cells within a cluster that express a particular gene, circle color shows average scaled normalized gene expression within the cluster. (G) Single-cell enrichment analysis of neutrophil granule proteins from Cowland and Borregaard. Color depicts the scaled average area under the curve score of all cells within the respective neutrophil state. (H) Gene set enrichment analysis of blood neutrophil DE genes between control and COPD patients using the Reactome database. (I–L) Dot plots of DE genes in (I) N1S/LCN2, (J) N2S/ISG, (K) N3S/NEAT1, and (L) N5S/S100A12 blood neutrophil states between control and COPD patients. Circle size represents the percentage of cells within a cluster that express a particular gene, circle color shows average gene expression within the cluster.
Figure 3
Figure 3
Neutrophil transcriptional states from control and COPD patients correspond to distinct phenotypes (A) Experimental design and analysis pipeline. (B) UMAP representation of 4,072 neutrophils from three controls and three COPD patients. (C) Heatmap of the top 5 marker genes for each neutrophil state. Each column represents the scaled average normalized expression per patient. (D) Violin plots of neutrophil state-specific protein markers. (E) Violin plots of differentially expressed protein markers between control and COPD patients for blood neutrophil states. Statistical analysis was performed with the MAST algorithm, p < 0.05, ∗∗∗p < 0.001.
Figure 4
Figure 4
Bronchoalveolar neutrophils are transcriptionally heterogeneous in control and COPD patients (A) Experimental design and analysis pipeline. (B) UMAP representation of 1,203 neutrophils from the bronchoalveolar fluid (BALF) of six control and seven COPD patients. (C) Heatmap of the top 5 marker genes for each BALF neutrophil state. Each column represents the scaled average normalized expression per patient. (D) Bar plot of BALF neutrophil state frequencies in control and COPD patients. (E) Gene set enrichment analysis of BALF neutrophil differentially expressed (DE) genes between control and COPD patients using the Reactome database. (F–H) Dot plots of DE genes in (F) N1bal, (G) N2bal, and (H) N3bal BALF neutrophil states between control and COPD patients. Circle size represents the percentage of cells within a cluster that express a particular gene; circle color shows average gene expression within the cluster. (I) Modified upset plot depicting the shared DE genes (COPD vs. control) between peripheral blood and BALF neutrophil states.
Figure 5
Figure 5
A murine model of cigarette smoke (CS)-induced COPD recapitulates the human blood neutrophil population structure (A) Experimental design and sample processing. (B) UMAP representation of 33,577 CD45+ cells from the blood of four air- and four CS-exposed mice. (C) Dot plot of top 5 differentially expressed (DE) genes for each identified blood neutrophil cluster against the rest. Circle size represents the percentage of cells within a cluster that express a particular gene, circle color shows average gene expression within the cluster. (D) UMAP representation of 10,181 blood neutrophils from four air- and four CS-exposed mice. (E) Heatmap of the top 20 unique genes from the n1b murine blood neutrophil population from the Xie et al. data on the blood neutrophil states of this study. (F) Heatmap of the top 20 unique murine blood neutrophil genes for the human neutrophil states from Figure 2. Murine genes were first converted to their human homologs. (G) UMAP representation of 3,068 mature blood neutrophils from this study. (H) Heatmap of the top 20 unique murine blood neutrophil state genes for the mature human neutrophil states from Figure 2. Murine genes were first converted to their human homologs. (I) Gene set enrichment analysis of DE genes between air- and smoke-exposed mice in the blood n1b neutrophil state using the Reactome database.
Figure 6
Figure 6
Smoke inhalation induces activation of neutrophil progenitors in the bone marrow (A) Experimental design and sample processing. (B) UMAP visualization of 57,966 bone marrow neutrophils from air- and cigarette smoke (CS)-exposed mice acquired with 38-parameter mass cytometry (CyTOF). (C) Heatmap of selected marker expression in bone marrow neutrophil metaclusters. Each column represents the scaled average normalized expression per neutrophil metacluster. (D) Heatmap of bone marrow neutrophil metacluster proportions in air- and CS-exposed animals. (E) UMAP representation of 38,277 CD45+ cells from the bone marrow of four air- and four CS-exposed mice. (F) Dot plot of top 5 differentially expressed (DE) genes for each identified bone marrow neutrophil cluster against the rest. Circle size represents the percentage of cells within a cluster that express a particular gene, and circle color shows average gene expression within the cluster. (G) UMAP representation of 18,941 bone marrow neutrophils from four air- and four CS-exposed mice. (H) Number of DE genes of all bone marrow neutrophil clusters between CS- and air-exposed mice. (I) Pathway analysis of early granulocyte-monocyte progenitor (GMP) DE genes between air- and CS-exposed mice using the Reactome database. (J) Venn diagram showing the overlap of murine bone marrow DE genes between air- and CS-exposed mice with human blood and BALF neutrophil states between control and COPD patients. Murine genes were first converted to their human homologs.
Figure 7
Figure 7
Abundance of neutrophil states associates with COPD clinical traits (A) Enrichment analysis of the conserved nine-gene differentially regulated gene signature in murine bone marrow granulocyte-monocyte progenitors (GMPs) on human neutrophil states from control and COPD patients. (B) Sample collection and processing pipeline. (C) Principal-component analysis of 17,127 present genes in the dataset for blood neutrophils from 10 control and 15 COPD patients. (D) In silico deconvolution of 10 control and 15 COPD sorted neutrophil whole-transcriptome samples with single-cell signatures from the study cohort. Data analysis was carried out with a two-tailed t test (N5S/S100A12, N3S/NEAT1) or a Wilcoxon signed rank test (N1S/LCN2, N2S/ISG, N4S/G0S2) for non-normally distributed data. (E) Correlation analysis of neutrophil state (N1S/LCN2, N2S/ISG, N3S/NEAT1, N4S/G0S2, N5S/S100A12) abundance with emphysema, % FEV1, FEV1/FVC ratio, and number of exacerbations using mixed models adjusted for age, sex, and inhaled corticosteroid treatment. Filled boxes indicate significant (p < 0.05) correlation. (F) In silico deconvolution of 44 granulocyte whole-transcriptome samples from COVID-19 patients from EGAS00001004503 with single-cell signatures from the study cohort. (G) Correlation analysis of neutrophil state (N2S/ISG, N3S/NEAT1, N5S/S100A12) abundance with severity and maximum WHO score using the Spearman test. (H) In silico deconvolution of 40 whole-transcriptome samples from sepsis patients from GSE63042 with single-cell signatures from the study cohort. (I) Correlation analysis of neutrophil state (N1S/LCN2, N2S/ISG, N3S/NEAT1 N5S/S100A12) abundance with sepsis outcome, respiratory rate, and serum creatinine using the Spearman test. Filled boxes indicate significant (p < 0.05) correlation.

Comment in

References

    1. Venkatesan P. GOLD COPD report: 2023 update. Lancet Respir. Med. 2023;11:18. doi: 10.1016/S2213-2600(22)00494-5. - DOI - PubMed
    1. Agustí A., Hogg J.C. Update on the pathogenesis of chronic obstructive pulmonary disease. N. Engl. J. Med. 2019;381:1248–1256. doi: 10.1056/NEJMra1900475. - DOI - PubMed
    1. Gan W.Q., Man S.F.P., Senthilselvan A., Sin D.D. Association between chronic obstructive pulmonary disease and systemic inflammation: a systematic review and a meta-analysis. Thorax. 2004;59:574–580. doi: 10.1136/thx.2003.019588. - DOI - PMC - PubMed
    1. Agustí A., Edwards L.D., Rennard S.I., MacNee W., Tal-Singer R., Miller B.E., Vestbo J., Lomas D.A., Calverley P.M.A., Wouters E., et al. Persistent systemic inflammation is associated with poor clinical outcomes in COPD: a novel phenotype. PLoS One. 2012;7 doi: 10.1371/journal.pone.0037483. - DOI - PMC - PubMed
    1. Fabbri L.M., Rabe K.F. From COPD to chronic systemic inflammatory syndrome? Lancet. 2007;370:797–799. doi: 10.1016/S0140-6736(07)61383-X. - DOI - PubMed

Publication types

LinkOut - more resources