. 2023 Jul:138:103061.
doi: 10.1016/j.jaut.2023.103061. Epub 2023 May 25.

Role of mitochondria in the myopathy of juvenile dermatomyositis and implications for skeletal muscle calcinosis

Affiliations

Role of mitochondria in the myopathy of juvenile dermatomyositis and implications for skeletal muscle calcinosis

Bhargavi Duvvuri et al. J Autoimmun. 2023 Jul.

Abstract

Objectives: To elucidate mechanisms contributing to skeletal muscle calcinosis in patients with juvenile dermatomyositis.

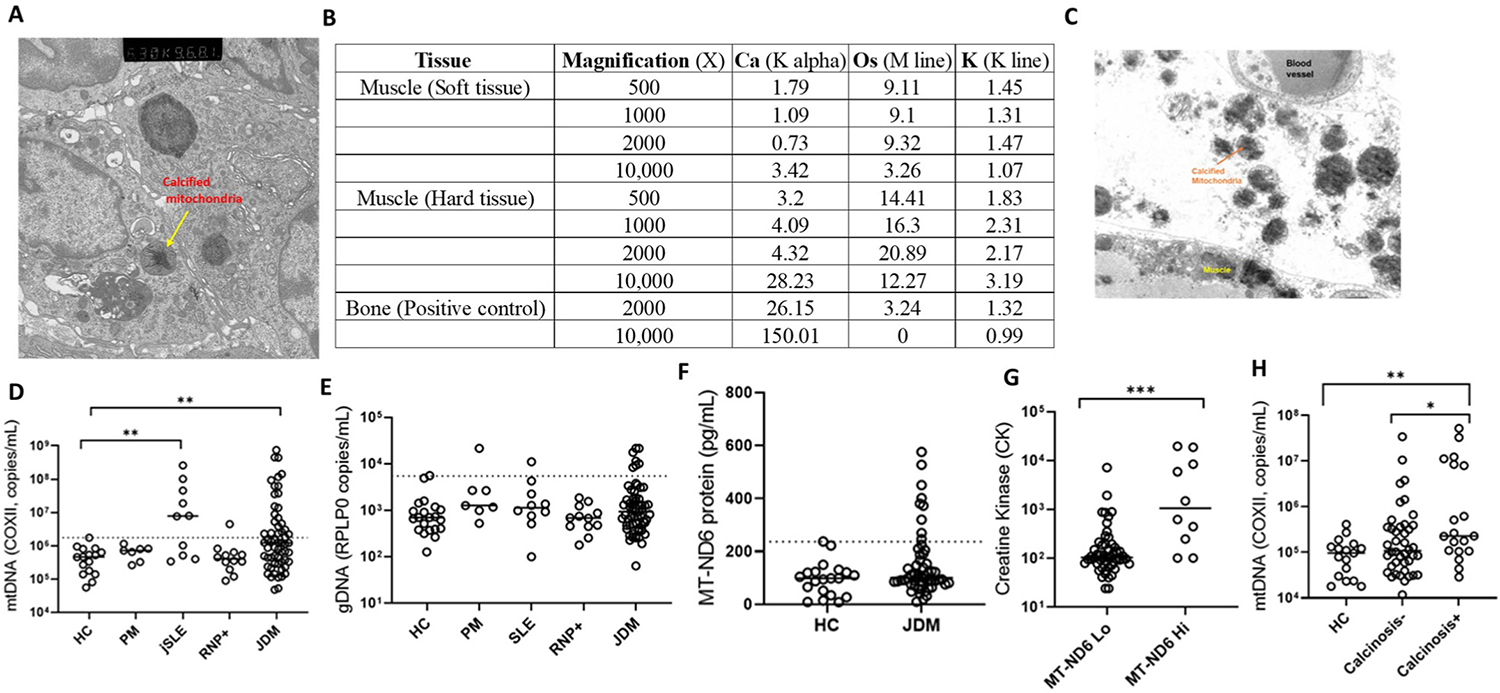
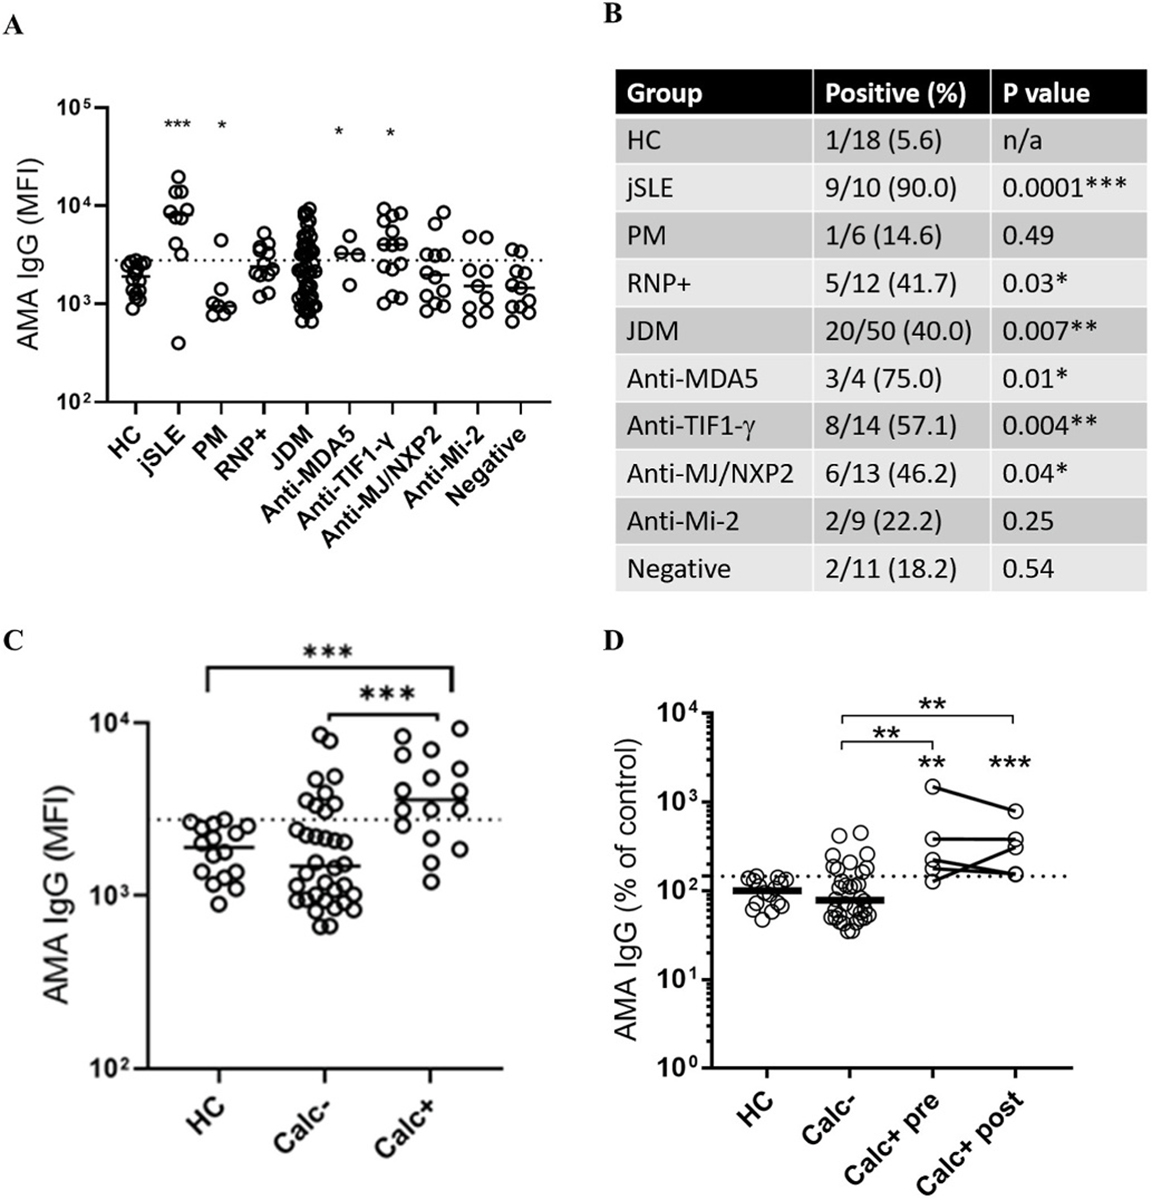
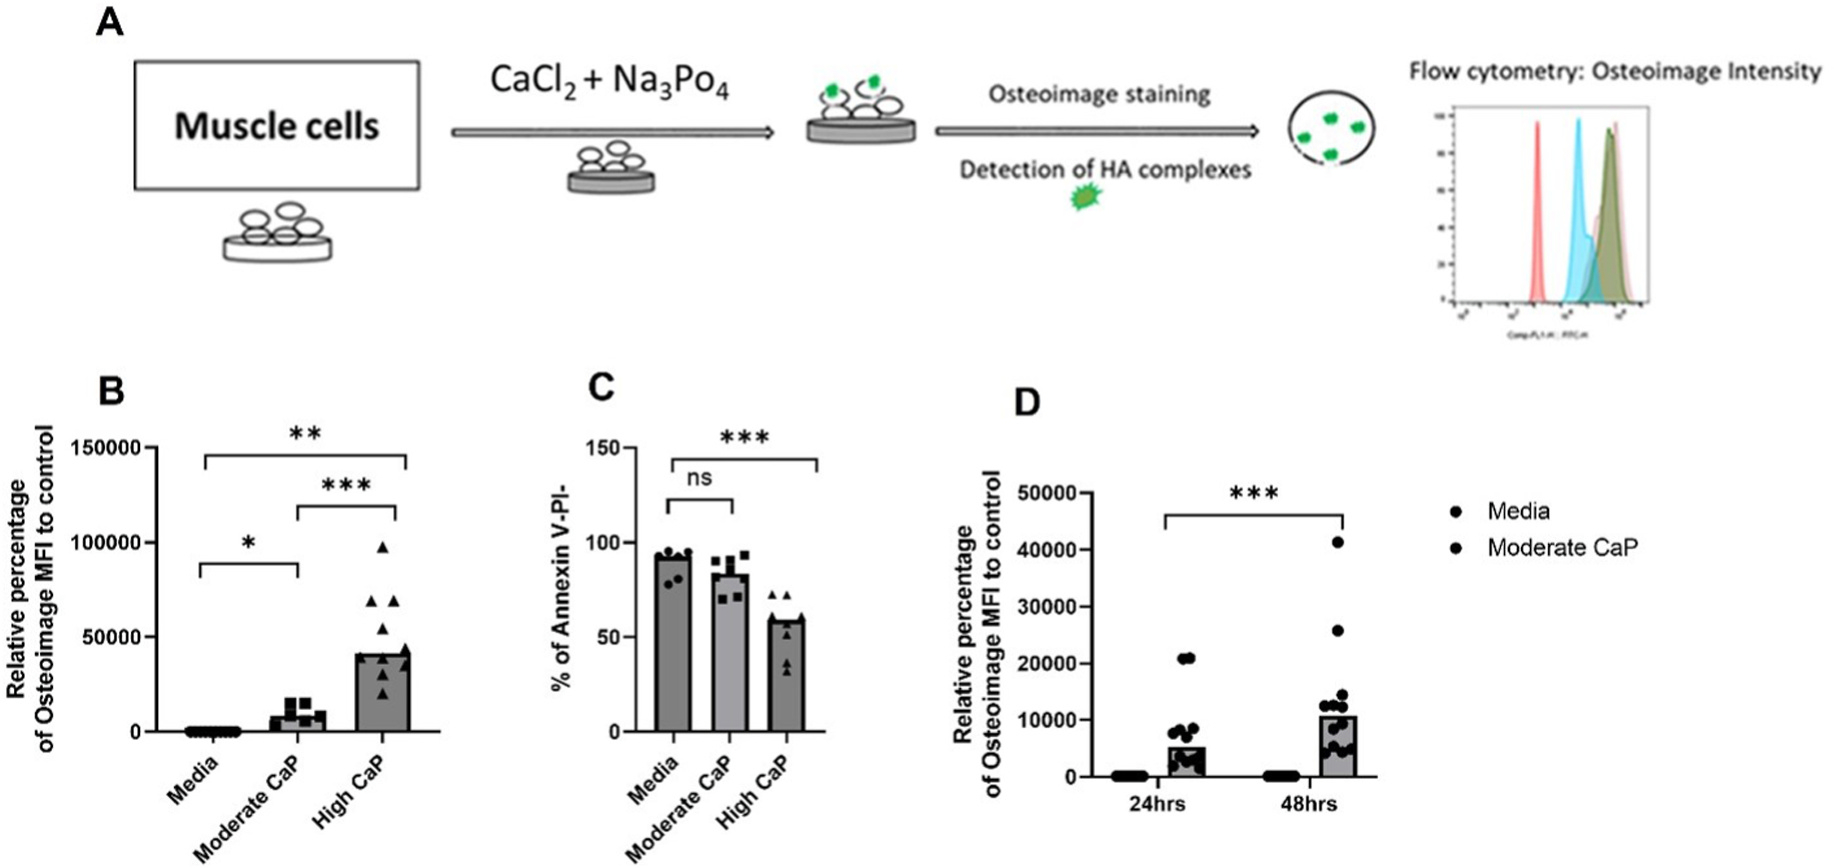
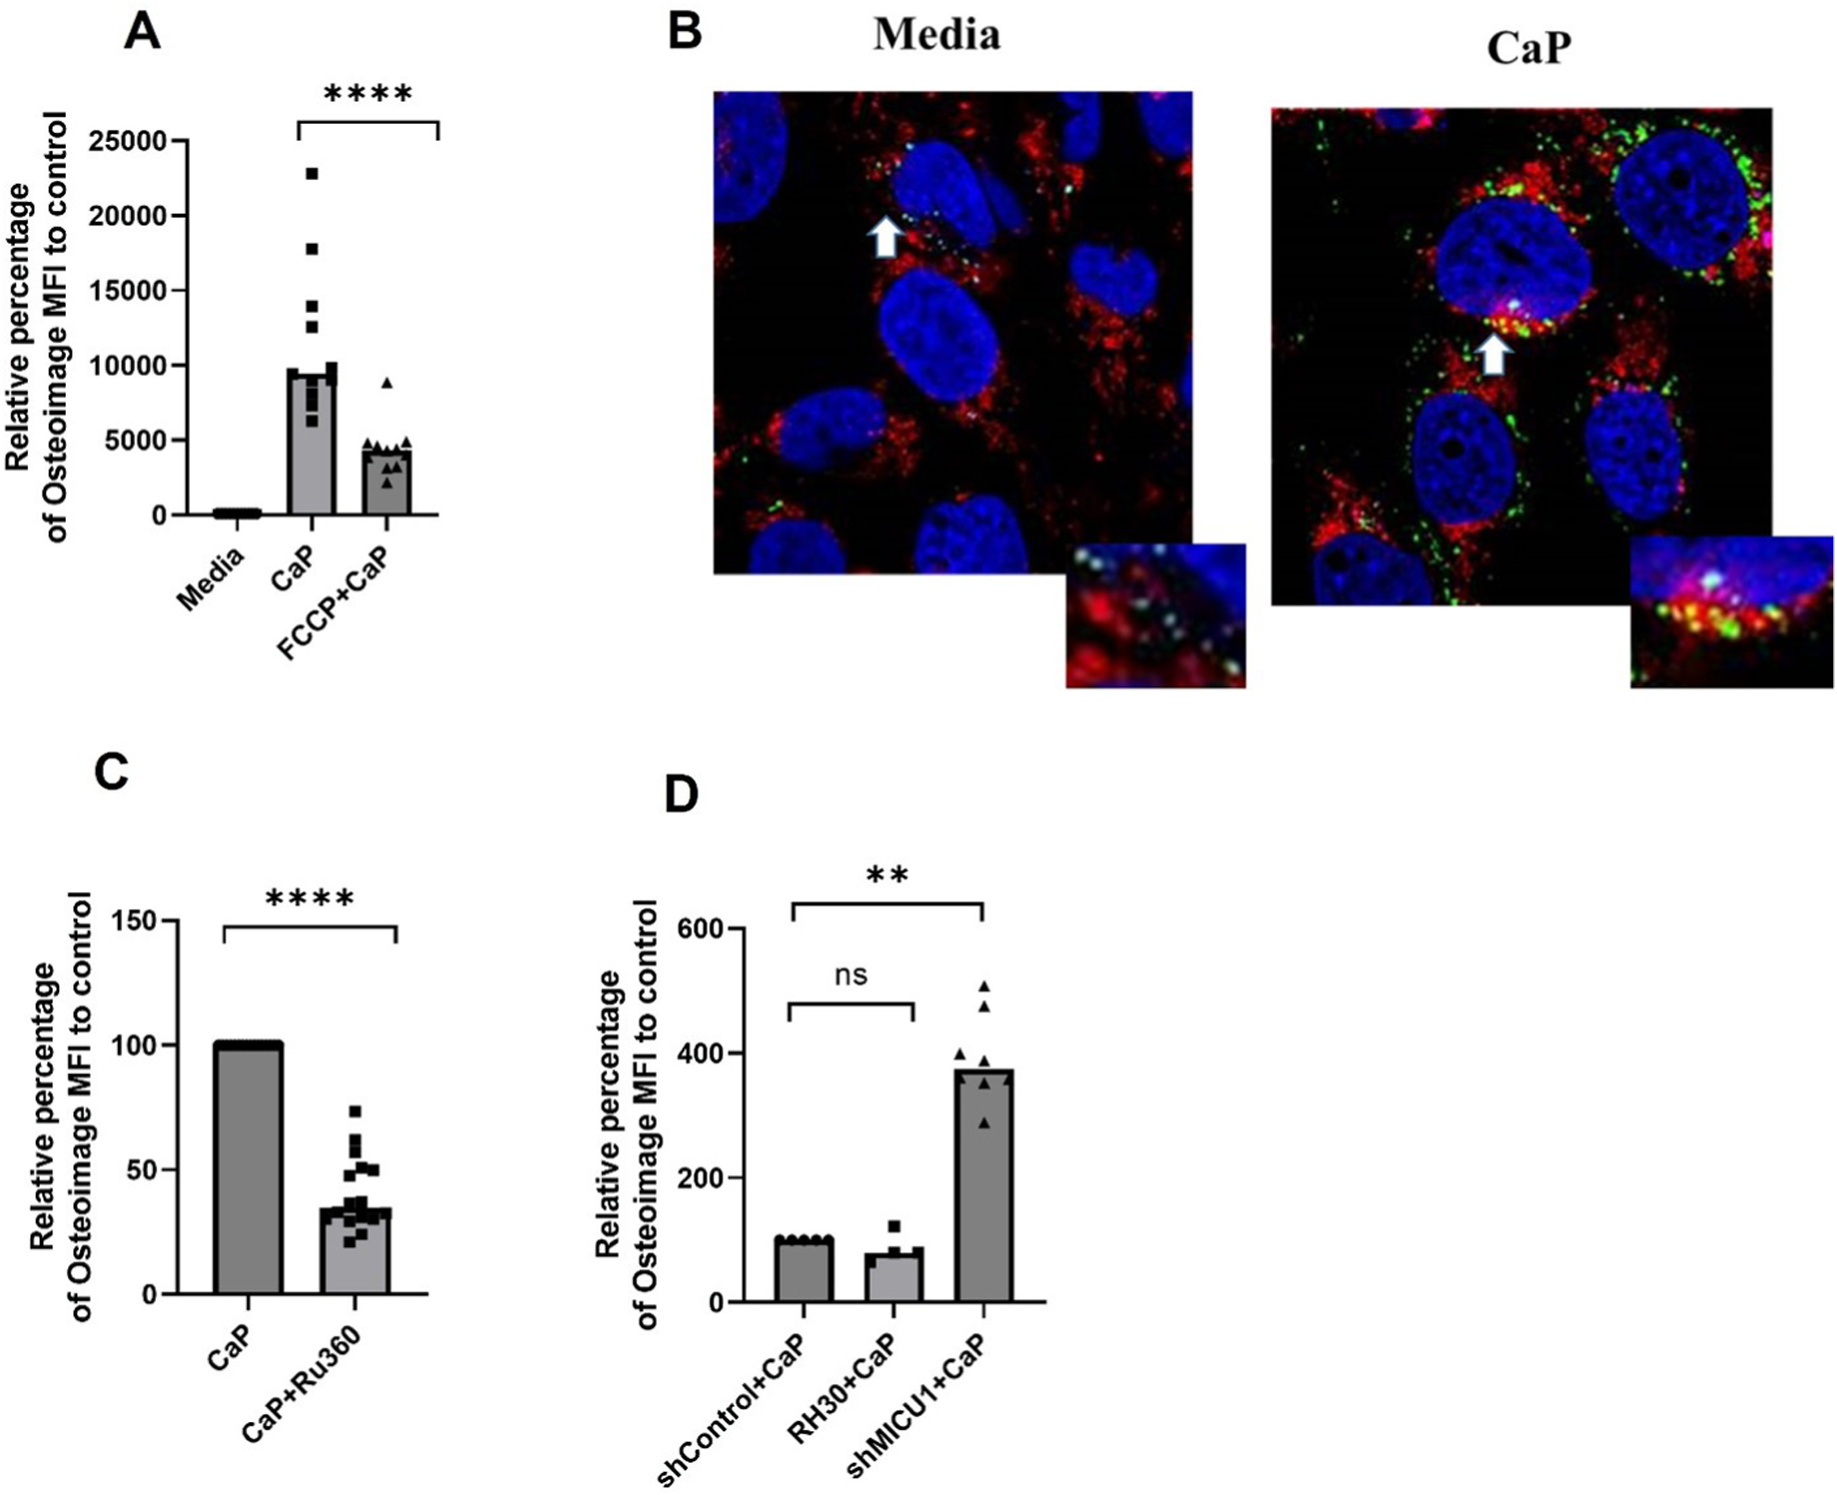
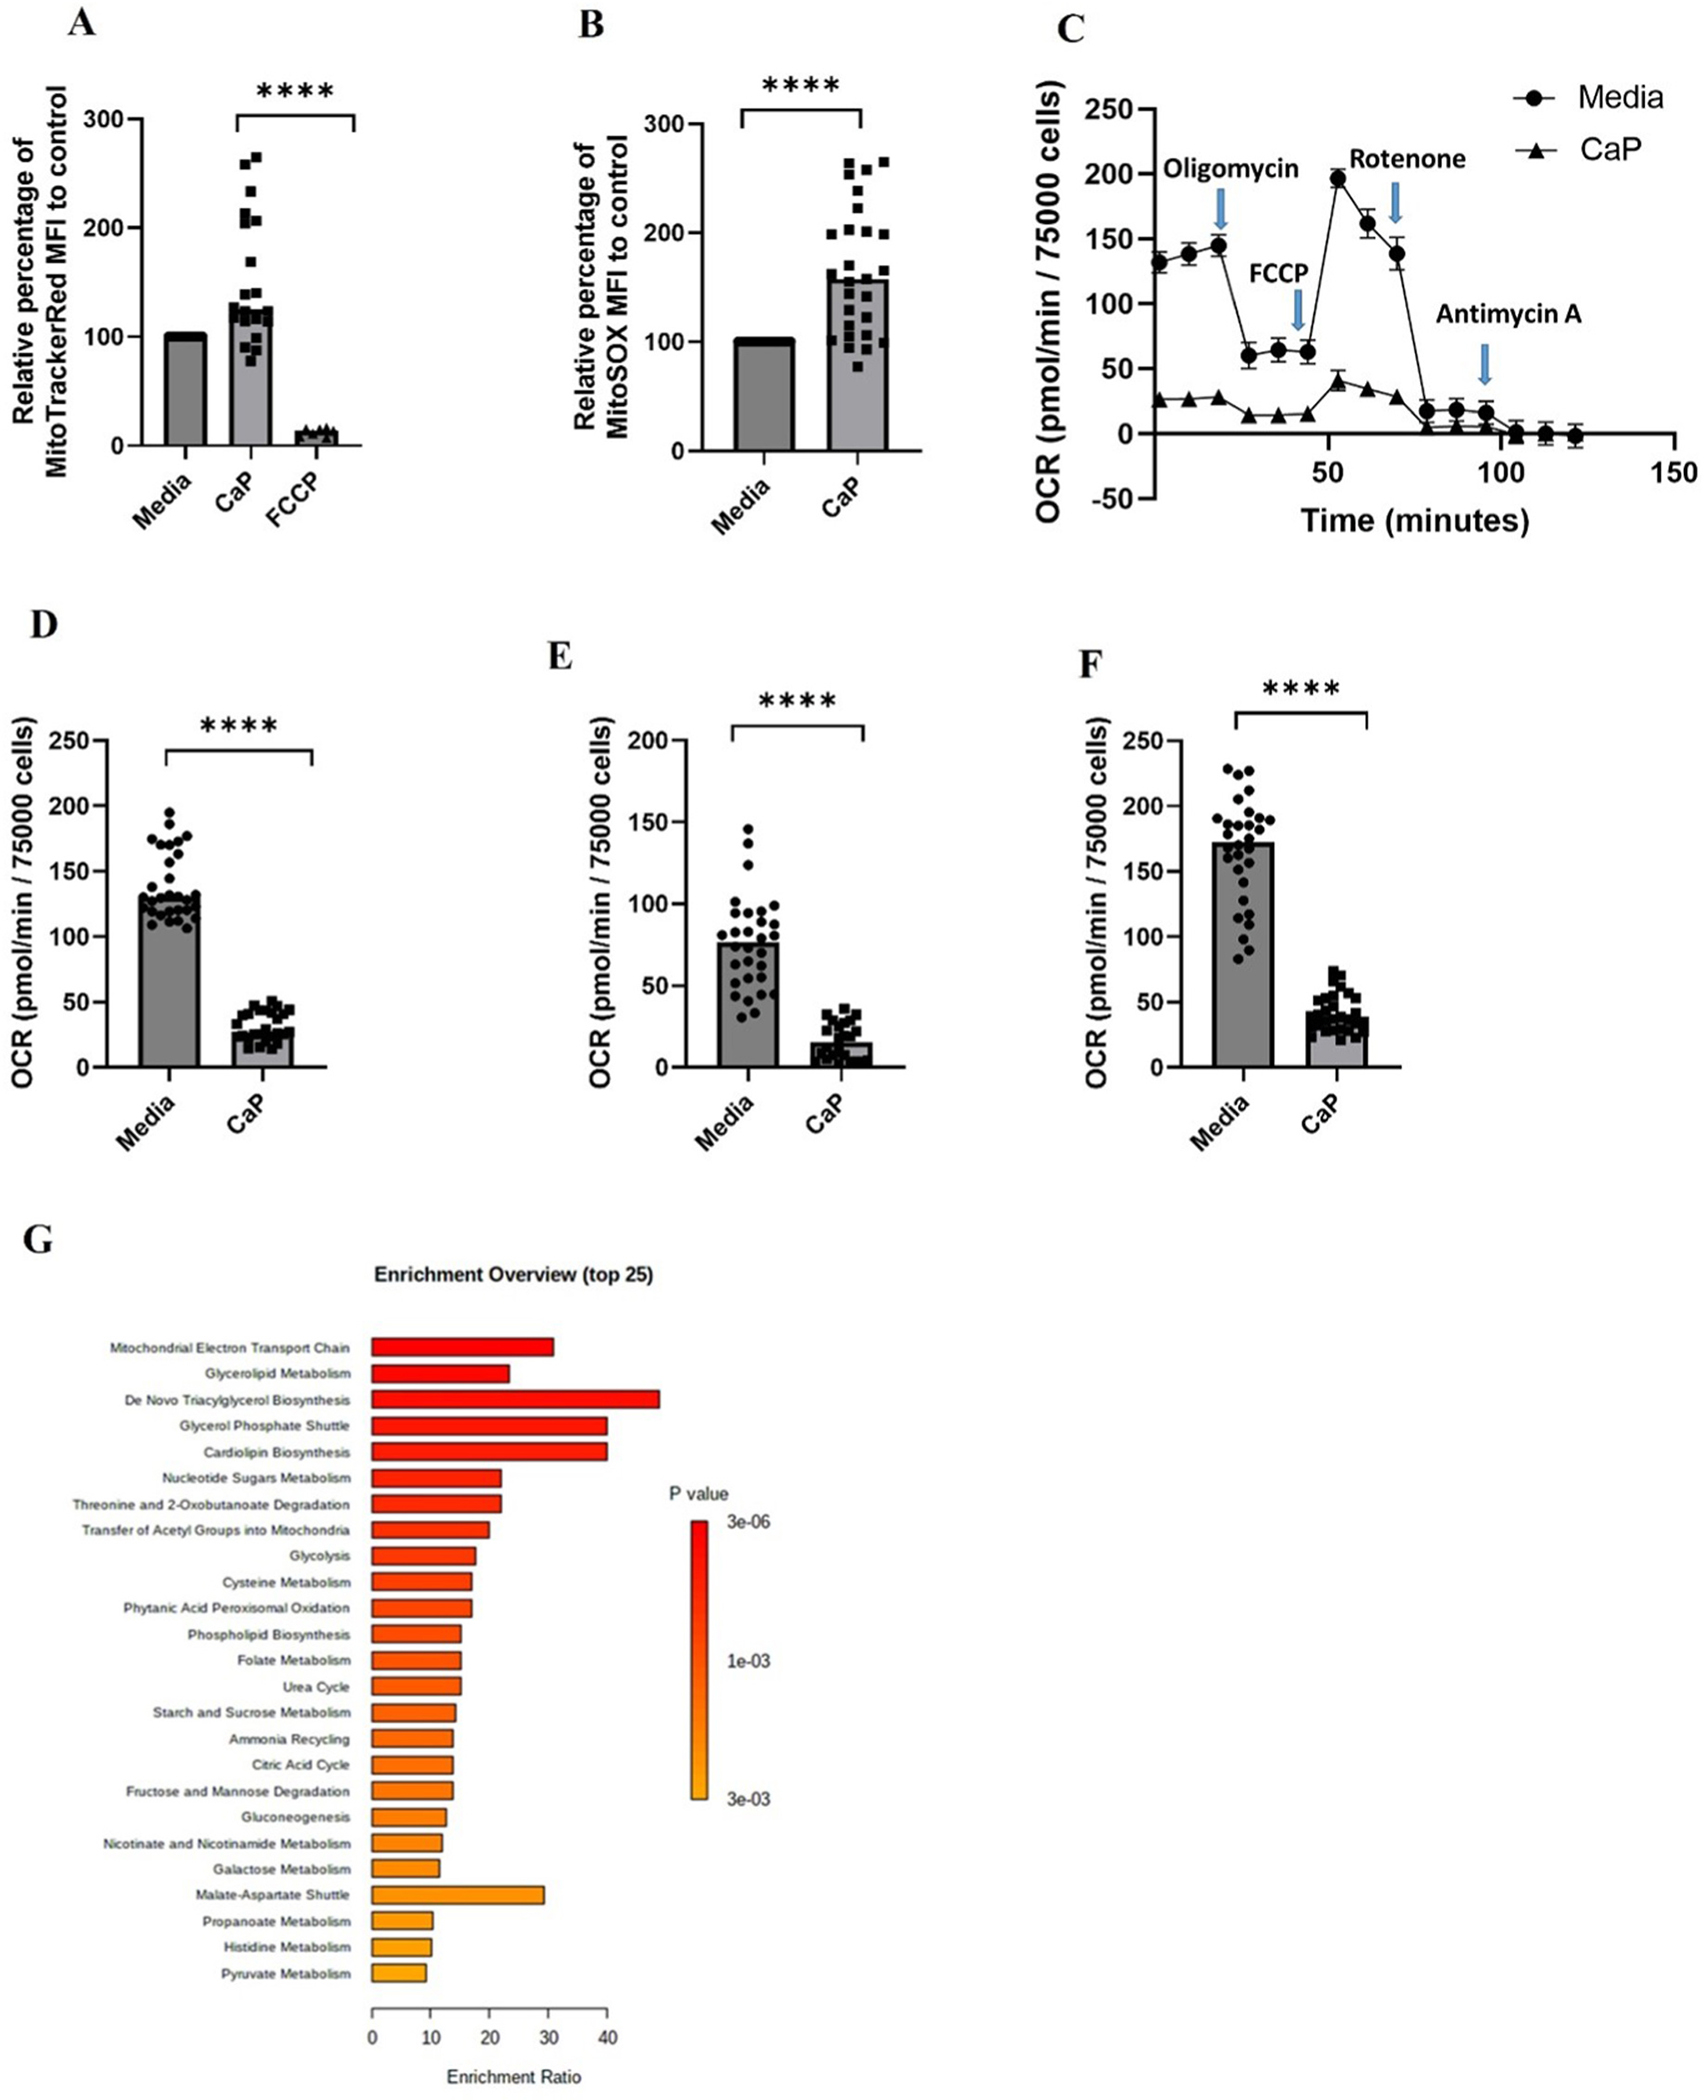
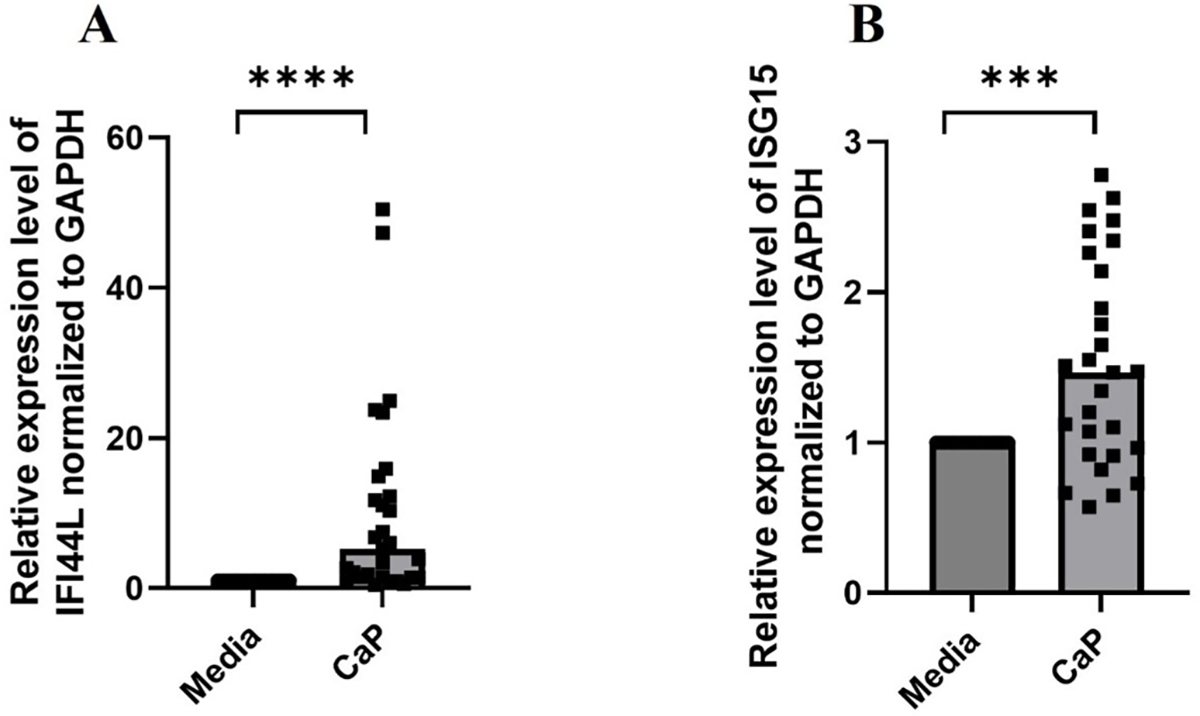
Methods: A well-characterized cohorts of JDM (n = 68), disease controls (polymyositis, n = 7; juvenile SLE, n = 10, and RNP + overlap syndrome, n = 12), and age-matched health controls (n = 17) were analyzed for circulating levels of mitochondrial (mt) markers including mtDNA, mt-nd6, and anti-mitochondrial antibodies (AMAs) using standard qPCR, ELISA, and novel-in-house assays, respectively. Mitochondrial calcification of affected tissue biopsies was confirmed using electron microscopy and energy dispersive X-ray analysis. A human skeletal muscle cell line, RH30, was used to generate an in vitro calcification model. Intracellular calcification is measured by flow cytometry and microscopy. Mitochondria were assessed for mtROS production and membrane potential by flow cytometry and real-time oxygen consumption rate by Seahorse bioanalyzer. Inflammation (interferon-stimulated genes) was measured by qPCR.

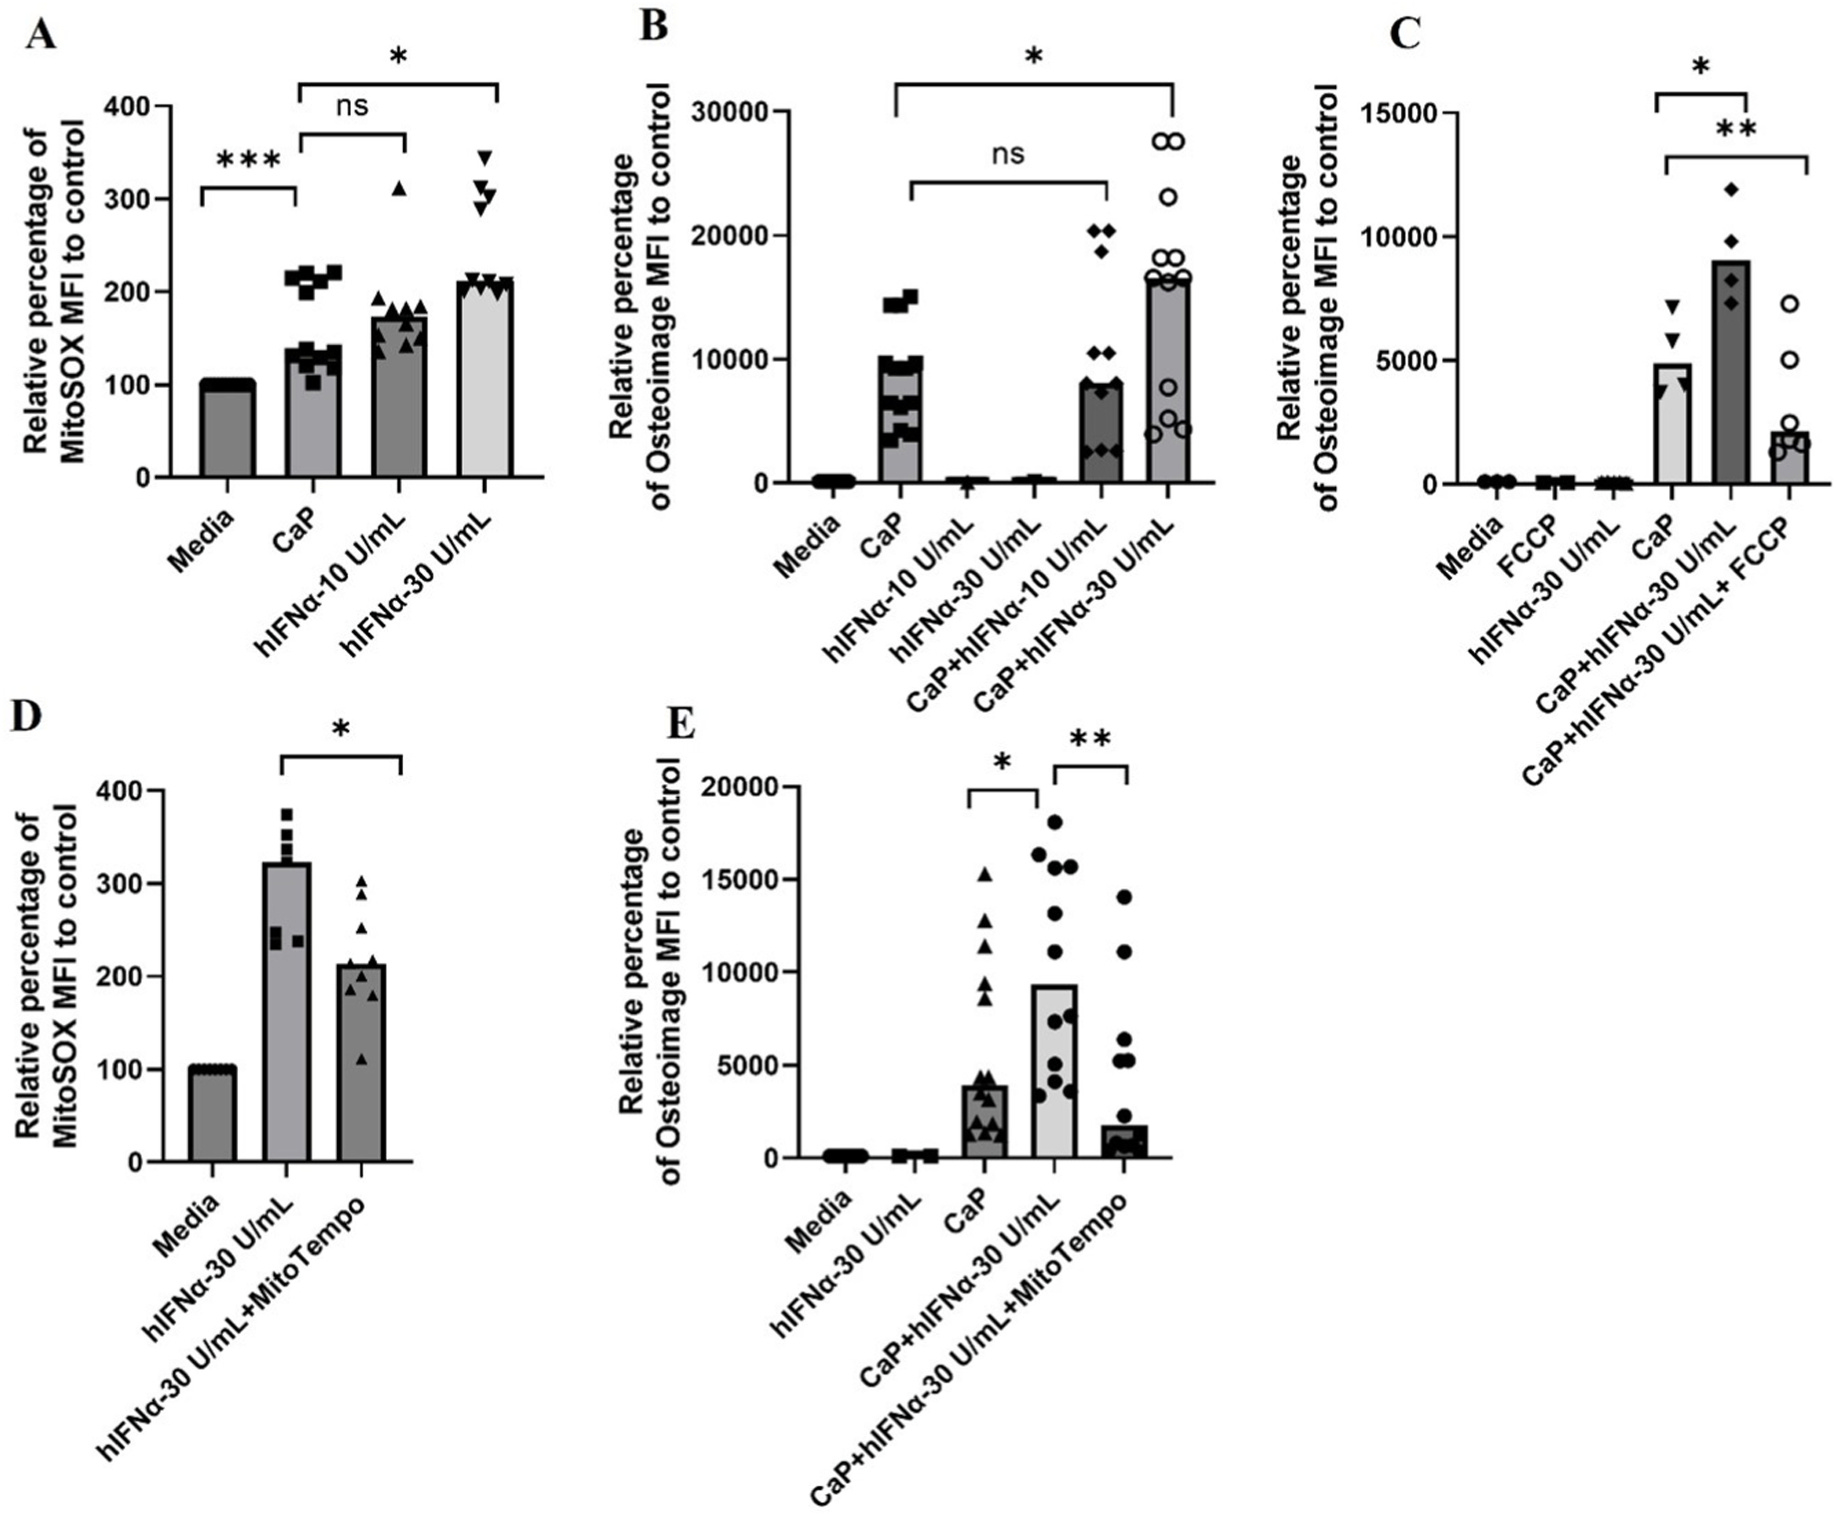
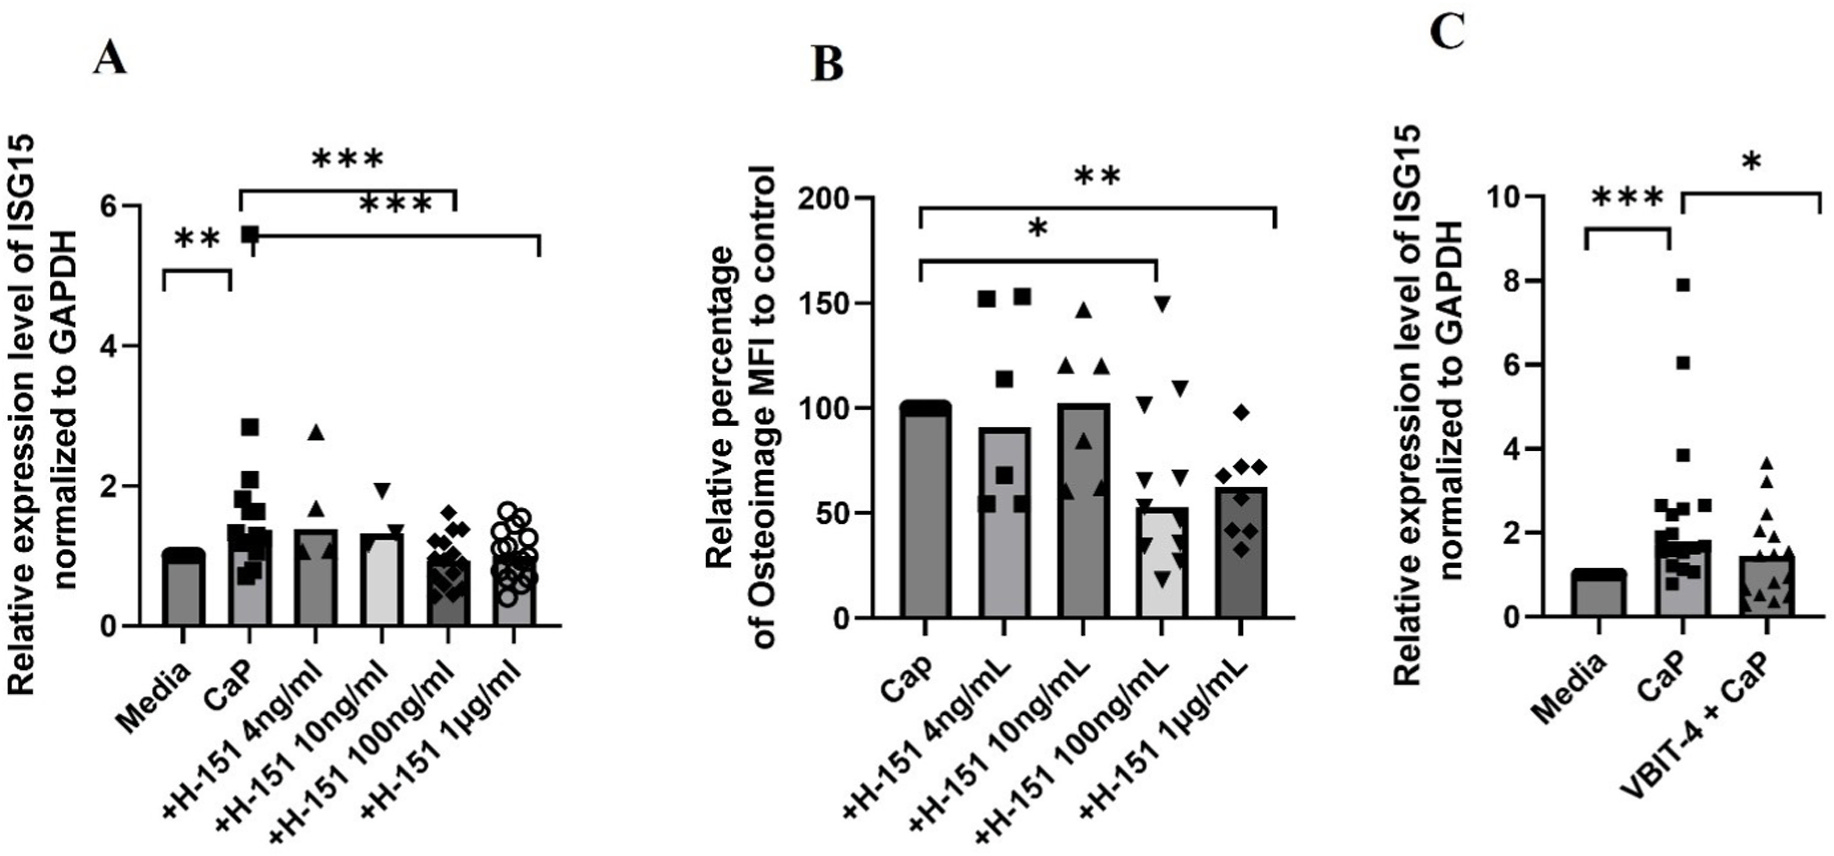
Results: In the current study, patients with JDM exhibited elevated levels of mitochondrial markers associated with muscle damage and calcinosis. Of particular interest are AMAs predictive of calcinosis. Human skeletal muscle cells undergo time- and dose-dependent accumulation of calcium phosphate salts with preferential localization to mitochondria. Calcification renders skeletal muscle cells mitochondria stressed, dysfunctional, destabilized, and interferogenic. Further, we report that inflammation induced by interferon-alpha amplifies mitochondrial calcification of human skeletal muscle cells via the generation of mitochondrial reactive oxygen species (mtROS).

Conclusions: Overall, our study demonstrates the mitochondrial involvement in the skeletal muscle pathology and calcinosis of JDM and mtROS as a central player in the calcification of human skeletal muscle cells. Therapeutic targeting of mtROS and/or upstream inducers, such as inflammation, may alleviate mitochondrial dysfunction, leading to calcinosis. AMAs can potentially identify patients with JDM at risk for developing calcinosis.

Keywords: Calcinosis; Interferon; Juvenile dermatomyositis; Mitochondria; Mitochondrial reactive oxygen species.


Conflict of interest statement

Declaration of competing interest None declared.

Figures

Fig. 1.
Fig. 1.
Mitochondria in JDM. (A) Electron microscopy image of degenerated muscle fiber with intracellular mitochondrial calcification. Yellow arrows: Calcified mitochondria with dense, elongated crystals. (B) EDAX mineral analysis to evaluate calcium content of mitochondria; soft tissue (patient muscle tissue without mineral deposits) and hard tissue (patient muscle tissue with mineralized mitochondria) and a positive control, bone (no mitochondria). K alpha: Calcium content; Os (osmium): Lipid content; K line: Total protein content. (C) Electron microscopy image demonstrating the presence of calcified mitochondria in the extracellular space in muscle tissue. qPCR analysis of plasma quantifying (D) mtDNA and (E) genomic DNA in different disease groups PM (n = 7), jSLE (n = 10), RNP + overlap syndrome (n = 12) and JDM (n = 60) compared to age-matched healthy controls (HC; n = 16). Dashed line indicates the 95th percentile of HC levels. (F) Plasma levels of MT-ND6 protein as measured by ELISA in JDM patients (n = 50) compared to age-matched healthy controls (n = 20). Dashed line indicates the 95th percentile of HCs. (G) Creatine Kinase level relative to MT-ND6 levels. MT-ND6 levels are grouped into Low (Lo, n = 54) and high (Hi, n = 10) based on 95th percentile of HC MT-MD6 levels as measured by ELISA. (H) Comparison of mtDNA levels in calcinosis − (n = 42), calcinosis + (n = 19) patients and healthy controls, HC (n = 17). All graphs: Median is shown. Statistical analysis: Non-parametric Mann-Whitney test. *p < 0.05, **p < 0.01, and ***p < 0.001. JDM, juvenile dermatomyositis, HC, age-matched healthy controls, PM, polymyositis, jSLE, juvenile systemic lupus erythematosus, RNP + overlap syndrome, ribonucleoprotein + overlap syndrome, MT-ND6, mitochondrial-NADH dehydrogenase 6, gDNA, genomic DNA, mtDNA, mitochondrial DNA.
Fig. 2.
Fig. 2.
Anti-mitochondrial antibodies in JDM are associated with calcinosis. Levels of anti-mitochondrial antibodies (AMA) were assessed using an in-house flow cytometry assay. (A) Comparison of AMA levels in healthy controls (HC), juvenile SLE (jSLE), polymyositis (PM), RNP + overlap syndrome, and juvenile dermatomyositis (JDM). Further stratification was done based on myositis-specific autoantibodies (MSA). Data are presented as (A) median fluorescence intensity (MFI)and (B) percent positive patients, based on 95th percentile of healthy controls (dotted line). (C) Patients were stratified based on prior history of calcinosis (Calc+) or not (Calc−) and assessed for AMA levels. (D) AMA levels measured in JDM patients without history of calcinosis (Calc−), as well as patients with history of calcinosis with blood samples taken either prior (Calc + pre) or after (Calc + post) clinical manifest calcification. All graphs: Median is shown. Statistical analysis: A and C: Non-parametric Mann-Whitney test. B: Chi2 test. D: Wilcoxon matched-pairs signed rank test. *p < 0.05, **p < 0.01, and ***p < 0.001. The ‘floating’ significance asterisks signify comparisons to healthy controls, whereas the lined significance compares the groups under the line.
Fig. 3.
Fig. 3.
Dose- and time-dependent increase in hydroxyapatite (HA) calcium phosphate complexes in human skeletal muscle cells. (A) Schematic representation of calcification induction in RH30 cells and the quantification of HA complexes by flow cytometry. (B) Dose-dependent increase in osteoimage MFI of RH30 cells cultured in moderate (1.77 mM CaCl2 and 6.63 mM Na3PO4) or high (3.12 mM CaCl2 and 7.63 mM Na3PO4) calcium phosphate (CaP) medium for 24 h (n = 3 independent experiments). (C) Viability, as determined by Annexin V and Propidium (PI) iodide staining (live cells: Annexin V-PI-) of RH30 cells cultured in moderate and high CaP medium for 24 h (n = 3 independent experiments). (D) Time-dependent increase in osteoimage MFI in RH30 cells cultured in moderate CaP medium for 24 or 48 h (n = 6 independent experiments). All graphs: Median is shown. Statistical analysis: (B) Non-parametric Wilcoxon matched-pairs signed rank test was used for comparison between media and CaP conditions. CaP conditions are compared using non-parametric Mann-Whitney test. (C,D) Non-parametric Mann-Whitney test. (E) Non-parametric Wilcoxon matched-pairs signed rank test. *p < 0.05; **P ≤ 0.01; ***P ≤ 0.001.
Fig. 4.
Fig. 4.
Mitochondrial calcification of human skeletal muscle cells cultured in moderate calcium phosphate medium. (A) Osteoimage flow cytometry analysis of RH30 cells cultured in complete media alone, or complete culture media supplemented with 1.77 mM CaCl2 and 6.63 mM Na3PO4 in the presence or absence of FCCP (5 μM) (n = 4 independent experiments) for 24 h. (B) Confocal images of RH30 cells stained for osteoimage, Green (HA), Anti-Tom22 (mitochondrial outer membrane protein, Red), and DAPI (nuclear stain, Blue) (representative of two independent experiments). White arrows highlight zoomed regions. (C) RH30 cells were pretreated with Ru360 (1 μM) 60 min before exposure to CaP medium for 24 h s followed by osteoimage analysis by flow cytometry (n = 3 independent experiments). (D) Relative percentage of calcification (osteoimage MFI) in MICU1 knockdown RH30 cells (shMICU1) compared to vector control (shControl) (n = 2 independent experiments). All graphs: Median is shown. Statistical analysis: (A) Non-parametric Mann-Whitney test. (C,D) Non-parametric Wilcoxon matched-pairs signed rank test. **P ≤ 0.01; ****≤0.0001.
Fig. 5.
Fig. 5.
Calcification causes mitochondrial dysfunction in calcifying human skeletal muscle cells. (A) Mitochondrial membrane potential analysis using MitoTracker Red CMXRos, a membrane-potential dependent mitochondrial dye (n = 2 independent experiments). Briefly, RH30 cells were cultured in complete RPMI medium supplemented with or without 1.77 mM CaCl2 and 6.63 mM Na3PO4 for 4 h and analyzed for membrane potential by flow cytometry analysis. (B) mtROS analysis of RH30 cells using mitoSOX by flow cytometry (n = 6 independent experiments). Briefly, RH30 cells were cultured in the presence or absence of with 1.77 mM CaCl2 and 6.63 mM Na3PO4 for 4 h followed by staining with mitoSOX (5 μM in warm 1X PBS) for 30 min at 37 °C. (C) Representative mitochondrial oxygen consumption rates in RH30 cells cultured in complete RPMI medium supplemented with or without CaP medium for 24 h, under basal conditions, oligomycin (5 μM), FCCP (4.5 μM), rotenone (1 μM) or antimycin A (1 μM) are shown as measured using Seahorse XF24 analyzer (n = 2 independent experiments). (D) Average basal respiration (n = 2 independent experiments), (E) Average ATP-linked respiration (n = 2 independent experiments), and (F) Maximal respiration (n = 2 independent experiments) are shown. (G) Results from over representative analysis (ORA) using hypergeometric test to evaluate whether a particular metabolite set is represented more than expected by chance within significantly decreased metabolites in CaP-treated cells compared to media only (online Supplemental Fig. S5). ORA is performed in MetaboAnalyst version 5.0. Enrichment Ratio is computed by Hits/Expected, where hits = observed hits; expected = expected hits. One-tailed p values are provided after adjusting for multiple testing. All graphs: Median is shown. Statistical analysis (A,D,E,F) Non-parametric Mann-Whitney test. (B) Non-parametric Wilcoxon matched-pairs signed rank test. ****≤0.0001.
Fig. 6.
Fig. 6.
Intracellular mitochondrial calcification of human skeletal muscle cells amplified by hIFN-α occurs in an mtROS-dependent manner. (A) mtROS analysis of RH30 cells using mitoSOX by flow cytometry (n = 4 independent experiments). Briefly, RH30 cells were cultured in complete RPMI medium supplemented with 1.77 mM CaCl2 and 6.63 mM Na3PO4 in the presence or absence of different concentrations of hIFN-α for 4 h followed by staining with mitoSOX (5 μM in warm 1X PBS) for 30 min at 37 °C. (B) Dose-dependent increase in mitochondrial calcification of RH30 cells by hIFN-α (n = 5 independent experiments). RH30 cells are cultured for 24 h in with 1.77 mM CaCl2 and 6.63 mM Na3PO4 and −/+ human type I IFN-α and then analyzed for HA complex formation by osteoimage flow cytometry analysis. (C) Attenuation of calcification in RH30 cells by treatment of cells with FCCP (5 μM) (n = 2 independent experiments). RH30 cells are cultured for 24 h in complete RPMI medium supplemented with or without 1.77 mM CaCl2 and 6.63 mM Na3PO4 in the absence or presence of human type I IFN-α −/+ FCCP (5 μM) and then analyzed for HA complex formation by osteoimage flow cytometry analysis. (D) MitoSOX analysis of RH30 cells pre-treated with mitoTempo (10 μM) for 30 min prior to the hIFN-α treatment and/or CaP media. Cells were analyzed for mtROS using mitoSOX after 4 h of incubation (n = 3 independent experiments). (E) Osteoimage staining flow cytometry analysis of HA complexes in RH30 cells cultured for 24 h in complete RPMI medium supplemented with or without CaCl2 and Na3PO4 in the absence or presence of hIFN-α and mitoTempo (10 μM). RH30 cells are pre-treated MitoTempo 30 min prior to the addition of hIFN-α and 1.77 mM CaCl2 and 6.63 mM Na3PO4 (n = 5 independent experiments). All graphs: Median is shown. Statistical analysis (A) Non-parametric Wilcoxon matched-pairs signed rank test was used for comparison between media and CaP conditions. (A,B, D,E,F) CaP conditions are compared using non-parametric Mann-Whitney test. *P ≤ 0.05; **P ≤ 0.01.
Fig. 7.
Fig. 7.
In vitro calcification induces inflammation in human skeletal muscle cells. (A) IFI44L and (B) ISG15 mRNA levels in RH30 cells cultured in complete RPMI medium supplemented with or without 1.77 mM CaCl2 and 6.63 mM Na3PO4 for 24 h prior to RNA isolation, cDNA preparation followed by qPCR (n = 4 independent experiments). All graphs: Median is shown. Statistical analysis: Non-parametric Wilcoxon matched-pairs signed rank. ****P ≤ 0.0001.
Fig. 8.
Fig. 8.
cGAS-STING-mediated ISG expression and voltage-dependent anion channel (VDAC)-mediated cytosolic release of mtDNA in calcifying human skeletal muscle cells. RH30 cells pretreated with or without different concentrations of H-151 for 60 min in RPMI medium followed by the treatment of 1.77 mM CaCl2 and 6.63 mM Na3PO4 media for 24 h and then analyzed for (A) ISG expression by qPCR (n = 4 independent experiments (B) for HA complex formation by osteoimage flow cytometry analysis (n = 3 independent experiments) or for gene expression. (C) RH30 cells pretreated with or without VBIT-4 (1 μM) for 30 min in RPMI medium followed by the treatment of 1.77 mM CaCl2 and 6.63 mM Na3PO4 media for 24 h and then analyzed by qPCR for ISG expression (n = 3 independent experiments). All graphs: Median is shown. Statistical analysis (A,B,C) Non-parametric Wilcoxon matched-pairs signed rank test. *P < 0.05, **P ≤ 0.01; ***P ≤ 0.001, ***≤0.0001.

References

    1. Symmons DP, Sills JA, Davis SM, The incidence of juvenile dermatomyositis: results from a nation-wide study, Br. J. Rheumatol. 34 (1995) 732–736. - PubMed
    1. Feldman BM, Rider LG, Reed AM, Pachman LM, Juvenile dermatomyositis and other idiopathic inflammatory myopathies of childhood, Lancet 371 (2008) 2201–2212. - PubMed
    1. Chung MP, Richardson C, Kirakossian D, Orandi AB, Saketkoo LA, Rider LG, et al., Calcinosis biomarkers in adult and juvenile dermatomyositis, Autoimmun. Rev. 19 (2020), 102533. - PMC - PubMed
    1. Pachman LM, Boskey AL, Clinical manifestations and pathogenesis of hydroxyapatite crystal deposition in juvenile dermatomyositis, Curr. Rheumatol. Rep. 8 (2006) 236–243. - PubMed
    1. Eidelman N, Boyde A, Bushby AJ, Howell PG, Sun J, Newbury DE, et al., Microstructure and mineral composition of dystrophic calcification associated with the idiopathic inflammatory myopathies, Arthritis Res. Ther. 11 (2009) R159. - PMC - PubMed

Publication types