. 2023 May 27;14(1):3074.
doi: 10.1038/s41467-023-38886-8.

Single-cell transcriptomics reveals immune suppression and cell states predictive of patient outcomes in rhabdomyosarcoma

Affiliations

Single-cell transcriptomics reveals immune suppression and cell states predictive of patient outcomes in rhabdomyosarcoma

Jeff DeMartino et al. Nat Commun. .

Abstract

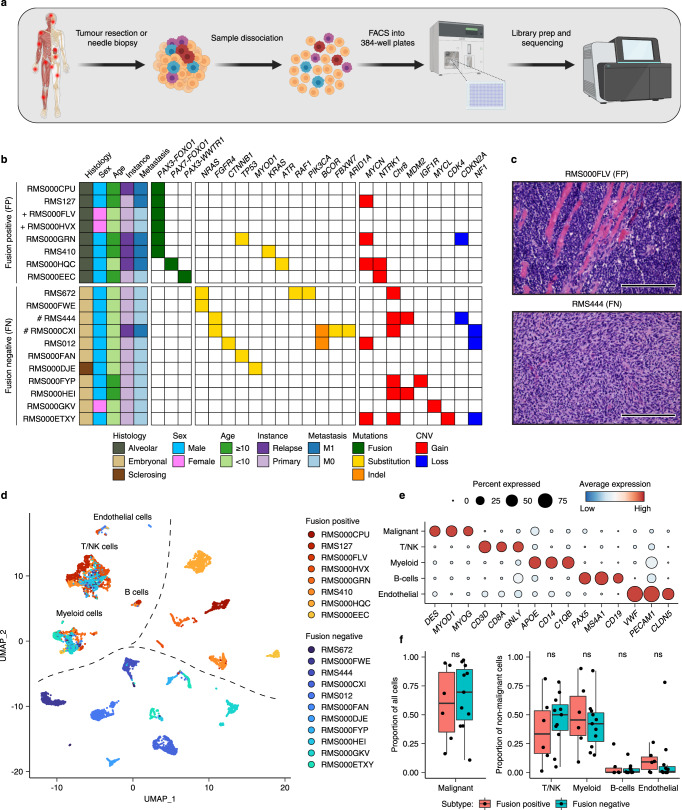
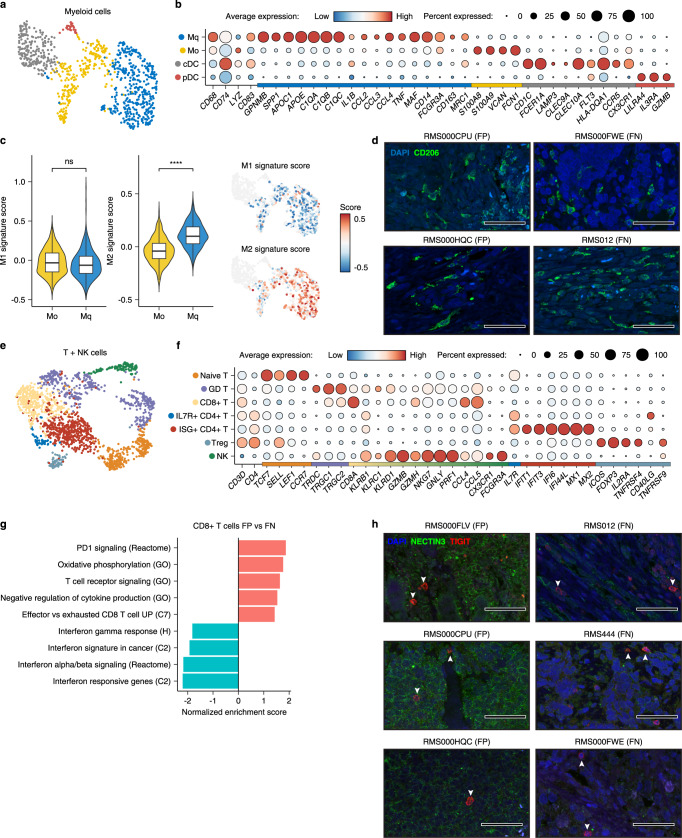
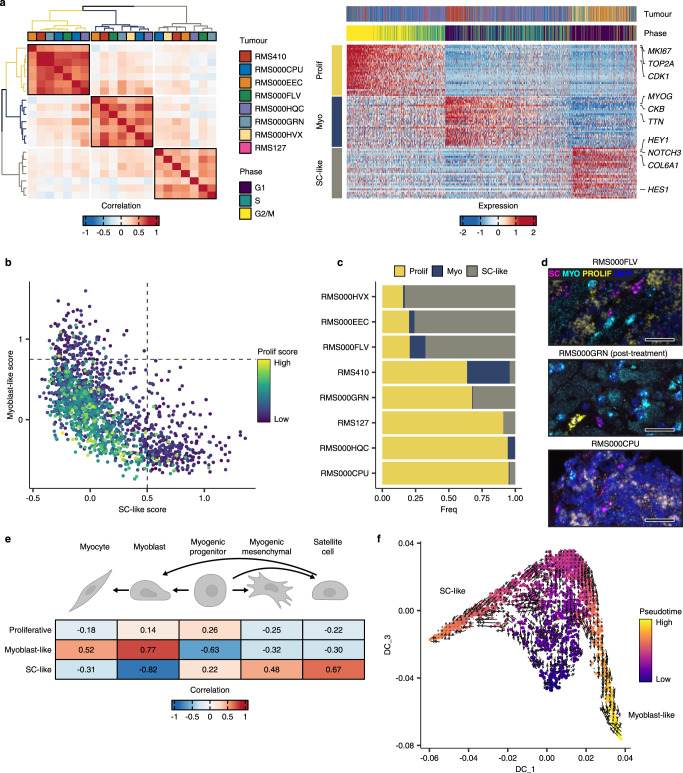
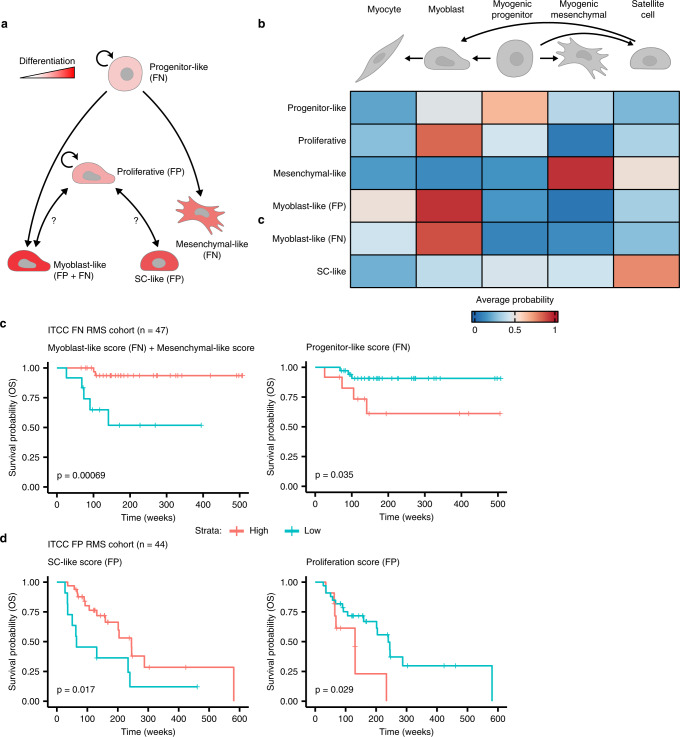
Paediatric rhabdomyosarcoma (RMS) is a soft tissue malignancy of mesenchymal origin that is thought to arise as a consequence of derailed myogenic differentiation. Despite intensive treatment regimens, the prognosis for high-risk patients remains dismal. The cellular differentiation states underlying RMS and how these relate to patient outcomes remain largely elusive. Here, we use single-cell mRNA sequencing to generate a transcriptomic atlas of RMS. Analysis of the RMS tumour niche reveals evidence of an immunosuppressive microenvironment. We also identify a putative interaction between NECTIN3 and TIGIT, specific to the more aggressive fusion-positive (FP) RMS subtype, as a potential cause of tumour-induced T-cell dysfunction. In malignant RMS cells, we define transcriptional programs reflective of normal myogenic differentiation and show that these cellular differentiation states are predictive of patient outcomes in both FP RMS and the less aggressive fusion-negative subtype. Our study reveals the potential of therapies targeting the immune microenvironment of RMS and suggests that assessing tumour differentiation states may enable a more refined risk stratification.


Conflict of interest statement

The authors declare no competing interests.

Figures

Fig. 1
Fig. 1. Single-cell transcriptomic atlas of RMS tumours.
a Schematic representation of the sample processing workflow used to generate scRNA-seq data from primary samples. Created with BioRender. b Overview of RMS sample cohort, including patient clinical characteristics, as well as a summary of relevant mutations and copy number variants (CNV) in tumours, defined using bulk DNA sequencing. ( + ) and (#) indicate independent samples derived from the same patient. c Representative haematoxylin and eosin (H&E) stained tumour sections depicting the two major RMS histological subtypes (alveolar and embryonal) in this cohort. Scale bars are equivalent to 200 µm. Images representative of stained sections from all samples in the primary cohort (n = 19) d UMAP projection of single-cell RMS transcriptomes from primary samples (n = 7364) coloured by sample. e Dot plot depicting the average scaled gene expression of selected marker genes for each annotated cell type (dot colour). Dot size corresponds to the percentage of cells expressing each gene. f Boxplots comparing the proportion of malignant cells (left panel) and each non-malignant cell type (right panel) between molecular subtypes (n = 17 biologically independent samples). ns = not significant (p > 0.05, two-sided student’s t test). Both panels exclude bone marrow aspirate samples. The mean is used as the centre measurement for each box, which encloses the range between the first and third quartiles. Whiskers extend to the largest (or smallest) values no further than 1.5× the inter-quartile range (IQR) from the box hinges. Source data are provided as a Source Data file.
Fig. 2
Fig. 2. Characterisation of the RMS immune microenvironment.
a UMAP projection of myeloid cells, coloured by cluster assignment. b Dot plot depicting the average expression of selected cell type-specific genes (Mq = differentiated macrophages, M0 = undifferentiated macrophages, cDC = conventional dendritic cells and pDC = plasmacytoid dendritic cells). Dot size corresponds to the percentage of cells expressing each marker. Colour bar on the x-axis indicates for which cluster each gene is specific. c Combined Violin/Box and UMAP plots showing the distribution of M1 (left panel) and M2 (right panel) signature scores in undifferentiated (M0, coloured yellow in the violin/box plots) and differentiated (Mq, coloured blue in the violin/box plots) macrophages (n = 637 biologically independent cells). ns = not significant (p > 0.05, Student’s T test), **** indicates p < 2.2e−16 (two-sided student’s T test). Mean is used as the centre measurement for each box, which encloses the range between the first and third quartiles. Whiskers extend to the largest (or smallest) values no further than 1.5× the IQR from the box hinges. Non-macrophage cells are coloured grey in UMAP plots. d Representative immunofluorescence (IF) microscopy images depicting the expression of CD206 (green) and DAPI counterstaining (blue), in RMS tissue sections from FN and FP tumours. Scale bars equivalent to 50 µm. e UMAP projection of T and NK cells, coloured by cluster assignment. f Dot plot depicting the average expression of selected cell type-specific genes (Naïve T = Naïve T cells, GD T = Gamma delta T cells, CD8 + T = Cytotoxic T cells, ILR7 + CD4 + T = IL7R + T helper cells, ISG + CD4 + T = Interferon stimulated T helper cells, Treg = T regulatory cells, NK = Natural Killer cells). Dot size corresponds to the percentage of cells expressing each marker. Colour bar on the x-axis indicates the cluster specificity for each gene. g Normalised enrichment scores (NES) of selected gene sets, as determined by gene set enrichment analysis (GSEA) comparing CD8 + T cells between RMS subtypes. Codes in parenthesis indicate the database from which the gene set derives (H, C2 and C7 correspond to MSigDB collections). Colour corresponds to a positive (pink) or negative (blue) NES. h Representative IF microscopy images depicting the expression of TIGIT (red) and NECTIN3 (green), along with DAPI counterstaining (blue), in RMS tissue sections from FN and FP tumours. White arrows highlight TIGIT+ cells. Scale bars equivalent to 50 µm. Source data are provided as a Source Data file.
Fig. 3
Fig. 3. NMF defines malignant cell states in FN RMS tumours.
a Left panel: Heatmap showing the pairwise Pearson correlations between all NMF-defined transcriptional programs in FN samples. The tumour sample from which each transcriptional program was derived is shown in the colour bar. Meta-program clusters are delineated by black boxes and colouring of the dendrograms. Right panel: Scaled expression of the top 30 genes per meta-program across all FN cells (Myo = Myoblast-like, Prog = Progenitor-like and Mes = Mesenchymal-like). The corresponding tumour sample and inferred cell cycle phase of each cell are displayed in the top annotation track. Representative genes from each meta-program are labelled. b Scatterplot depicting the mesenchymal-like (x-axis), myoblast-like (y-axis) and progenitor-like (point colour) meta-program scores. Dotted lines correspond to the cut-offs used to define discrete cell states. c Proportion of cells within each discrete state, per FN tumour. d Representative RNA fluorescence in-situ hybridisation (RNA-FISH) images depicting the expression of mesenchymal-like (MES = TGFBI) and progenitor-like (PROG = FGFR4) cell state marker genes in FN tissue samples. DAPI counterstaining is shown in grey. Scale bars equivalent to 25 µm. e Diffusion maps projection of FN RMS single cells, coloured by pseudotime value, overlaid with the RNA velocity vector field. f Heatmap depicting the Pearson correlations between cell-state scores, and the logistic regression-defined similarity scores (logits) for each normal myogenic cell type. Myogenic differentiation schematic was created with BioRender. Source data are provided as a Source Data file.
Fig. 4
Fig. 4. Cell states in FP RMS tumours mirror skeletal muscle myogenic differentiation.
a Left panel: Heatmap showing the pairwise Pearson correlations between all NMF-defined transcriptional programs in FP samples. The tumour sample from which each transcriptional program was derived is shown in the colour bar. Meta-program clusters are delineated by black boxes and colouring of the dendrograms. Right panel: Scaled expression of the top 30 genes per meta-program across all FP cells (Myo = Myoblast-like, Prolif = Proliferative and SC-like = Satellite cell-like). The corresponding tumour sample and inferred cell cycle phase of each cell are displayed in the top annotation bar. Representative genes from each meta-program are labelled. b Scatterplot depicting per cell meta-program scores. Dotted lines correspond to the cut-offs used to define discrete cell states. c Proportion of cells within each discrete state, per FP tumour. d Representative RNA fluorescence in-situ hybridisation (RNA-FISH) images depicting the expression of satellite cell-like (magenta, SC = NOTCH3), myoblast-like (cyan, MYO = TTN) and proliferative (yellow, PROLIF = MKI67) cell state marker genes in FP tissue samples. DAPI counterstaining shown in blue. Scale bars equivalent to 25 µm. e Heatmap depicting the Pearson correlations between FP cell-state scores, and the logistic regression-defined similarity scores (logits) for each normal myogenic cell type. f Diffusion maps projection of FP RMS single cells, coloured by pseudotime value, overlaid with the RNA velocity vector field. Myogenic differentiation schematic was created with BioRender. Source data are provided as a Source Data file.
Fig. 5
Fig. 5. Malignant cell states are predictive of patient outcomes.
a Schematic representation of differentiation trajectories in RMS. Created with BioRender. b Heatmap showing the average predicted similarity (probability) between discrete malignant cell states from both RMS molecular subtypes (y-axis) and normal myogenic cell types, as determined by logistic regression analysis. Myogenic differentiation schematic was created with BioRender. c, d Kaplan-Meier plots showing the overall survival probabilities of (c) FN (n = 47) or (d) FP (n = 44) patients divided into high (red strata) or low (blue strata) groups based on their cell state scores (stated in the title of each plot panels). Log-rank test was used to calculate p values between high- and low-scoring groups. Source data are provided as a Source Data file.

References

    1. Li J, Thompson TD, Miller JW, Pollack LA, Stewart SL. Cancer incidence among children and adolescents in the United States, 2001-2003. Pediatrics. 2008;121:e1470–e1477. doi: 10.1542/peds.2007-2964. - DOI - PubMed
    1. Sebire NJ, Malone M. Myogenin and MyoD1 expression in paediatric rhabdomyosarcomas. J. Clin. Pathol. 2003;56:412–416. doi: 10.1136/jcp.56.6.412. - DOI - PMC - PubMed
    1. Stiller D, Holzhausen HJ. Ultrastructural organization of cell characteristics relevant to diagnosis in rhabdomyosarcomas. Zentralblatt f.ür. Allg. Pathologie Pathologische Anat. 1988;134:449–466. - PubMed
    1. Drummond CJ, et al. Hedgehog Pathway Drives Fusion-Negative Rhabdomyosarcoma Initiated From Non-myogenic Endothelial Progenitors. Cancer Cell. 2018;33:108–124.e5. doi: 10.1016/j.ccell.2017.12.001. - DOI - PMC - PubMed
    1. Oberlin O, et al. Prognostic factors in metastatic rhabdomyosarcomas: Results of a pooled analysis from United States and European Cooperative Groups. J. Clin. Oncol. 2008;26:2384–2389. doi: 10.1200/JCO.2007.14.7207. - DOI - PMC - PubMed

Publication types