. 2023 May 27;13(1):8607.
doi: 10.1038/s41598-023-35160-1.

Multi-channel recordings reveal age-related differences in the sleep of juvenile and adult zebra finches

Affiliations

Multi-channel recordings reveal age-related differences in the sleep of juvenile and adult zebra finches

Hamed Yeganegi et al. Sci Rep. .

Abstract

Despite their phylogenetic differences and distinct pallial structures, mammals and birds show similar electroencephalography (EEG) traces during sleep, consisting of distinct rapid eye movement (REM) sleep and slow wave sleep (SWS) stages. Studies in human and a limited number of other mammalian species show that this organization of sleep into interleaving stages undergoes radical changes during lifetime. Do these age-dependent variations in sleep patterns also occur in the avian brain? Does vocal learning have an effect on sleep patterns in birds? To answer these questions, we recorded multi-channel sleep EEG from juvenile and adult zebra finches for several nights. Whereas adults spent more time in SWS and REM sleep, juveniles spent more time in intermediate sleep (IS). The amount of IS was significantly larger in male juveniles engaged in vocal learning compared to female juveniles, which suggests that IS could be important for vocal learning. In addition, we observed that functional connectivity increased rapidly during maturation of young juveniles, and was stable or declined at older ages. Synchronous activity during sleep was larger for recording sites in the left hemisphere for both juveniles and adults, and generally intra-hemispheric synchrony was larger than inter-hemispheric synchrony during sleep. A graph theory analysis revealed that in adults, highly correlated EEG activity tended to be distributed across fewer networks that were spread across a wider area of the brain, whereas in juveniles, highly correlated EEG activity was distributed across more numerous, albeit smaller, networks in the brain. Overall, our results reveal that significant changes occur in the neural signatures of sleep during maturation in an avian brain.


Conflict of interest statement

The authors declare no competing interests.

Figures
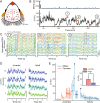
Figure 1
Figure 1
Multichannel EEG recordings during sleep. (A) Position of 16 EEG electrode sites on the surface of the skull: 8 electrode sites were located on each hemisphere and covered a wide area over the surface of pallium. Specific brain structures underlying each electrode are listed in Table 2. G, ground electrode; R, reference electrode. (B) Top: Bird movement extracted from the infrared video recording (px, pixels). Blue dashed line indicates the threshold delineating wake and sleep. Bottom: Corresponding (δ+θ)/γ trace shows the oscillatory components of EEG, representing different sleep stages. Orange arrows 1, 2, and 3, correspond to EEG data in C. Movement and (δ+θ)/γ traces are smoothed with a 30 s window for visualization purposes. (C) 3 s examples of simultaneous EEG recorded from the 16 different electrodes (bottom trace, electrode 1; top trace, electrode 16). Circled numbers correspond to orange arrows in B and indicate examples of SWS (1), IS (2), and REM sleep (3). Color scheme is for visualization purposes only. Gray shading on left indicates the electrodes that are located on the left hemisphere. Black dotted boxes highlight examples of local waves (see Fig. 3). Black arrow indicates electrode 4. (D) (δ+θ)/γ traces are similar across electrode sites in a time scale of minutes. Traces are for a single juvenile (left) and adult (right); exact nights are indicated with black arrows in (E). Scale bar is 200 (unitless (δ+θ)/γ ratio). (E) Median (δ+θ)/γ values calculated across 12 h of sleep in 3 s bins, for all nights of each bird (median ± interquartile). Each symbol represents a different bird, and different nights of sleep are presented sequentially. Teal lines indicate males; orange lines indicate females. (δ+θ)/γ values are relatively consistent across nights within each individual bird, but large variability exists across different birds. Black arrows indicate animals and nights use in (D). Inset: (δ+θ)/γ values averaged across all juveniles (red) and adults (blue). Error bars indicate the SD. A significant effect of age was present (p = 0.032; two-way unbalanced ANOVA).
Figure 2
Figure 2
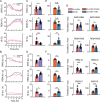
Sleep stage percentages and transitions in juveniles and adults based on automatic sleep segmentation. (A) Average percentage of SWS (top), REM sleep (middle), and IS (bottom) for juveniles (red) and adults (blue) over 12 h of sleep. Error bars indicate the s.e.m. Note how the early hours of the night are dominated by SWS, whereas the later hours of the night are dominated by REM sleep for both adults and juveniles. (B) Duration of SWS, REM sleep, and IS in juveniles and adults over 12 h of sleep. Figure conventions same as in (A). (C) Mean percentages of SWS (top), REM sleep (middle), and IS (bottom) pooled over all nights for juveniles (red) and adults (blue). Symbols indicate nights from individual animals (see Fig. 1E). Asterisks indicate significance (two-way ANOVA; *p ≤ 0.05; **p ≤ 0.01; ***p ≤ 0.001). (D) Mean durations for SWS (top), REM sleep (middle), and IS (bottom) pooled over all nights for juveniles (red) and adults (blue). Figure conventions same as in (C). (E) Percentages of SWS (top), REM sleep (middle), and IS (bottom) pooled over all nights for female juveniles (orange) and male juveniles (teal). Figure conventions same as in (C). (F) Mean durations for SWS (top), REM sleep (middle), and IS (bottom) pooled over all nights for female juveniles (orange) and male juveniles (teal). Figure conventions same as in (C). (G) Mean number of transitions per hour for juveniles (red) and adults (blue) and juvenile females (orange) and juvenile males (teal). Figure conventions same as in (C).
Figure 3
Figure 3
Local waves have a higher incidence in adults and a posterior–anterior axis. (A) An example of the (δ+θ)/γ trace for a juvenile bird (top, light red line) and the corresponding rate of occurrence for the local waves (bottom, dark red line) for a whole night of sleep (same juvenile as in Fig. 1D; black arrow in Fig. 1E). The occurrence of local waves was correlated with the (δ+θ)/γ ratio, i.e., local waves occurred more often during periods of high (δ+θ)/γ values. Note how this juvenile has a much larger median (δ+θ)/γ ratio compared to other juveniles and adults (see Fig. 1E), which may account for the large rate of local wave occurrence compared to the adult in (B). (B) An example of the (δ+θ)/γ trace for an adult bird (top, light blue line) and the corresponding rate of occurrence for the local waves (bottom, dark blue line) for a whole night of sleep (same adult as in Fig. 1D; black arrow in Fig. 1E). Data in (A) and (B) have been smoothed with a 30-s moving average filter for visualization purposes. (C) The average rate of occurrence for local waves across nights for all birds. Each symbol represents a different bird, and different nights of sleep are presented sequentially. Teal lines indicate males; orange lines indicate females. Vertical line indicates the SD for the night. Inset: local waves occur significantly more frequently in the adult birds (blue bars) compared to juveniles (red bars; p = 6.7 × 10–7; two-way unbalanced ANOVA). Error bars indicate SD. (D) Average (δ+θ)/γ values computed at each electrode site across all juveniles (left) and all adults (right). (δ+θ)/γ values are higher in anterior regions (red colors) compared to posterior sites (yellow colors). This anterior–posterior gradient is especially pronounced in adults. GND, ground electrode; REF, reference electrode; A, anterior; P, posterior. (E) Average rate of local waves computed at each electrode site across all juveniles (left) and all adults (right). Same figure conventions as in (D). An anterior–posterior gradient is also present for the local waves, such that anterior sites have a higher rate of local wave occurrence compared to posterior sites.
Figure 4
Figure 4
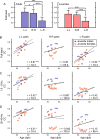
Left intra-hemispheric functional connectivity increases linearly during early maturation in juveniles. (A) Functional connectivity was calculated between pairs of electrodes using Pearson’s correlation coefficient (CC) on the full band EEG signal. Pair-wise comparisons of electrodes located in the left hemisphere (L–L) were calculated separately from electrodes pairs located in the right hemisphere (R–R). In both adults and juveniles, L–L and R–R CCs were significantly larger than CCs calculated for inter-hemispheric electrode pairs (L–R). Furthermore, in adults, L–L CCs were significantly larger than R-R CCs. (B) Scatter plot depicts the average L–L, R–R, or L–R CCs calculated for each night as a function of the juvenile birds’ age. Each symbol represents a different juvenile bird (same symbols as for Fig. 1E and Fig. 3C), and different nights of sleep are presented sequentially. Blue symbols indicate males; orange symbols indicate females. CCs were computed on the full band EEG signal (1.5–200 Hz). Black dotted line indicates the linear fit of the data, and the corresponding r value is located in the lower right corner. Asterisks indicate significant linear fits (*p ≤ 0.05; **p ≤ 0.01; ***p ≤ 0.001). Gray line indicates the exponential fit of the regressed data, and the corresponding time constant τ is located in the lower right corner. A significant linear trend existed for L–L and L–R electrode pairs, but not R–R pairs. (C) Scatter plot depicts the average L–L, R–R, or L–R CCs calculated on the low frequency EEG band (1.5–8 Hz). Figure conventions same as in (B). For the low frequency band, only the L–L electrode pairs showed a significant linear increase in functional connectivity as a function of age. (D) Scatter plot depicts the average L–L, R–R, or L–R CCs calculated on the high frequency EEG band (30–49 Hz). Figure conventions same as in (B). For the high frequency band, only the L–L electrode pairs showed a significant linear increase in functional connectivity as a function of age.
Figure 5
Figure 5
Highly correlated EEG activity is distributed across a few large networks in adults and several small networks in juveniles. (A) The main steps for the extraction of highly-correlated networks are illustrated (see Methods for more details). 1-The EEG correlation matrix was computed for each 3-s bin. 2-Significantly correlated pairs were kept for further analysis, based on a statistical method. 3-A graph representation of the significantly correlated pairs was constructed. To construct this graph, each EEG electrode was represented as a node, and a link connected two nodes in the case where the correlation between the corresponding EEG electrode was significantly high. 4. Using the Bron–Kerbosch algorithm from graph theory we extracted the sub-networks for which all electrodes were highly correlated, the “dominant networks”. (B) Dominant networks extracted from an adult during SWS, IS, and REM stages of sleep for 3 nights. A dominant network is indicated as a collection of orange nodes (the electrode sites) and the lines connecting them. Color coding of the lines represents the frequency of occurrence for each network across bins, i.e. the fraction of bins where the network appeared. Gray dots indicate nodes that are not included in the networks. In adults, dominant networks contain several nodes (are larger) but occur less frequently. (C) Dominant networks extracted from a juvenile during SWS, IS, and REM stages of sleep across all nights. Figure conventions same as in (B). In juveniles, dominant networks contain fewer nodes, but occur frequently. (D) Dominant network size was significantly larger for adults compared to juveniles. Error bars indicate the SD. (E) Dominant network abundance was lager for juveniles compared to adults, but not significantly different. Error bars indicate the SD.

Similar articles

Cited by

References

    1. Anafi RC, Kayser MS, Raizen DM. Exploring phylogeny to find the function of sleep. Nat. Rev. Neurosci. 2019;20:109–116. doi: 10.1038/s41583-018-0098-9. - DOI - PubMed
    1. Nath RD, et al. The jellyfish Cassiopea exhibits a sleep-like state. Curr. Biol. 2017;27:2984–2990.e3. doi: 10.1016/j.cub.2017.08.014. - DOI - PMC - PubMed
    1. Klein M, Michel F, Jouvet M. Etude Polygraphique du Sommeil ches les Oiseaux. C. R. Seances Soc. Biol. Fil. 1964;158:99–103. - PubMed
    1. Walker JM, Berger RJ. Sleep in the domestic pigeon (Columba livia) Behav. Biol. 1972;7:195–203. doi: 10.1016/S0091-6773(72)80199-8. - DOI - PubMed
    1. Low P, Shank SS, Sejnowski TJ, Margoliash D. Mammalian-like features of sleep structure in zebra finches. Proc. Natl. Acad. Sci. USA. 2008;105:9081–9086. doi: 10.1073/pnas.0703452105. - DOI - PMC - PubMed

Publication types