. 2023 May 27;14(1):3062.
doi: 10.1038/s41467-023-38919-2.

macroH2A2 antagonizes epigenetic programs of stemness in glioblastoma

Affiliations

macroH2A2 antagonizes epigenetic programs of stemness in glioblastoma

Ana Nikolic et al. Nat Commun. .

Abstract

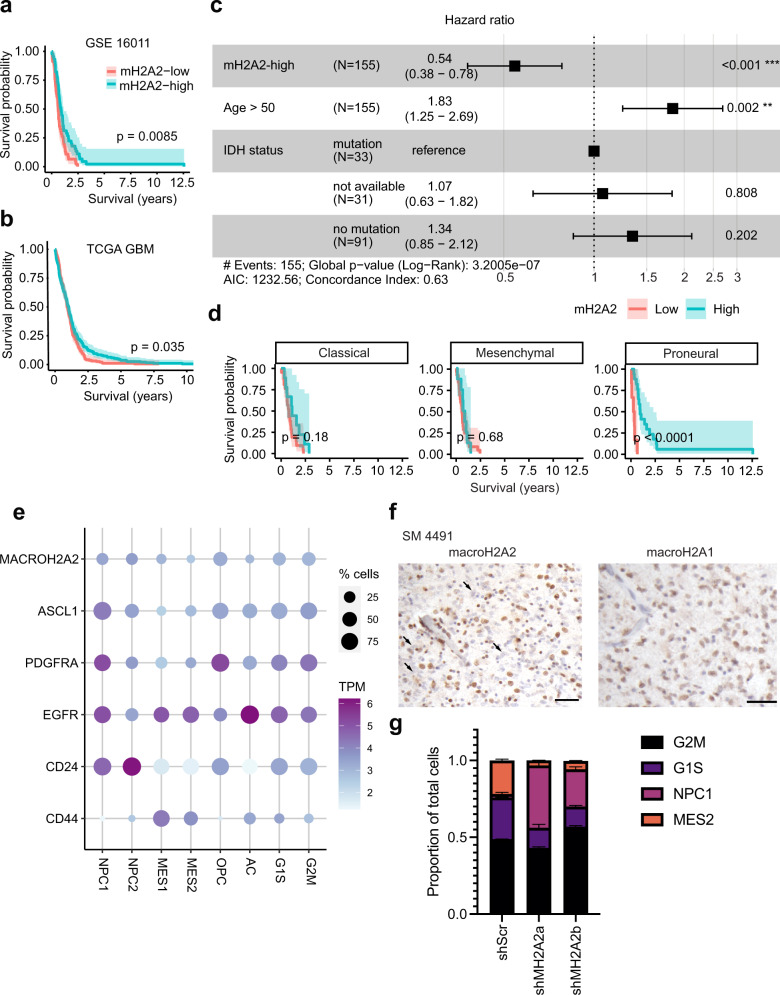
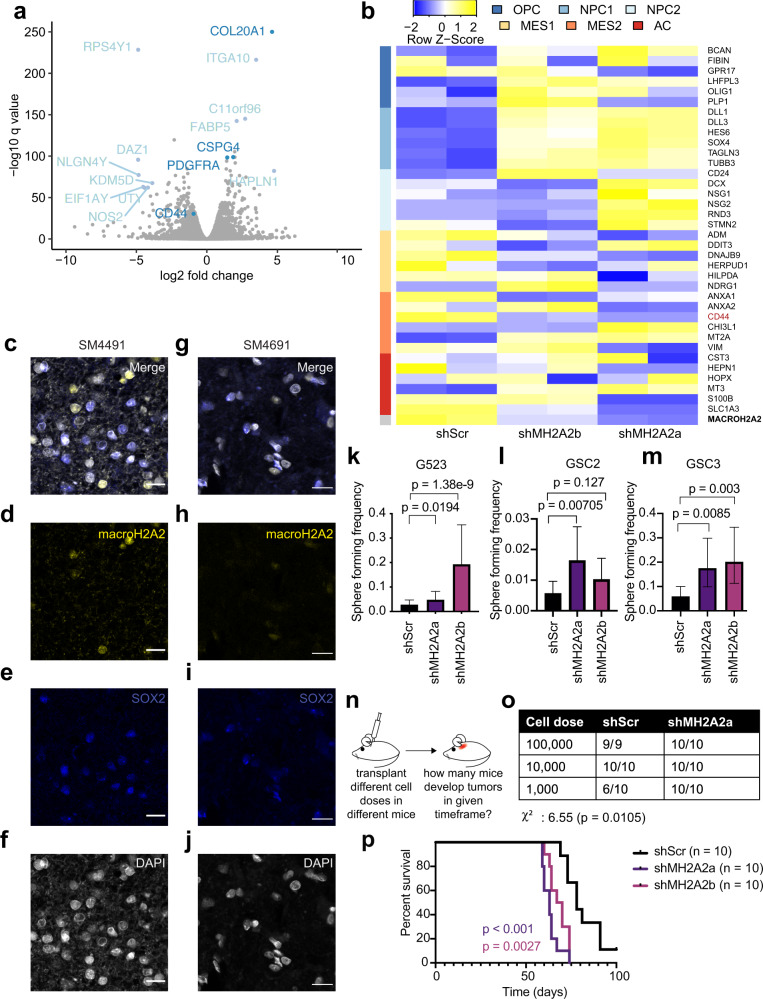
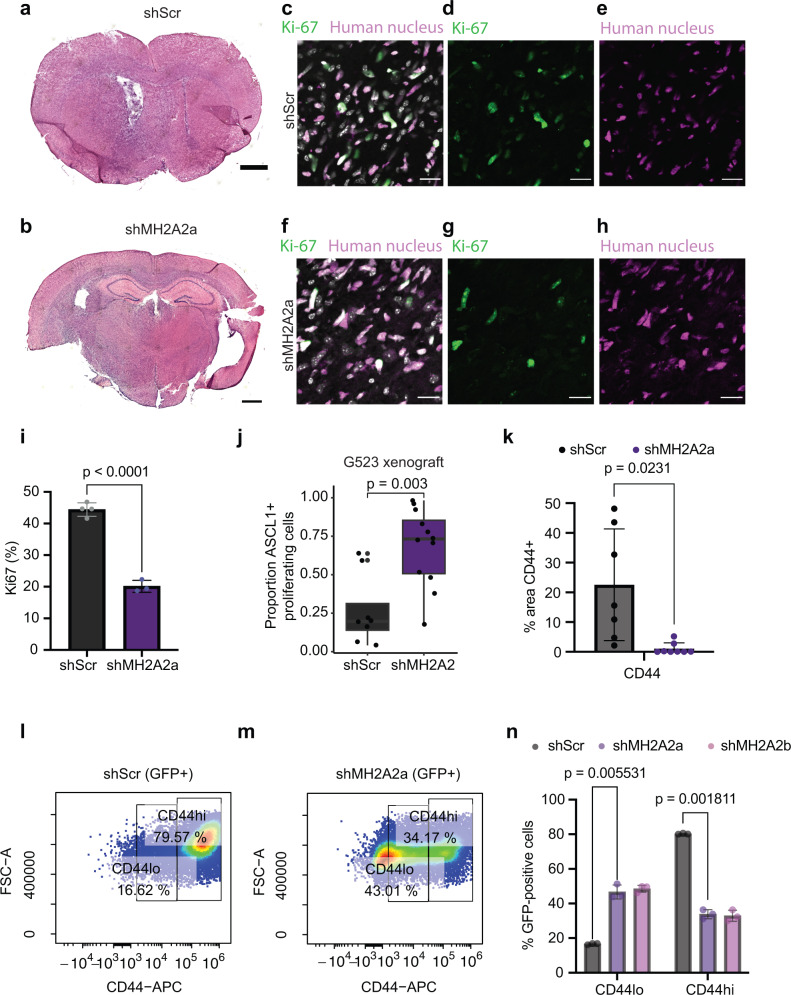
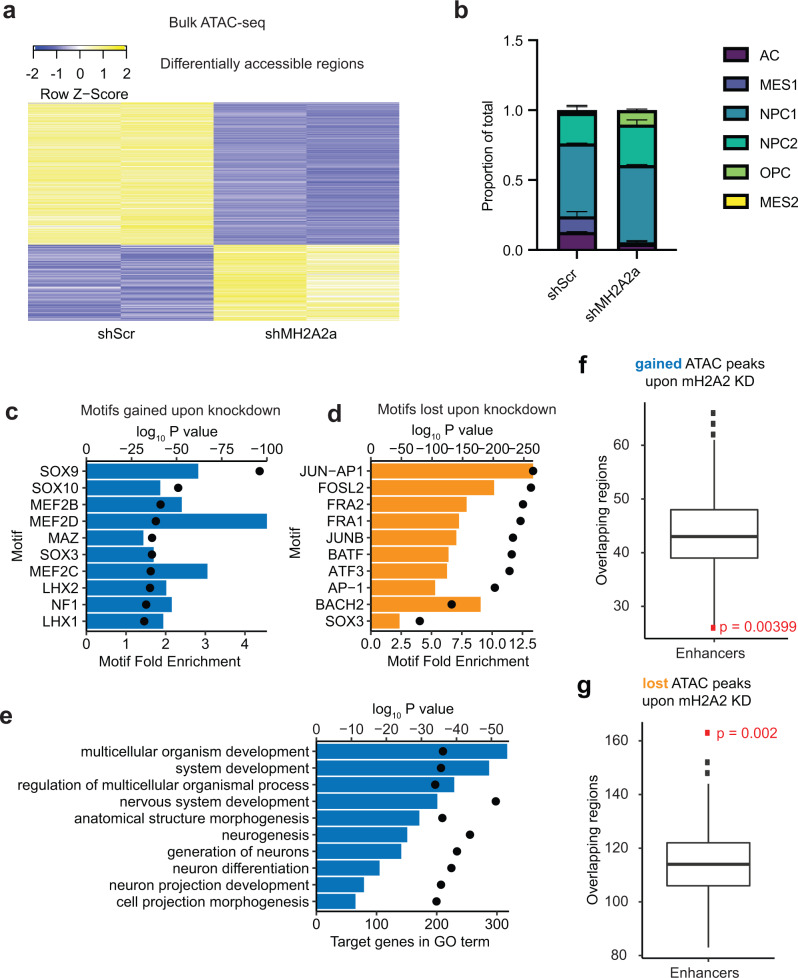
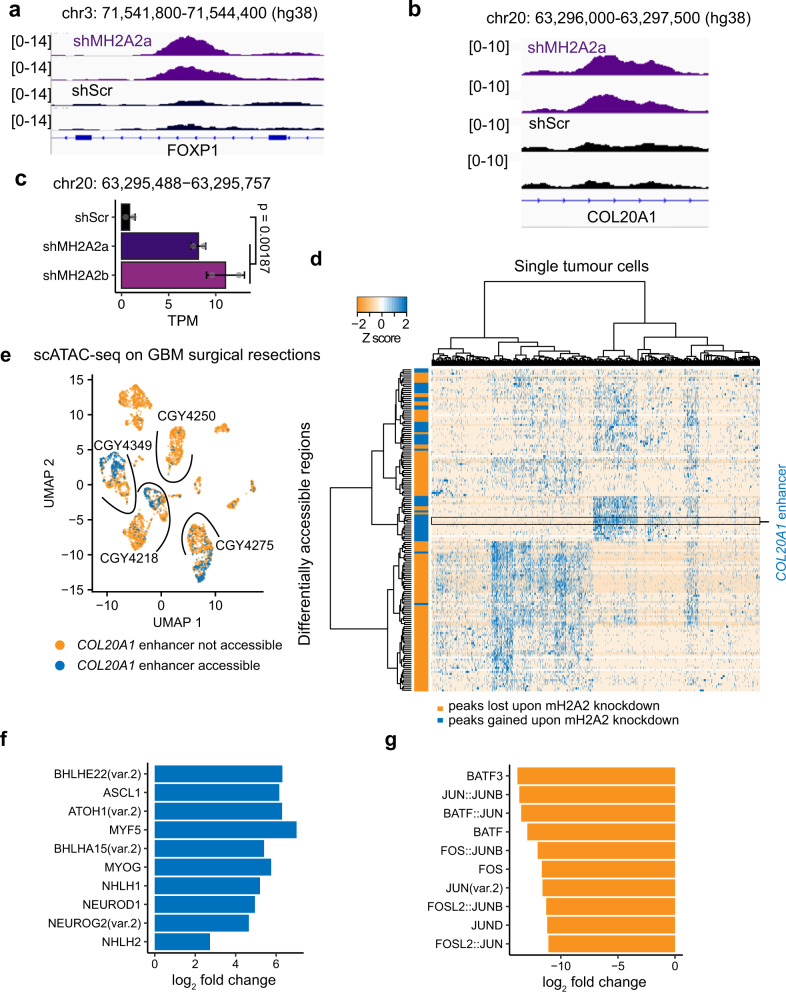
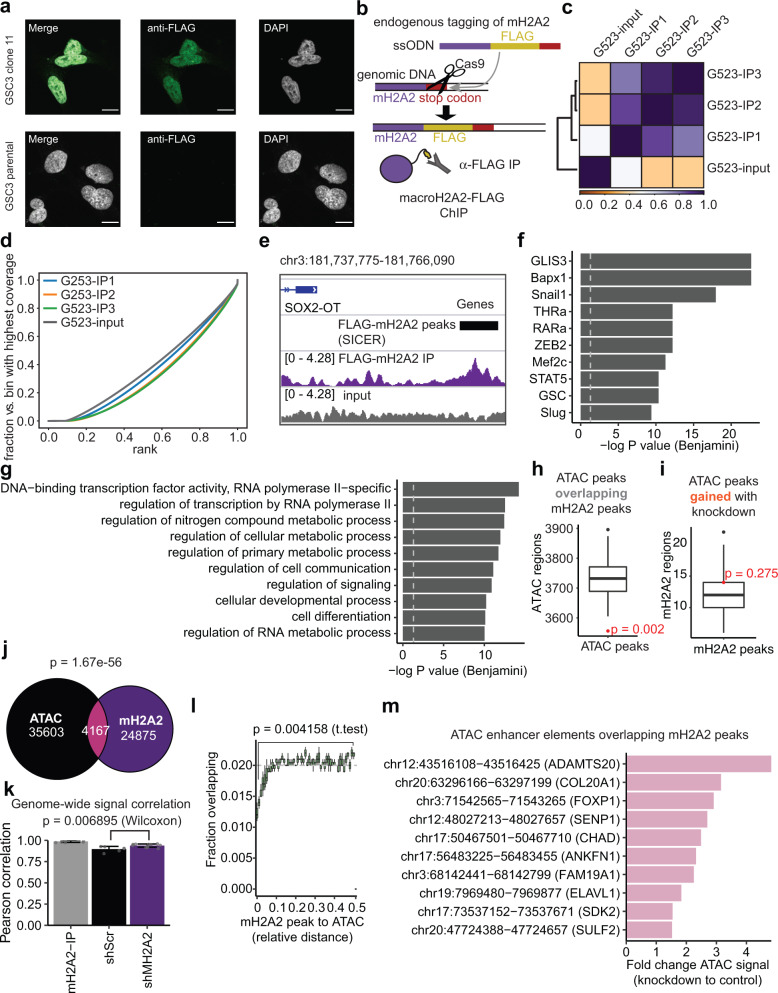
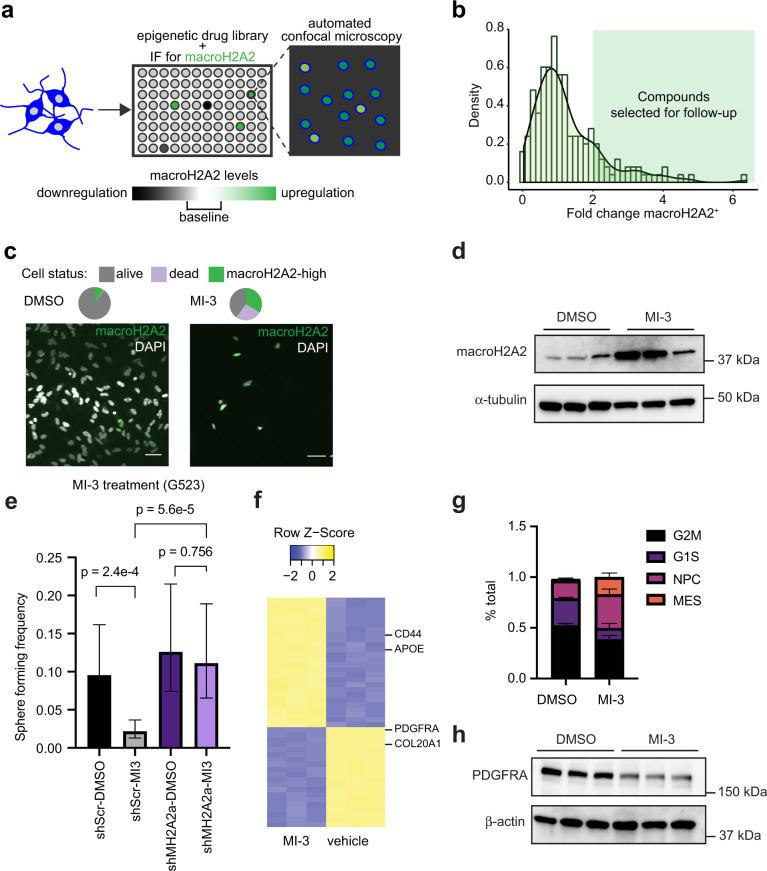
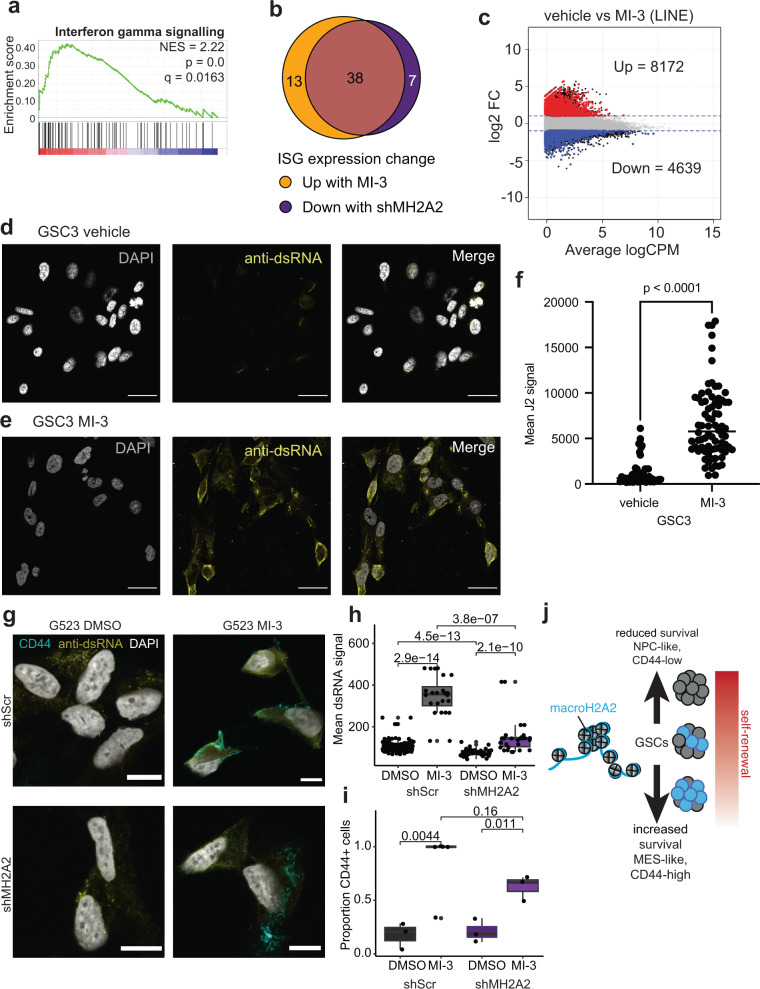
Self-renewal is a crucial property of glioblastoma cells that is enabled by the choreographed functions of chromatin regulators and transcription factors. Identifying targetable epigenetic mechanisms of self-renewal could therefore represent an important step toward developing effective treatments for this universally lethal cancer. Here we uncover an epigenetic axis of self-renewal mediated by the histone variant macroH2A2. With omics and functional assays deploying patient-derived in vitro and in vivo models, we show that macroH2A2 shapes chromatin accessibility at enhancer elements to antagonize transcriptional programs of self-renewal. macroH2A2 also sensitizes cells to small molecule-mediated cell death via activation of a viral mimicry response. Consistent with these results, our analyses of clinical cohorts indicate that high transcriptional levels of this histone variant are associated with better prognosis of high-grade glioma patients. Our results reveal a targetable epigenetic mechanism of self-renewal controlled by macroH2A2 and suggest additional treatment approaches for glioblastoma patients.


Conflict of interest statement

The authors declare no competing interests.

Figures

Fig. 1
Fig. 1. Low transcription levels of MACROH2A2 contribute to GBM aggressiveness.
a, b Kaplan–Meier survival analysis of a all high-grade gliomas in TCGA GBM cohort (n = 336) and b adult IDH-wildtype glioblastoma patients (GSE16011; n = 86) based on MACROH2A2 (mH2A2) transcription levels. mH2A2-low and -high groups were determined by median gene expression. The shaded region represents a 95% confidence interval. P value was obtained by log-rank test. c Hazard ratios for macroH2A2 expression in GSE16011 (n = 155) in a multivariate Cox regression model adjusting for other factors relevant for glioblastoma (age, IDH mutation status). Error bars represent 95% confidence intervals. d Kaplan–Meier survival analysis of adult IDH-wildtype glioblastoma patients (n = 86) separated by transcriptional subtype (GSE16011). The shaded region represents a 95% confidence interval. P values obtained by log-rank test. e Kaplan–Meier survival analysis of adult IDH-wildtype primary glioblastoma patients with the proneural transcriptional subtype (GLASS consortium; n = 17). The shaded region represents a 95% confidence interval. P values obtained by log-rank test. f Expression of MACROH2A2 (mH2A2) in the scRNA-seq GBM dataset by ref. plotted on a 2D state diagram. g CIBERSORTx decomposition of RNA-seq datasets from control and knockdown G523 cells (three biological replicates per condition); (p = 0.021 (NPC shScr vs shMH2A2a, p = 0.01823 (MES shScr vs shMH2A2a); NPC p = 0.0075 shScr vs shMH2A2b; MES p = 0.0116 shScr vs shMH2A2b) [p values: two-tailed unpaired T-test with Welch’s correction]. Error bars represent standard deviation. h Immunohistochemistry of macroH2A2 and macroH2A1 in a primary patient glioblastoma specimen (scale bar: 50 µ). The experiment was repeated on three independent primary clinical samples.
Fig. 2
Fig. 2. macroH2A2 antagonizes self-renewal in GBM and is suppressed in stem-like cells.
a Volcano plot highlighting differentially expressed genes after 7 days of MACROH2A2/macroH2A2 knockdown in G523 cells. b RNA-seq was used to determine transcriptional levels of the top genes of the state metamodules from ref. at 7 days following MACROH2A2/macroH2A2 knockdown. Two biological replicates were used per condition. cj Confocal microscopy images of macroH2A2 and SOX2 in two primary patient tumors (SM4491 (cf) and SM4691 (g–j)). Scale bars: 20 µ. The experiment was performed once on three independent clinical samples. km Limiting dilution assay results after 14 days of doxycycline induction in G523 glioblastoma cells (k), GSC2 (l), and GSC3 (m). The center point represents a calculated estimate of sphere formation. P value was determined by the Chi-square test with the tool ELDA (see Methods). Error bars: 95% confidence interval. Statistics from six technical replicates; the experiment was repeated three times. n Schematic of in vivo limiting dilution assay. o Overview of in vivo limiting dilution assay results. Mice were transplanted orthotopically with either shScr or shMH2A2a-transduced GSCs. P value and chi-square value obtained by Chi-square test. p Orthotopic xenograft experiments to assess the effects of MACROH2A2 knockdown on survival of transplanted mice. Patient-derived GSCs carrying either scrambled control shRNA constructs (shScr; n = 10; one mouse censored) or independent shRNAs targeting MACROH2A2 (shMH2A2a/b; n = 10 mice per group) were transplanted orthotopically in immunocompromised mice. P values were calculated with the log-rank test.
Fig. 3
Fig. 3. macroH2A2 knockdown leads to enhanced proneural phenotypes in vivo and inhibits CD44-positive cell states.
a, b Representative whole-mount hematoxylin-eosin images of mouse tumors. Scale bar: 1 mm. The experiment was performed once on three mouse tumors per condition. ch Confocal microscopy images of Ki-67 and human nucleus staining from scramble [merge (c), Ki-67 (d), and human nucleus (e)] and shMH2A2 knockdown animals [merge (f), Ki-67 (g), and human nucleus (h)] Scale bar 20 mm. i Quantification of human Ki-67 positive cells in control versus knockdown mice (p value: two-tailed unpaired T-test); quantification performed over three 10x fields and repeated in two animals). Error bars represent standard deviation. j Quantification of ASCL1-Ki-67 immunohistochemistry in G523 xenograft mice, across n = 8 and n = 12 independent low-power fields in n = 2 distinct animals. The experiment was repeated twice. P value: two-tailed unpaired T-test with Welch’s correction. The boxplot line represents the median, hinges at 25th and 75th percentiles, and whiskers at 1.5 × IQR. k Quantification of CD44 signal in mouse xenografts (p = 0.0231; two-tailed unpaired T-test); experiment performed in two animals and quantified over at least seven 10x fields. Error bars represent standard deviation. ln Flow cytometric analysis of CD44 signal in G523 cells; representative scatterplots of control (l) and knockdown (m) along with quantification (n) performed with three biological replicates (p versus shMH2A2a 0.005531 and 0.001811 versus control for CD44-low and CD44-high cells; two-tailed two-tailed unpaired T-test with Welch’s correction). Error bars represent standard deviation.
Fig. 4
Fig. 4. MacroH2A2 contributes to both compacted and accessible chromatin at neurodevelopmental genes in GBM.
a Heatmap of differentially accessible regions (n = 270) in two biological replicates of MACROH2A2/macroH2A2 knockdown versus control cells. b CIBERSORTx deconvolution of estimated cell states in control versus knockdown cells, averaged across two biological replicates (p value 0.02 for NPC1, 0.03 for OPC; 0.14 for MES2; 0.12 for AC; 0.28 for NPC2). P values by T-test with Welch’s correction. c Top ten motifs enriched in peaks gained upon macroH2A2 knockdown (P value by hypergeometric test). d Top ten motifs enriched in peaks lost upon macroH2A2 knockdown (P value by hypergeometric test). e Top process terms resulting from Gene Ontology term analysis of peaks gained upon macroH2A2 knockdown (P value by hypergeometric test). f, g Permutation analysis of accessible regions gained (f) and lost (g) upon MACROH2A2/macroH2A2 knockdown at enhancer elements genome-wide. Results were obtained from n = 500 permutations of n = 94 (f) and n = 176 (g) independent genomic regions. The boxplot line represents the median, hinges at 25th and 75th percentiles, and whiskers at 1.5 × IQR. P value by hypergeometric test.
Fig. 5
Fig. 5. macroH2A2 represses enhancer elements linked to neurodevelopmental genes.
a, b Examples of ATAC-seq enhancer peaks gained upon knockdown of MACROH2A2/macroH2A2. c Expression of eRNA at the COL20A1 locus shown in (b) in control versus knockdown cells. Two biological replicates were used to generate RNA-seq libraries. P value was obtained by a two-tailed unpaired T-test with Welch’s correction. d Differentially accessible chromatin regions identified upon MACROH2A2/macroH2A2 knockdown in a scATAC-seq sample from four primary glioblastoma resections. The horizontal axis represents individual cells in the specimens, with differentially accessible regions listed along the Y axis. e Accessibility at the COL20A1 enhancer in a scATAC-seq dataset generated from four primary GBM surgical specimens. Samples are separated by arcs. f Top positively enriched motifs at COL20A1 accessible cells in primary glioblastoma resections. g Top negatively enriched motifs at COL20A1 accessible cells in primary glioblastoma resections.
Fig. 6
Fig. 6. Characterization of chromatin binding patterns of macroH2A2 in glioblastoma stem cells.
a Immunofluorescence microscopy of FLAG-tagged GSC3 tumor cells versus control. Scale bar: 10 mm. The experiment was performed twice on two independent FLAG-tagged clones. b Overview of endogenous tagging strategy. ssODN single-stranded oligodeoxynucleotide template. c Heatmap of signal correlation between FLAG-macroH2A2-IP samples and control. d Fingerprint plot of FLAG-macroH2A2 ChIP samples versus control. e Example of a peak call and associated signal track. f Top ten motifs associated with ChIP-seq macroH2A2 peaks. P value: hypergeometric test with Benjamini correction. g Top Gene Ontology terms associated with macroH2A2 peaks. P value: hypergeometric test with Benjamini correction. h Permutation analysis of macroH2A2 peaks examining overlap with ATAC peaks (n = 500 permutations; P value by hypergeometric test). i Permutation analysis of ATAC-seq peaks that gain accessibility in knockdown cells overlapping with macroH2A2 peaks. (n = 500 permutations; P value by hypergeometric test). The boxplot line represents the median, hinges at 25th and 75th percentiles, and whiskers at 1.5 × IQR. j Venn diagram comparing macroH2A2 peaks, ATAC-seq peaks, and their overlap (p value—expected overlap by Fisher’s test). k Pearson correlation of signal across the entire genome between macroH2A2-IP samples and control and knockdown ATAC-seq samples. Pairwise comparisons across n = 3 biological ChIP replicates and n = 2 biological ATAC replicates. Error bars represent standard deviation. P value calculated by Wilcoxon test. l Relative distance plot showing the fraction of overlaps versus expected for macroH2A2 peaks compared to ATAC-seq peaks. Each point represents an average of n = 3 biological replicates of ChIP. Error bars represent standard deviation. P value by unpaired T-test with Welch’s correction. m Top 10 ATAC-seq enhancer elements which overlap macroH2A2 peaks sorted by differential accessibility.
Fig. 7
Fig. 7. Identification of chemical compounds that elevate macroH2A2 levels in GBM cells.
a Diagram summarizing our screening strategy to identify compounds that increase macroH2A2 levels. b Normalized density of the log fold change of macroH2A2 positive cells for all compounds in the screen. The green-shaded region represents compounds with greater than a twofold change of macroH2A2 positive cells. c Effects of MI-3 at 1 uM and vehicle control (dmso) on macroH2A2 protein levels were assessed by immunofluorescence. Scale bars: 50 mm. Representative images from one of three biological replicates. The experiment was performed once. d Western blot of macroH2A2 levels after 7 days of treatment with 200 nM of MI-3. Three replicates per condition. e Limiting dilution assay of macroH2A2 knockdown cells versus control GSCs treated with either DMSO or 500 nM of MI-3. Sphere formation estimates from n = 6 biological replicates. P value determined by Chi-square test. Error bars represent a 95% confidence interval of the sphere formation frequency estimate. f Heatmap displaying the top 50 differentially expressed genes between MI-3 and DMSO-treated cells based on RNA-seq data (three biological replicates per treatment). Error bars represent standard deviation. g CIBERSORTx analysis of transcriptional subtypes in MI-3 data (p values: G2M 0.0129; G1S 0.024; NPC 0.029; MES 0.022; two-tailed unpaired T-test with Welch’s correction; n = 2 biological replicates per condition). h Western blot showing levels of PDGFRA and TNFR in MI-3 and DMSO-treated GBM cells after 7 days of treatment in vitro. Three biological replicates per condition. The experiment was repeated two times.
Fig. 8
Fig. 8. macroH2A2 is a positive modulator of viral mimicry pathways in GBM.
a GSEA analysis showing increased interferon signaling in MI-3-treated versus vehicle-treated cells. P value represents the hypergeometric test and q value represents the false-discovery corrected P value. b Overlap of interferon-sensitive genes (ISGs) showing expression changes upon MI-3 treatment compared to ISGs differentially expressed upon macroH2A2 knockdown. c Transcriptional levels of LINE repeat elements upon MI-3 treatment were determined by RNA-seq. df Staining for double-stranded RNA in vehicle-treated (g) and MI-3 treated (h) GSC3 GBM cells. Scale bar: 25 mm. i Quantification of dsRNA signal per cell in vehicle versus MI-3 treated cells. P value obtained by Mann–Whitney test. The experiment was repeated twice in two different cell lines (G523, GSC3). g–i Immunofluorescence staining for double-stranded RNA and CD44 (g) in vehicle treated versus MI-3 treated control or shMH2A2 G523 GBM cells. Scale bar: 10 microns. h Quantification of dsRNA signal in vehicle versus MI-3 treated cells per cell in at least n = 3 60x fields per condition. P value obtained by two-tailed two-tailed unpaired T-test with Welch’s correction. The boxplot line represents the median, hinges at 25th and 75th percentiles, and whiskers at 1.5 × IQR. i Quantification of the proportion of CD44-positive cells in at least n = 3 60x fields in each condition. The boxplot line represents the median, hinges at 25th and 75th percentiles, and whiskers at 1.5 × IQR. P value obtained by two-tailed two-tailed unpaired T-test with Welch’s correction. The experiment was repeated twice. j Proposed model for the mechanisms of action of macroH2A2 in GSCs.

References

    1. Stupp, R. et al. Radiotherapy plus concomitant and adjuvant temozolomide for glioblastoma. N. Engl. J. Med.10.1056/NEJMoa043330 (2005). - PubMed
    1. Chen J, et al. A restricted cell population propagates glioblastoma growth after chemotherapy. Nature. 2012;488:522–526. doi: 10.1038/nature11287. - DOI - PMC - PubMed
    1. Yip S, et al. MSH6 mutations arise in glioblastomas during temozolomide therapy and mediate temozolomide resistance. Clin. Cancer Res. 2009;15:4622–4629. doi: 10.1158/1078-0432.CCR-08-3012. - DOI - PMC - PubMed
    1. Cahill, D. P. et al. Loss of the mismatch repair protein MSH6 in human glioblastomas is associated with tumor progression during temozolomide treatment. Clin. Cancer Res.10.1158/1078-0432.CCR-06-2149 (2007). - PMC - PubMed
    1. Hunter, C. et al. A hypermutation phenotype and somatic MSH6 mutations in recurrent human malignant gliomas after alkylator chemotherapy. Cancer Res.10.1158/0008-5472.CAN-06-0127 (2006). - PMC - PubMed

Publication types

Grants and funding