. 2023 May 27;13(1):8634.
doi: 10.1038/s41598-023-35834-w.

Myeloid MyD88 restricts CD8+ T cell response to radiation therapy in pancreatic cancer

Affiliations

Myeloid MyD88 restricts CD8+ T cell response to radiation therapy in pancreatic cancer

Terry R Medler et al. Sci Rep. .

Abstract

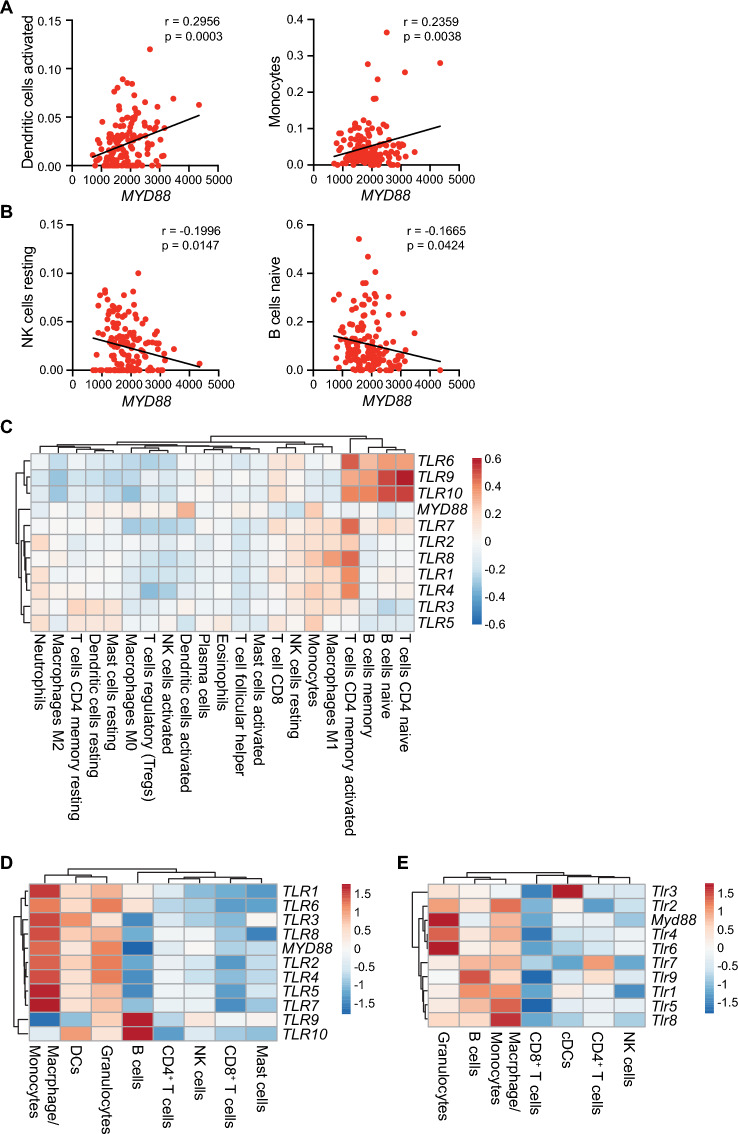
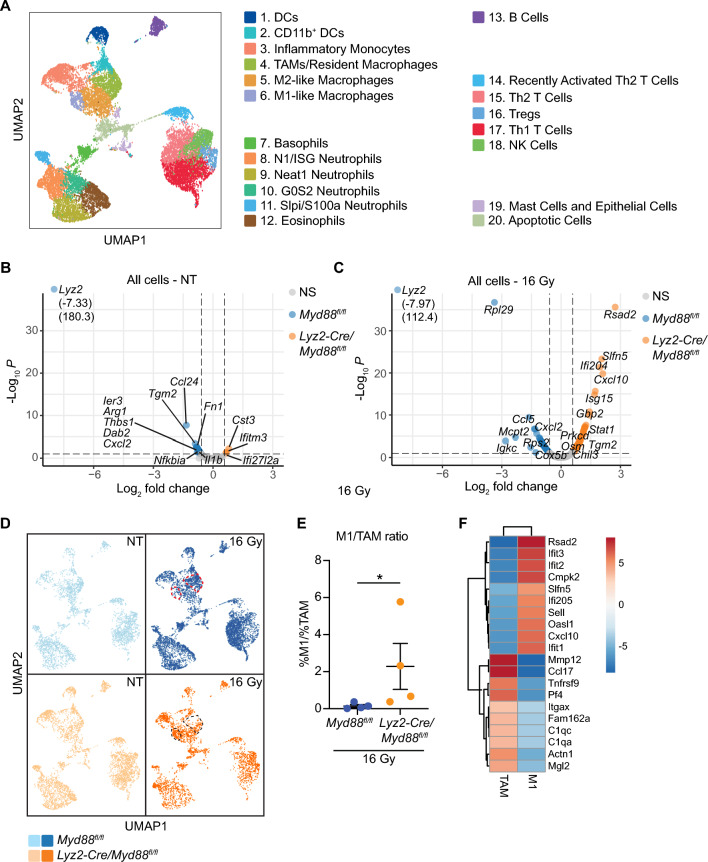
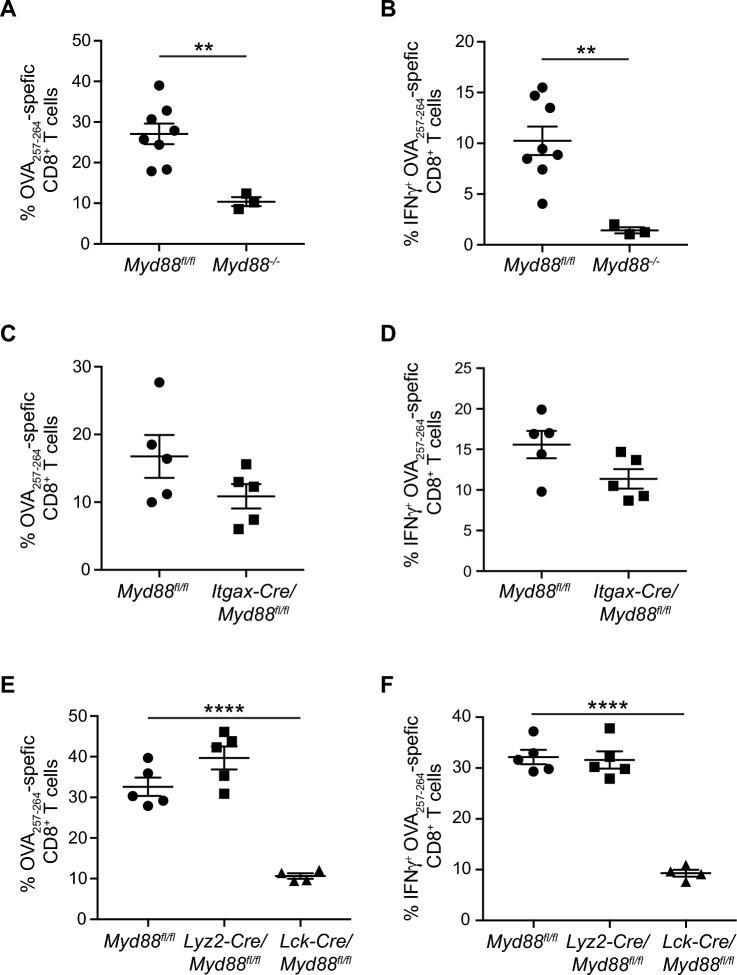
Radiation therapy induces immunogenic cell death in cancer cells, whereby released endogenous adjuvants are sensed by immune cells to direct adaptive immune responses. TLRs expressed on several immune subtypes recognize innate adjuvants to direct downstream inflammatory responses in part via the adapter protein MyD88. We generated Myd88 conditional knockout mice to interrogate its contribution to the immune response to radiation therapy in distinct immune populations in pancreatic cancer. Surprisingly, Myd88 deletion in Itgax (CD11c)-expressing dendritic cells had little discernable effects on response to RT in pancreatic cancer and elicited normal T cell responses using a prime/boost vaccination strategy. Myd88 deletion in Lck-expressing T cells resulted in similar or worsened responses to radiation therapy compared to wild-type mice and lacked antigen-specific CD8+ T cell responses from vaccination, similar to observations in Myd88-/- mice. Lyz2-specific loss of Myd88 in myeloid populations rendered tumors more susceptible to radiation therapy and elicited normal CD8+ T cell responses to vaccination. scRNAseq in Lyz2-Cre/Myd88fl/fl mice revealed gene signatures in macrophages and monocytes indicative of enhanced type I and II interferon responses, and improved responses to RT were dependent on CD8+ T cells and IFNAR1. Together, these data implicate MyD88 signaling in myeloid cells as a critical source of immunosuppression that hinders adaptive immune tumor control following radiation therapy.


Conflict of interest statement

M.J.G. and M.R.C. received research funding from Bristol Myers-Squibb, Jounce, and VIR Biotech that was unrelated to this manuscript. M.R.C has performed consultancy for Roche. The remaining authors declare no conflicts of interest.

Figures

Figure 1
Figure 1
MYD88 and TLR expression in human and murine pancreatic cancer. (A) Linear regression analysis showing positive (A) and negative (B) Pearson correlation between MYD88 expression and inferred presence of indicated immune subsets as estimated by CIBERSORT in the PAAD TCGA dataset (n = 149). (C) Heatmap showing linear regression analysis of TLR and MYD88 expression with presence of immune subsets as inferred by CIBERSORT in the PAAD TCGA dataset (n = 149). Positive Pearson correlations are indicated in shades of red, while negative correlations appear in blue. Data were visualized using ClustVis. See Supplemental Fig. 1B for p values. (D) scRNAseq analysis on publicly available human PDAC samples. Relative gene expression was assessed on PTPRC+ (CD45+) immune cells in PDAC, with non-immune cells excluded from analysis. Depicted are log2 fold change expression levels of indicated TLR genes and MYD88 in Itgam+Csf1r+CD68+ macrophages/monocytes; CD1A+, CD1B+, or CD1E+ DCs; CSF1R-CSF3R+ granulocytes; CD79A+ B cells; CD3E+CD4+ CD4+ T cells; CD3E-KLRC1+ NK cells; CD3E+CD8B+ CD8+ T cells; and CPA3+ mast cells. (E) scRNAseq was performed on CD45+ cells isolated from untreated PK5L1940 tumors in Myd88fl/fl mice (n = 4 mice). Depicted are log2 fold change expression levels of indicated Tlr genes and Myd88 in Itgam+Csf3r+Ly6c2 granulocytes, Cd79b+ B cells, Itgam+Csf1r+Adgre+ macrophages/monocytes, Cd3e+Cd8a+ CD8+ T cells, Zbtb46+ cDCs, Cd3e+Cd4+ CD4+ T cells, and Klrb1c+ NK cells. Significance in (AC) was assessed by Pearson correlation, with p values as indicated in (A,B). See also Supplemental Fig. 1B.
Figure 2
Figure 2
Myeloid MyD88 restricts response to RT in pancreatic cancer. (A) Survival curves (left) and individual Panc02-SIY tumor growth curves (right) in untreated mice of the indicated genotype (n = 4–11 mice per group). (B) Survival curves (left) and individual Panc02-SIY tumor growth curves (right) in mice of the indicated genotype treated with 16 Gy RT (n = 7–26 mice per group). (C) Survival curves (left) and individual PK5L1940 tumor growth curves (right) in untreated mice of the indicated genotype (n = 6–8 mice per group). (D) Survival curves (left) and individual PK5L1940 tumor growth curves (right) in mice of the indicated genotype treated with 16 Gy RT (n = 7–10 mice per group). Numbers in the upper right of individual tumor growth curves in (AD) represent the proportion of mice cured by RT. Significance in (AD) was assessed by log-rank test. * p < 0.05; ** p < 0.01.
Figure 3
Figure 3
scRNAseq in untreated and RT-treated tumors from Myd88fl/fl and Lyz2-Cre/Myd88fl/fl mice. scRNAseq was performed on CD45+ cells isolated from untreated tumors or 3d post-RT in Lyz2-Cre/Myd88fl/fl mice and Myd88fl/fl mice (n = 4 mice per group). (A) Cells were subjected to graph-based clustering using the Loupe Cell Browser, with the UMAP plot of unsupervised clustering shown. Dominant cell types within each cluster were identified using expression of known markers (see also Supplemental Fig. S3,S4). (B,C) Volcano plots representing a global view of differential gene expression in CD45+ cells that are upregulated in Lyz2-Cre/Myd88fl/fl mice (right, orange) or upregulated in Myd88fl/fl mice (left, blue) in untreated mice (B) or mice treated with 16 Gy RT (C). (D) UMAPs were split according to genotype and treatment, with cells from Lyz2-Cre/Myd88fl/fl mice identified in orange and Myd88fl/fl mice identified in blue. Untreated mice are depicted in the lighter shade, while mice treated with 16 Gy RT are shown in the darker shade. TAM and M1 macrophage clusters are circled in either red or black in 16 Gy treated mice. (E) Graph depicting the ratio of M1:TAM populations as a percentage of total immune cells in Lyz2-Cre/Myd88fl/fl mice treated with 16 Gy compared to Myd88fl/fl mice treated with 16 Gy. (F) Top 10 genes upregulated in M1 and TAM populations. Significance of differential gene expression in (B,C) was defined as fold change > 1.5 and p < 0.1. Significance in (E) was determined by Mann–Whitney test, * p < 0.05.
Figure 4
Figure 4
Enhanced interferon responses characterize infiltrating macrophages and monocytes in tumors from Lyz2-Cre/Myd88fl/fl mice. scRNAseq was performed on CD45+ cells isolated from untreated tumors or 3d post-RT in Lyz2-Cre/Myd88fl/fl mice and Myd88fl/fl mice (n = 4 mice per group). (A) Volcano plot of differential gene expression in macrophages and monocytes (Itgam+Csf1r+Adgre1+ cells) that are upregulated in Lyz2-Cre/Myd88fl/fl mice (right, orange) or upregulated in Myd88fl/fl mice (left, blue). (B) Violin plots of select genes from (A). (C) Canonical pathway analysis using Ingenuity Pathway Analysis extrapolating likely pathways activated in Lyz2-Cre/Myd88fl/fl mice treated with 16 Gy RT based off of significant differential gene expression from (A). (D) Upstream analysis based off of significant differential gene expression from (A) using Ingenuity Pathway Analysis, which identifies likely regulators that explain differential gene expression patterns observed in Lyz2-Cre/Myd88fl/fl mice (top, orange) or Myd88fl/fl mice (bottom, blue). (E) Quantitation of TNFα (left), IL-10 (center), and IL-6 (right) in supernatants of BMMΦs of the indicated genotype 24 h after treatment with 100 ng/mL LPS as measured by the ProcartaPlex platform. Significance of differential gene expression in (A) was defined as fold change > 1.5 and p < 0.1. Significance in (E) was assessed by an unpaired, two-sided t-test. * p < 0.05, ** p < 0.01, **** p < 0.0001.
Figure 5
Figure 5
Myd88 expression in T cells is required for antigen-specific CD8+ T cell responses to vaccination. (A,C,E) Flow cytometric analysis of Ova-specific CD8+ T cells in splenocytes isolated from Myd88−/− mice (A), Itgax-Cre/Myd88fl/fl mice (C), or Lck-Cre/Myd88fl/fl mice and Lyz2-Cre/Myd88fl/fl mice (E) compared to Myd88fl/fl mice after vaccination with ∆ActA-Ova L. monocytogenes. (B,D,F) Same as in (A,C,E, respectively), except splenocytes were stimulated with Ova257–264 (SL8) peptide prior to flow cytometric analysis in the presence of brefeldin A to assess IFNγ positivity in Ova-specific CD8+ T cells. Each data point represents a single mouse (n = 3–8 mice per group). Significance was assessed by an unpaired, two-sided t-test (AD), and one-way ANOVA (E,F). Data are represented as means ± SEM. ** p < 0.01; **** p < 0.0001.
Figure 6
Figure 6
Improved response to RT in Lyz2-Cre/Myd88fl/fl mice is dependent on CD8+ T cells and Type I IFN. (A) Survival curves (left) and individual Panc02-SIY tumor growth curves (right) in Lyz2-Cre/Myd88fl/fl mice treated with 16 Gy RT and αCD8 mAb (n = 9–10 mice per group). Numbers in the upper right of individual tumor growth curves represent the proportion of mice cured by RT. (B,C) Differential gene expression analysis of Panc02-SIY whole tumor lysates from Lyz2-Cre/Myd88fl/fl mice and Myd88fl/fl mice treated with 16 Gy RT as determined by NanoString analysis using the PanCancer Immune Profiling gene set (n = 2 mice per group; experiment performed once). (B) Volcano plot of genes significantly upregulated (fold change > 1.5, p < 0.1) in Lyz2-Cre/Myd88fl/fl mice (right, orange; n = 2) or upregulated in Myd88fl/fl mice (left, blue; n = 2). (C) Ingenuity Pathway Analysis of downstream functions likely resulting from differences in gene expression in Lyz2-Cre/Myd88fl/fl mice compared to Myd88fl/fl mice. (D) Survival curves (top) and individual PK5L1940 tumor growth curves (bottom) in Myd88fl/fl (WT) mice and Lyz2-Cre/Myd88fl/fl mice treated with 16 Gy RT and αIFNAR1 mAb (n = 7–9 mice per group). Numbers in the upper right of individual tumor growth curves represent the proportion of mice cured by RT. Significance in (A and D) was determined by log-rank test. Significance of differential gene expression in (B,C) was defined as fold change > 1.5 and p < 0.1, with the experiment performed once. Data are represented as means ± SEM. * p < 0.05; **** p < 0.0001.

Similar articles

Cited by

References

    1. Medler T, et al. Activating the nucleic acid-sensing machinery for anticancer immunity. Int. Rev. Cell Mol. Biol. 2019;344:173–214. doi: 10.1016/bs.ircmb.2018.08.006. - DOI - PMC - PubMed
    1. Garg AD, et al. Molecular and translational classifications of DAMPs in immunogenic cell death. Front. Immunol. 2015;6:588. doi: 10.3389/fimmu.2015.00588. - DOI - PMC - PubMed
    1. Pichler M, et al. Histologic tumor necrosis is an independent prognostic indicator for clear cell and papillary renal cell carcinoma. Am. J. Clin. Pathol. 2012;137:283–289. doi: 10.1309/AJCPLBK9L9KDYQZP. - DOI - PubMed
    1. Pollheimer MJ, et al. Tumor necrosis is a new promising prognostic factor in colorectal cancer. Hum. Pathol. 2010;41:1749–1757. doi: 10.1016/j.humpath.2010.04.018. - DOI - PubMed
    1. Atanasov G, et al. Tumor necrosis and infiltrating macrophages predict survival after curative resection for cholangiocarcinoma. Oncoimmunology. 2017;6:e1331806. doi: 10.1080/2162402X.2017.1331806. - DOI - PMC - PubMed

Publication types

Substances