. 2023 May 27;13(1):8611.
doi: 10.1038/s41598-023-35836-8.

Circulating miRNA expression in long-standing type 1 diabetes mellitus

Affiliations

Circulating miRNA expression in long-standing type 1 diabetes mellitus

Paula Morales-Sánchez et al. Sci Rep. .

Abstract

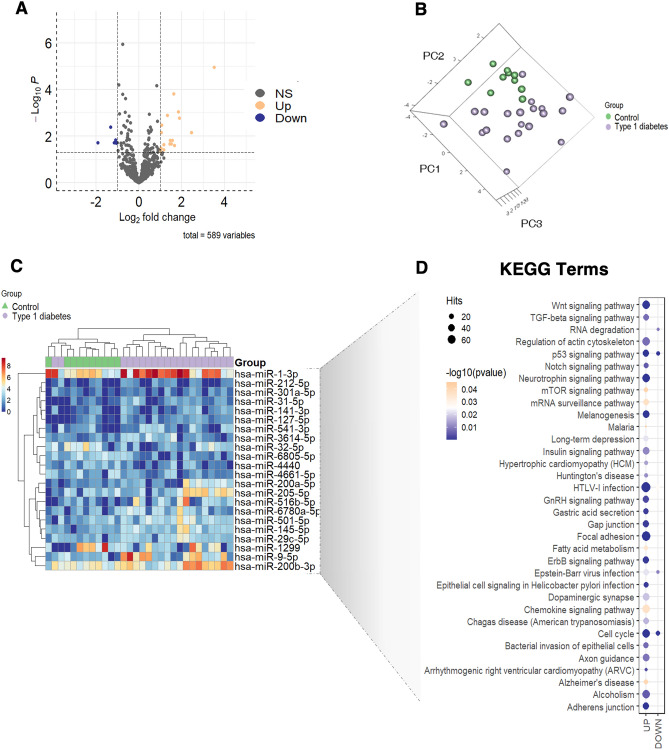
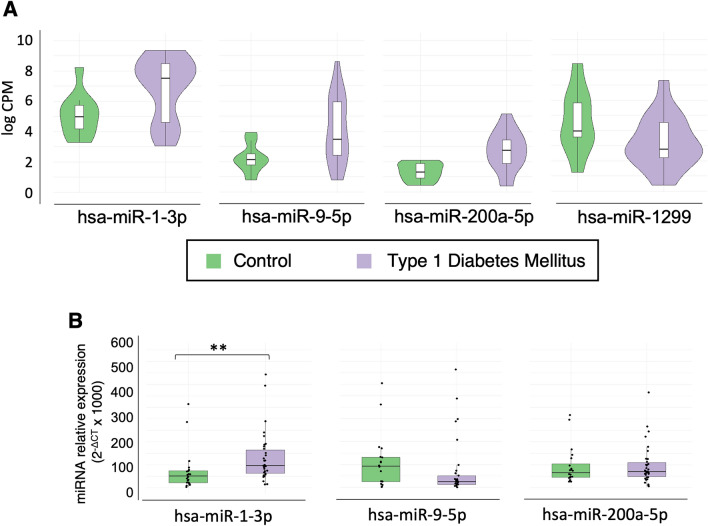
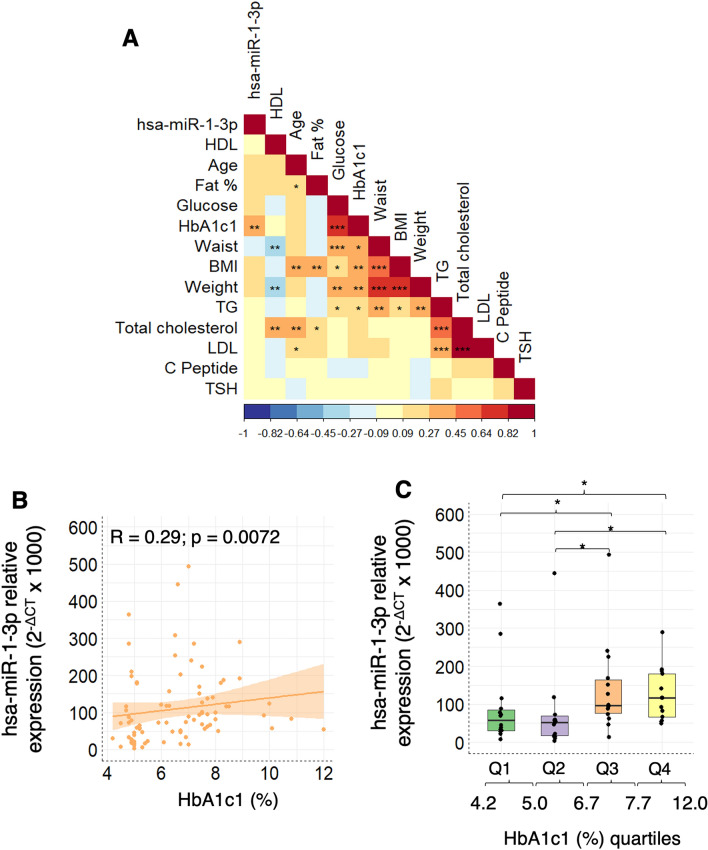
Type 1 diabetes is a chronic autoimmune disease which results in inefficient regulation of glucose homeostasis and can lead to different vascular comorbidities through life. In this study we aimed to analyse the circulating miRNA expression profile of patients with type 1 diabetes, and with no other associated pathology. For this, fasting plasma was obtained from 85 subjects. Next generation sequencing analysis was firstly performed to identify miRNAs that were differentially expressed between groups (20 patients vs. 10 controls). hsa-miR-1-3p, hsa-miR-200b-3p, hsa-miR-9-5p, and hsa-miR-1200 expression was also measured by Taqman RT-PCR to validate the observed changes (34 patients vs. 21 controls). Finally, through a bioinformatic approach, the main pathways affected by the target genes of these miRNAs were studied. Among the studied miRNAs, hsa-miR-1-3p expression was found significantly increased in patients with type 1 diabetes compared to controls, and positively correlated with glycated haemoglobin levels. Additionally, by using a bioinformatic approach, we could observe that changes in hsa-miR-1-3p directly affect genes involved in vascular development and cardiovascular pathologies. Our results suggest that, circulating hsa-miR-1-3p in plasma, together with glycaemic control, could be used as prognostic biomarkers in type 1 diabetes, helping to prevent the development of vascular complications in these patients.


Conflict of interest statement

The authors declare that the research was conducted in the absence of any commercial or financial relationships that could be construed as a potential conflict of interest.

Figures

Figure 1
Figure 1
Plasma miRNA profile by next-generation sequencing (NGS) in the discovery cohort. (A) Volcano plot showing the 589 variables detected by NGS. Orange dots (up) refer to overexpressed miRNAs and dark blue dots (down) to downregulated miRNAs according to the differential expression criteria described (log2FC greater than 1 and less than − 1, with a p value less than 0.05). (B) 3D-principle component analysis (3D-PCA) of circulating miRNA expression in the discovery cohort. 3D-PCA decomposition of the 22 differential expressed miRNAs could distinguish most diabetes (purple) cases from the control (green) group in the NGS discovery cohort. (C) Heatmap representation of the expression levels of the 22 differential miRNAs expressed in log2CPM. (D) KEGG dotplot showing pathway terms with p value less than 0.05 for genes that are predicted in miRNet as controlled by upregulated (UP) and downregulated (DOWN) miRNAs.
Figure 2
Figure 2
Box plots of differentially expressed circulating miRNAs in the discovery cohort using NGS approach. (A) NGS log CPM expression of selected miRNAs. (B) RT-PCR expression of NGS selected miRNAs. Significance: p values < 0.05 (*), < 0.01 (**), < 0.001 (***).
Figure 3
Figure 3
(A) hsa-miR-1-3p predicted target genes and the KEGG pathways in which they are involved. miRNAs’ network of targets predicted by miRNet. (B) PieDonut plots referencing the number of disease-related terms in hsa-miR-1-3p. Curated experiment-supported evidence for human miRNA and disease associations in the Human microRNA Disease Database. The inner circumference represents the percentage of terms found for each miRNA with respect to the total. While the external one shows the percentages of each major term related to a disease within the miRNAs.
Figure 4
Figure 4
(A) Matrix correlation plot between hsa-miR-1-3p and clinical parameters for all samples (n = 55) included in the validation cohort. (B) Linear correlation plot between hsa-miR-1-3p and HbA1c percentage. (C) hsa-miR-1-3p expression among the different HbA1c1 quartiles. Significance expressed as: < 0.05 (*), < 0.01 (**) or < 0.001 (***).

References

    1. DiMeglio LA, Evans-Molina C, Oram RA. Type 1 diabetes. Lancet. 2018 doi: 10.1016/S0140-6736(18)31320-5. - DOI - PMC - PubMed
    1. Cerna M. Epigenetic regulation in etiology of type 1 diabetes mellitus. Int. J. Mol. Sci. 2020;21:3005. doi: 10.3390/ijms21083005. - DOI - PMC - PubMed
    1. Holt RIG, et al. The management of type 1 diabetes in adults. A Consensus Report by the American Diabetes Association (ADA) and the European Association for the Study of Diabetes (EASD) Diabetes Care. 2021;44:2589–2625. doi: 10.2337/dci21-0043. - DOI - PubMed
    1. Makarova J, Turchinovich A, Shkurnikov M, Tonevitsky A. Extracellular miRNAs and cell–cell communication: Problems and prospects. Trends Biochem. Sci. 2021;46:640–651. doi: 10.1016/j.tibs.2021.01.007. - DOI - PubMed
    1. Deiuliis JA. MicroRNAs as regulators of metabolic disease: Pathophysiologic significance and emerging role as biomarkers and therapeutics. Int. J. Obes. (Lond.) 2016;40:88–101. doi: 10.1038/ijo.2015.170. - DOI - PMC - PubMed

Publication types

MeSH terms