. 2023 May 29;22(1):88.
doi: 10.1186/s12943-023-01792-0.

IGF2BP1 induces neuroblastoma via a druggable feedforward loop with MYCN promoting 17q oncogene expression

Affiliations

IGF2BP1 induces neuroblastoma via a druggable feedforward loop with MYCN promoting 17q oncogene expression

Sven Hagemann et al. Mol Cancer. .

Abstract

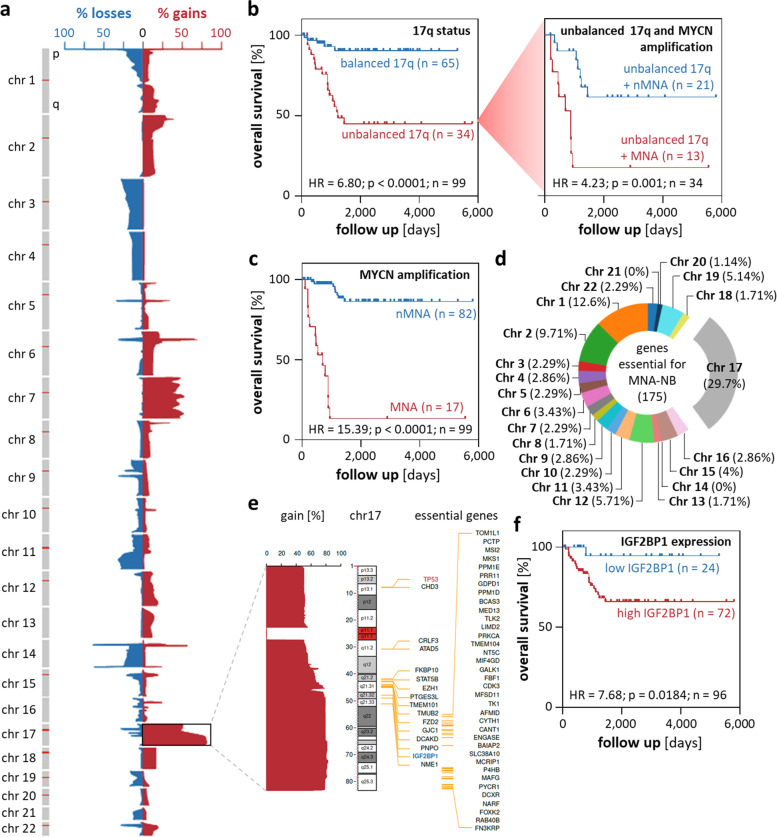
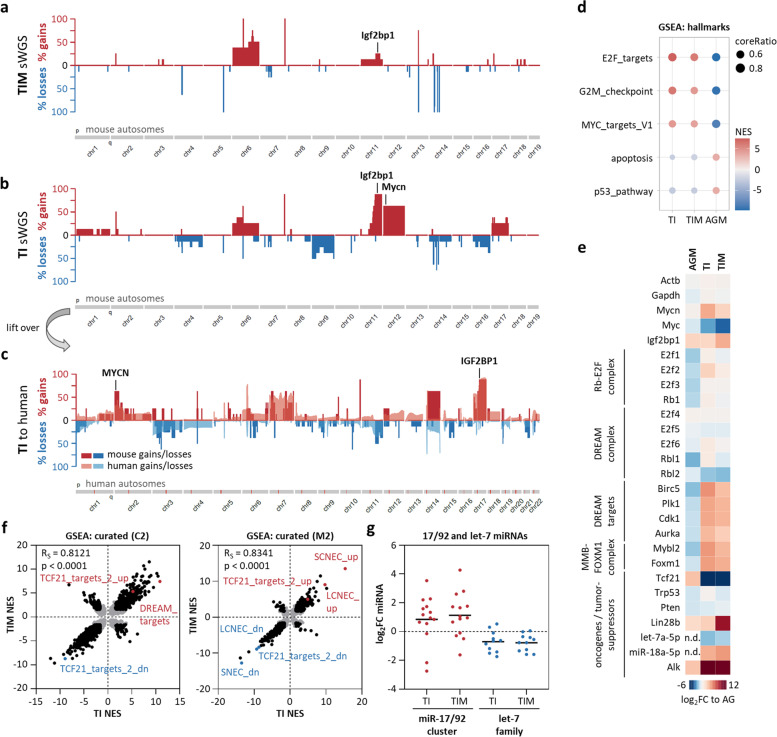
Background: Neuroblastoma is the most common solid tumor in infants accounting for approximately 15% of all cancer-related deaths. Over 50% of high-risk neuroblastoma relapse, emphasizing the need of novel drug targets and therapeutic strategies. In neuroblastoma, chromosomal gains at chromosome 17q, including IGF2BP1, and MYCN amplification at chromosome 2p are associated with adverse outcome. Recent, pre-clinical evidence indicates the feasibility of direct and indirect targeting of IGF2BP1 and MYCN in cancer treatment.

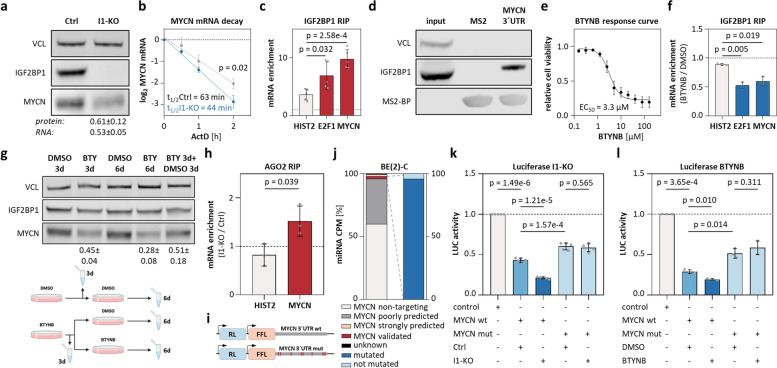
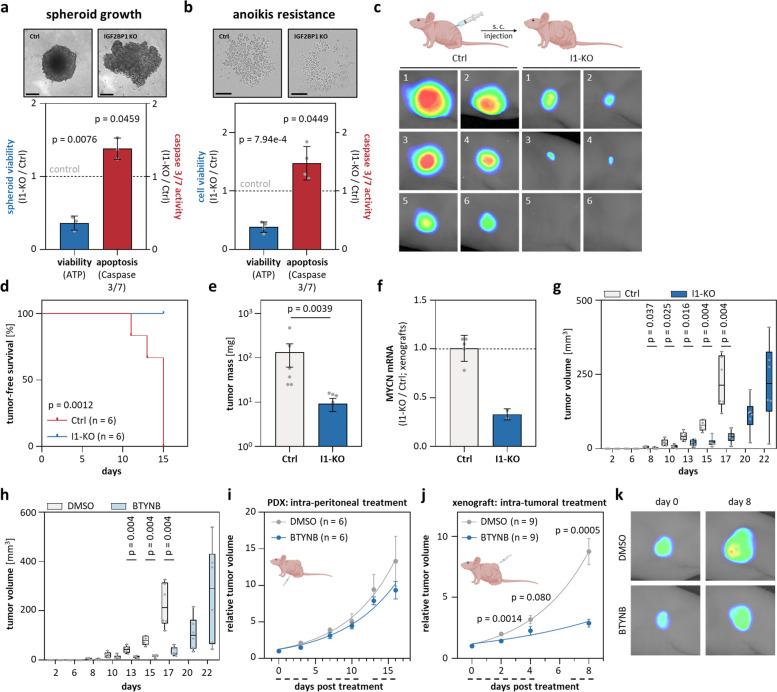
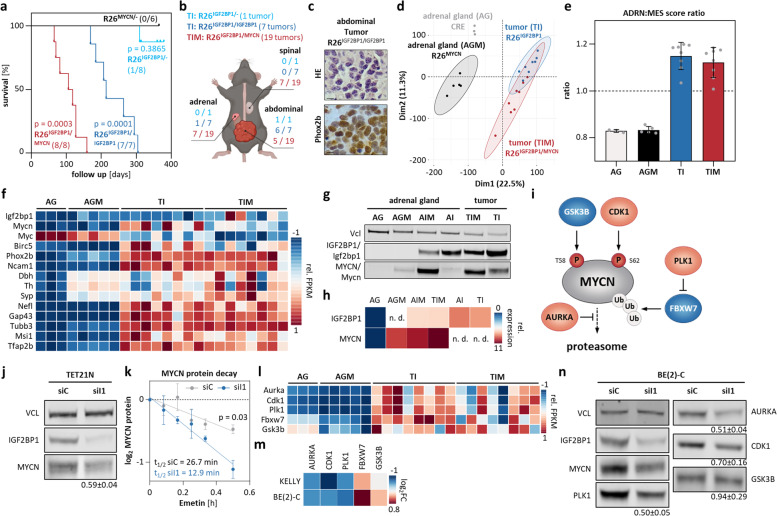
Methods: Candidate oncogenes on 17q were identified by profiling the transcriptomic/genomic landscape of 100 human neuroblastoma samples and public gene essentiality data. Molecular mechanisms and gene expression profiles underlying the oncogenic and therapeutic target potential of the 17q oncogene IGF2BP1 and its cross-talk with MYCN were characterized and validated in human neuroblastoma cells, xenografts and PDX as well as novel IGF2BP1/MYCN transgene mouse models.

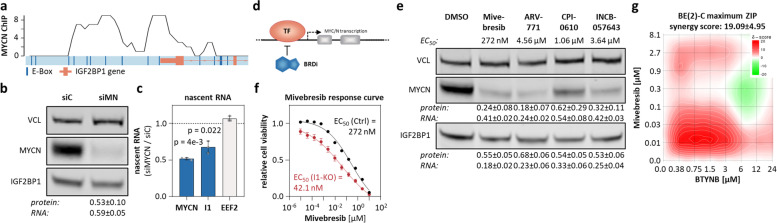
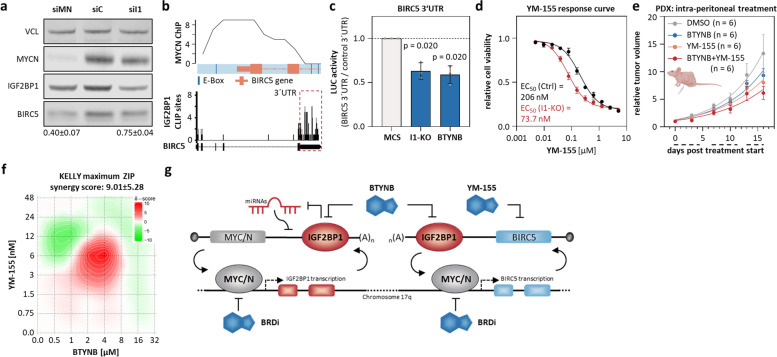
Results: We reveal a novel, druggable feedforward loop of IGF2BP1 (17q) and MYCN (2p) in high-risk neuroblastoma. This promotes 2p/17q chromosomal gains and unleashes an oncogene storm resulting in fostered expression of 17q oncogenes like BIRC5 (survivin). Conditional, sympatho-adrenal transgene expression of IGF2BP1 induces neuroblastoma at a 100% incidence. IGF2BP1-driven malignancies are reminiscent to human high-risk neuroblastoma, including 2p/17q-syntenic chromosomal gains and upregulation of Mycn, Birc5, as well as key neuroblastoma circuit factors like Phox2b. Co-expression of IGF2BP1/MYCN reduces disease latency and survival probability by fostering oncogene expression. Combined inhibition of IGF2BP1 by BTYNB, MYCN by BRD inhibitors or BIRC5 by YM-155 is beneficial in vitro and, for BTYNB, also.

Conclusion: We reveal a novel, druggable neuroblastoma oncogene circuit settling on strong, transcriptional/post-transcriptional synergy of MYCN and IGF2BP1. MYCN/IGF2BP1 feedforward regulation promotes an oncogene storm harboring high therapeutic potential for combined, targeted inhibition of IGF2BP1, MYCN expression and MYCN/IGF2BP1-effectors like BIRC5.

Keywords: 17q gain; BIRC5 (survivin); BTYNB; IGF2BP1; MYCN; Mivebresib; Neuroblastoma; PDX; RNA-binding protein (RBP); Transgenic mouse model; YM-155.


Conflict of interest statement

The authors declare no competing interests.

Figures

Fig. 1
Fig. 1
Unbalanced Chromosome 17q upregulates MNA neuroblastoma essential genes and indicates adverse disease outcome. a Frequency (%) of DNA copy number gains (red) and losses (blue) for chromosome 1 to 22 in 100 primary human neuroblastoma samples. b, c Kaplan–Meier survival analyses by Chr 17q balance status (b, left), MYCN amplification status in Chr 17q unbalanced tumors (b, right) and MYCN amplification status (c). d Genomic distribution of 175 autosomal essential genes in MNA neuroblastoma. e Genomic location and percentage gain of essential (black and IGF2BP1 in blue) neuroblastoma genes on Chr 17 in primary neuroblastoma (non-essential TP53 on 17p is highlighted red). f Kaplan–Meier survival analyses by IGF2BP1 mRNA expression (best cut-off)
Fig. 2
Fig. 2
IGF2BP1 stimulated MYCN expression is 3´UTR-, miRNA- and BTYNB-dependent. a Western blot (n = 6) and RT-qPCR (n = 5) analysis of MYCN expression upon IGF2BP1-KO (I1-KO) in BE(2)-C. b MYCN mRNA decay monitored by RT-qPCR in control (grey) and I1-KO (blue) BE(2)-C upon indicated time of actinomycin D (ActD) treatment (n = 3). c IGF2BP1-RIP analyses in parental BE(2)-C (n = 5). d Western blotting of miTRAP from BE(2)-C lysates using MS2-fused MYCN 3´UTR or MS2-RNA (n = 1). e BTYNB-response curve in BE(2)-C (n = 3). f IGF2BP1-RIP in BE(2)-C treated with DMSO or BTYNB (n = 3). g Western blot analysis of MYCN expression in BE(2)-C treated with BTYNB (BTY, n = 3) for 3 and 6 d or replacement of BTY by DMSO after 3 d treatment. Treatment scheme in lower panel. h AGO2-RIP analyses in I1-KO versus control BE(2)-C (n = 3). i Scheme of luciferase reporters constructs. j Expression of miRNAs in BE(2)-C (left) and mutated fraction of MYCN-targeting miRNA-binding sites (right). k, l Activity of indicated luciferase reporters in control and I1-KO (k, n = 5) or DMSO- and BTYNB-treated BE(2)-C (l, n = 3)
Fig. 3
Fig. 3
IGF2BP1 deletion and inhibition by BTNYB impairs xenograft tumor growth. a, b The viability and caspase3/7-activity of parental (Ctrl) and I1-KO BE(2)-C was analyzed in spheroid growth (a, n = 3) and anoikis-resistance studies (b, n = 4; bars a, 200 µm and b, 400 µm). c-e Tumor growth (n = 6) of Ctrl and I1-KO BE(2)-C s.c. xenografts was monitored by non-invasive infrared imaging (c), tumor-free survival (d) and final tumor mass (e). f RT-qPCR analysis of MYCN mRNA levels in excised xenograft tumors and non-palpable tumor cell mass upon I1-KO (Ctrl, n = 5; I1-KO, n = 2). g, h Tumor growth (n = 6) of Ctrl and I1-KO (g) or DMSO- and BTYNB-pretreated (h) BE(2)-C xenografts was monitored by tumor volume over time. i Tumor growth (n = 6) was monitored by relative volume of s.c. PDX tumors treated i.p. with DMSO (grey) or BTYNB (blue). Daily treatment in three cycles is indicated by dashed lines below the x-axis. j Tumor growth (n = 9) was monitored by relative volume of s.c. BE(2)-C treated i.t. with DMSO (grey) or 50 mg/kg BW BTYNB (blue). Daily treatment in two cycles is indicated by dashed lines below the x-axis. k Representative images of tumors at start (day 0) and final treatment (day 8)
Fig. 4
Fig. 4
MYCN-driven IGF2BP1 expression is impaired by BRD inhibitors. a MYCN ChIP-seq profile of the IGF2BP1 promoter region. E-Boxes, putative MYC/N-binding sites, are indicated in dark blue. The IGF2BP1 gene is depicted schematically in orange up to the beginning of the second intron. b Western blot (n = 3) and RT-qPCR (n = 6) analysis of IGF2BP1 expression upon MYCN (siMN) compared to control knockdown (siC) in BE(2)-C. c RT-qPCR (n = 3) analysis of indicated nascent mRNAs upon MYCN compared to control knockdown in BE(2)-C (I1—IGF2BP1). d Scheme of putative MYCN regulation by BRD (TF—transcription factor). e Western blot and RT-qPCR analysis of MYCN and IGF2BP1 expression upon treatment of BE(2)-C with indicated BRD inhibitors (n = 3). f Mivebresib response curve in control (black) and I1-KO (red) BE(2)-C (n = 4). g Relief plot depicting the ZIP synergy for combined treatment of BTYNB and Mivebresib in BE(2)-C (n = 3)
Fig. 5
Fig. 5
MYCN/IGF2BP1 feedforward regulation promotes expression of druggable oncogenes located on Chr 17q. a Western blot analysis of BIRC5 expression upon MYCN (siMN) or IGF2BP1 (siI1) compared to control (siC) knockdown in BE(2)-C (n = 3). b MYCN ChIP-seq profile of the BIRC5 promoter region (upper panel) and IGF2BP1-CLIP profile for the BIRC5 mRNA (lower panel). c BIRC5 3´UTR luciferase activity in I1-KO versus parental (Ctrl) and BTYNB- versus DMSO-treated BE(2)-C (n = 3). d YM-155 response curve in control (black) and I1-KO (red) BE(2)-C (n = 4). e Tumor growth (n = 6) was monitored by relative volume of s.c. PDX tumors treated i.p. with DMSO (grey), YM-155 (orange) or in combination of YM-155 and BTYNB (red). Daily treatment in three cycles is indicated by dashed lines below the x-axis. f Relief plot showing the ZIP synergy for combined treatment of BTYNB and YM-155 in KELLY (n = 3). g Scheme of transcriptional/post-transcriptional feedback regulation of MYC/N, IGF2BP1 and downstream effectors as well as treatment possibilities
Fig. 6
Fig. 6
IGF2BP1 induces neuroblastoma, Mycn expression, stabilizes MYCN protein and synergizes with MYCN in transgenic mice. a Kaplan–Meier survival analysis of heterozygous (cyan, n = 8) and homozygous (blue, n = 7) R26IGF2BP1, heterozygous R26MYCN (black, n = 6) and double transgenic R26IGF2BP1/MYCN (red, n = 8) mice. Numbers in brackets indicate tumor bearing mice. b Scheme of tumor location within mice. c Representative images of hematoxylin and eosin staining (HE, top) and Phox2b immunohistochemistry (bottom) indicative for neuroblastoma in R26IGF2BP1/IGF2BP1 mice (bars: 40 µm). d PCA of mouse adrenal glands and transgenic tumors. e Ratio of ADRN to MES signature of mouse adrenal glands and transgenic tumors. f Heatmap depicting row-scaled FPKM values of indicated murine mRNAs in adrenal glands derived from wildtype (n = 3, AG) or R26MYCN/− (n = 5, AGM) mice and tumors of R26IGF2BP1 (n = 8, TI) or R26IGF2BP1/MYCN (n = 8, TIM) mice. g Western blot analysis confirms IGF2BP1 or MYCN transgene expression in tumors and adrenal glands of representative mice (n = 1). h RT-qPCR analysis of human IGF2BP1 and MYCN mRNA in indicated mouse tissue (n. d.—not determined). i Scheme of MYCN protein regulation. j Western blot (n = 5) analysis of MYCN expression upon IGF2BP1 (siI1) compared to control (siC) knockdown in TET21N cells. k MYCN protein decay was monitored by Western Blot analysis in control (grey) and IGF2BP1 knockdown (blue) TET21N cells upon indicated time of emetin treatment (n = 3). l, m RNA-seq analysis of indicated mRNAs in mouse tissues (l) or upon transient IGF2BP1 knockdown in BE(2)-C and KELLY (m). n Western blot (n = 3) analysis of indicated proteins upon IGF2BP1 (siI1) compared to control (siC) knockdown in BE(2)-C
Fig. 7
Fig. 7
IGF2BP1-induced murine neuroblastoma comprises syntenic chromosomal aberrations and gene expression profiles observed in human high-risk disease. a-c Frequency (%) of DNA copy number gains (red) and losses (blue) for murine chromosome 1 to 19 in R26IGF2BP1/MYCN (a) or R26IGF2BP1 (b) tumors compared to wildtype adrenal glands and lift over of R26IGF2BP1 regions to the human genome (c, Chr 1–22). Overlay of human neuroblastoma sWGS is depicted in transparent colors (c). d Selected hallmark gene sets in R26IGF2BP1 (TI), R26IGF2BP1/MYCN (TIM) or R26MYCN (AGM) mice based on GSEA. e RNA-seq analysis of indicated mRNAs presented as log2 fold change (log2FC) compared to wildtype adrenal glands. f Correlation of NES values of C2 (left) and M2 (right) gene sets between TI and TIM. Non-significant gene sets are depicted in grey. g Log2FC of miRNAs from the miR-17–92 cluster and let-7 family between R26IGF2BP1 or R26IGF2BP1/MYCN tumors and normal adrenal gland tissue. SCNEC/LCNEC—genetic mouse model high-grade small/large-cell neuroendocrine lung carcinoma

References

    1. Kushner BH. Neuroblastoma: a disease requiring a multitude of imaging studies. J Nucl Med. 2004;45(7):1172–1188. - PubMed
    1. Park JR, Eggert A, Caron H. Neuroblastoma: biology, prognosis, and treatment. Hematol Oncol Clin North Am. 2010;24(1):65–86. doi: 10.1016/j.hoc.2009.11.011. - DOI - PubMed
    1. Pugh TJ, Morozova O, Attiyeh EF, Asgharzadeh S, Wei JS, Auclair D, Carter SL, Cibulskis K, Hanna M, Kiezun A, et al. The genetic landscape of high-risk neuroblastoma. Nat Genet. 2013;45(3):279–284. doi: 10.1038/ng.2529. - DOI - PMC - PubMed
    1. Bown N, Cotterill S, Lastowska M, O’Neill S, Pearson AD, Plantaz D, Meddeb M, Danglot G, Brinkschmidt C, Christiansen H, et al. Gain of chromosome arm 17q and adverse outcome in patients with neuroblastoma. N Engl J Med. 1999;340(25):1954–61. - PubMed
    1. Reinholz MM, Bruzek AK, Visscher DW, Lingle WL, Schroeder MJ, Perez EA, Jenkins RB. Breast cancer and aneusomy 17: implications for carcinogenesis and therapeutic response. Lancet Oncol. 2009;10(3):267–277. doi: 10.1016/S1470-2045(09)70063-4. - DOI - PMC - PubMed

Publication types

Substances