Meta-Analysis
. 2023 Aug 1;44(11):4372-4389.
doi: 10.1002/hbm.26387. Epub 2023 May 29.

The neural signature of reality-monitoring: A meta-analysis of functional neuroimaging studies

Affiliations
Meta-Analysis

The neural signature of reality-monitoring: A meta-analysis of functional neuroimaging studies

Layla Lavallé et al. Hum Brain Mapp. .

Abstract

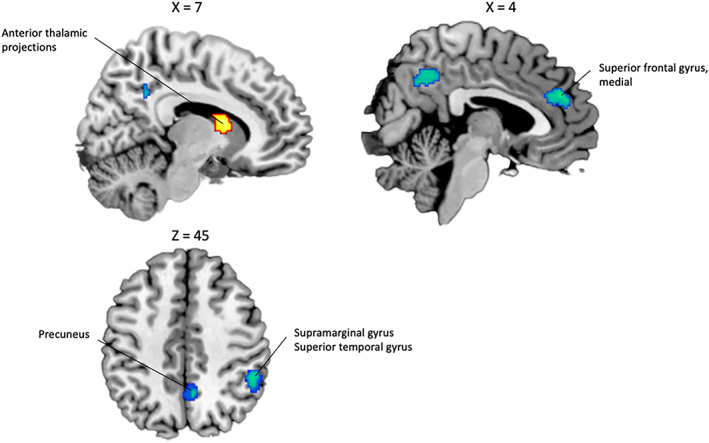
Distinguishing imagination and thoughts from information we perceived from the environment, a process called reality-monitoring, is important in everyday situations. Although reality monitoring seems to overlap with the concept of self-monitoring, which allows one to distinguish self-generated actions or thoughts from those generated by others, the two concepts remain largely separate cognitive domains and their common brain substrates have received little attention. We investigated the brain regions involved in these two cognitive processes and explored the common brain regions they share. To do this, we conducted two separate coordinate-based meta-analyses of functional magnetic resonance imaging studies assessing the brain regions involved in reality- and self-monitoring. Few brain regions survived threshold-free cluster enhancement family-wise multiple comparison correction (p < .05), likely owing to the small number of studies identified. Using uncorrected statistical thresholds recommended by Signed Differential Mapping with Permutation of Subject Images, the meta-analysis of reality-monitoring studies (k = 9 studies including 172 healthy subjects) revealed clusters in the lobule VI of the cerebellum, the right anterior medial prefrontal cortex and anterior thalamic projections. The meta-analysis of self-monitoring studies (k = 12 studies including 192 healthy subjects) highlighted the involvement of a set of brain regions including the lobule VI of the left cerebellum and fronto-temporo-parietal regions. We showed with a conjunction analysis that the lobule VI of the cerebellum was consistently engaged in both reality- and self-monitoring. The current findings offer new insights into the common brain regions underlying reality-monitoring and self-monitoring, and suggest that the neural signature of the self that may occur during self-production should persist in memories.

Keywords: coordinate-based meta-analysis; fMRI; reality-monitoring; self-monitoring.


Conflict of interest statement

The authors declare no conflict of interest.

Figures

FIGURE 1
FIGURE 1
Preferred Reporting Items for Systematic Reviews and Meta‐Analyses (PRISMA) flow diagram of the literature search for the reality‐monitoring (left) and self‐monitoring (right) meta‐analyses.
FIGURE 2
FIGURE 2
Examples of typical reality‐monitoring and self‐monitoring paradigms. Reality‐monitoring paradigms (left panel) typically consist of an encoding phase, in which participants are confronted with either perceived items or items that must be imagined (in the case of a visual reality‐monitoring paradigm, participants see a word and either see a corresponding picture or have to imagine a corresponding mental image). The encoding phase is followed by a retrieval phase, in which participants had to recall whether each item was actually perceived (seen) or only imagined. In typical self‐monitoring paradigms (right panel), participants perform a movement while receiving either congruent (e.g., visual feedback of their own movement) or incongruent feedback (e.g., visual feedback of a distorted movement). Participants are either asked to judge whether the movement was their own or not, or, in the case of implicit paradigms, no response is requested.
FIGURE 3
FIGURE 3
Significant brain functional activations and deactivations associated with reality‐monitoring (self > nonself) estimated by a whole‐brain meta‐analysis. The results are displayed based on the uncorrected threshold of p < .005 (minimum cluster size = 20 voxels) and overlaid on sagittal and axial sections of a normalized canonical template brain (ch2better) using MRIcron software. Coordinates are reported in Montreal Neurological Institute (MNI) space. The intensity color scale indicates Z‐score values (colors should be used for Figure 3 to print).
FIGURE 4
FIGURE 4
Significant brain functional activations and deactivations associated with self‐monitoring (self > nonself) estimated by a whole‐brain meta‐analysis. The results are displayed based on the uncorrected threshold of p < .005 (minimum cluster size = 20 voxels) and overlaid on sagittal and axial sections of a normalized canonical template brain (ch2better) using MRIcron software. Coordinates are reported in Montreal Neurological Institute (MNI) space. The intensity color scale indicates Z‐score values (colors should be used for Figure 4 to print).
FIGURE 5
FIGURE 5
Significant brain functional activations reflecting the overlap between reality‐monitoring and self‐monitoring whole‐brain meta‐analyses. The results are displayed based on the uncorrected threshold of p < .005 (minimum cluster size = 20 voxels) and overlaid on sagittal and axial sections of a normalized canonical template brain (ch2better) using MRIcron software. Coordinates are reported in Montreal Neurological Institute (MNI) space. The intensity color scale indicates Z‐score values (colors should be used for Figure 5 to print).
FIGURE 6
FIGURE 6
Significant brain functional activations reflecting the difference between reality‐monitoring and self‐monitoring whole‐brain meta‐analyses (Self‐monitoring > Reality‐monitoring contrast). The results are displayed based on the uncorrected threshold of p < .005 (minimum cluster size = 20 voxels) and overlaid on sagittal and axial sections of a normalized canonical template brain (ch2better) using MRIcron software. Coordinates are reported in Montreal Neurological Institute (MNI) space. The intensity color scale indicates Z‐score values (colors should be used for Figure 6 to print).

Similar articles

Cited by

References

    1. Alain, C. , McNeely, H. E. , He, Y. , Christensen, B. K. , & West, R. (2002). Neurophysiological evidence of error‐monitoring deficits in patients with schizophrenia. Cerebral Cortex, 12, 840–846. 10.1093/cercor/12.8.840 - DOI - PubMed
    1. Albajes‐Eizagirre, A. , Solanes, A. , & Radua, J. (2019). Meta‐analysis of non‐statistically significant unreported effects. Statistical Methods in Medical Research, 28, 3741–3754. 10.1177/0962280218811349 - DOI - PubMed
    1. Albajes‐Eizagirre, A. , Solanes, A. , Vieta, E. , & Radua, J. (2019). Voxel‐based meta‐analysis via permutation of subject images (PSI): Theory and implementation for SDM. NeuroImage, 186, 174–184. 10.1016/j.neuroimage.2018.10.077 - DOI - PubMed
    1. Andreasen, N. C. , O'Leary, D. S. , Paradiso, S. , Cizadlo, T. , Arndt, S. , Watkins, G. L. , Ponto, L. L. , & Hichwa, R. D. (1999). The cerebellum plays a role in conscious episodic memory retrieval. Human Brain Mapping, 8, 226–234. - PMC - PubMed
    1. Baess, P. , Horváth, J. , Jacobsen, T. , & Schröger, E. (2011). Selective suppression of self‐initiated sounds in an auditory stream: An ERP study. Psychophysiology, 48, 1276–1283. 10.1111/j.1469-8986.2011.01196.x - DOI - PubMed

Publication types