. 2023 Nov 2;25(11):2044-2057.
doi: 10.1093/neuonc/noad097.

Ex vivo to in vivo model of malignant peripheral nerve sheath tumors for precision oncology

Affiliations

Ex vivo to in vivo model of malignant peripheral nerve sheath tumors for precision oncology

Alex T Larsson et al. Neuro Oncol. .

Abstract

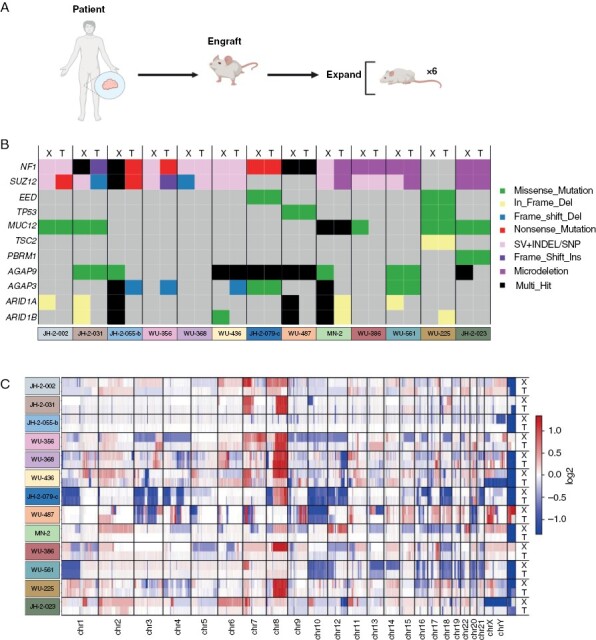
Background: Malignant peripheral nerve sheath tumors (MPNST) are aggressive soft tissue sarcomas that often develop in patients with neurofibromatosis type 1 (NF1). To address the critical need for novel therapeutics in MPNST, we aimed to establish an ex vivo 3D platform that accurately captured the genomic diversity of MPNST and could be utilized in a medium-throughput manner for drug screening studies to be validated in vivo using patient-derived xenografts (PDX).

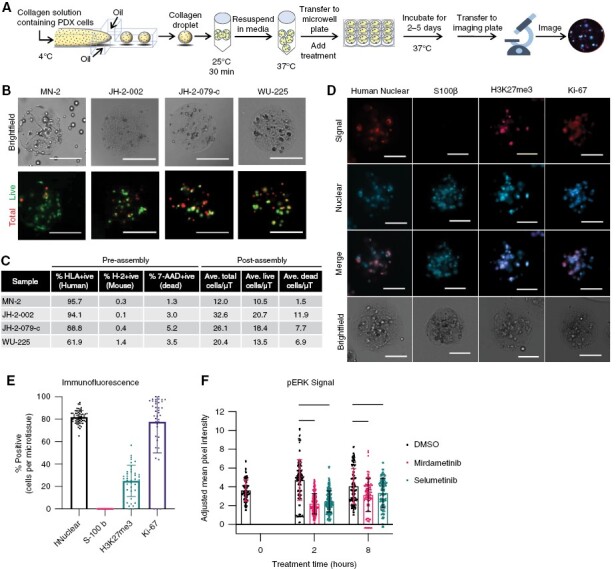
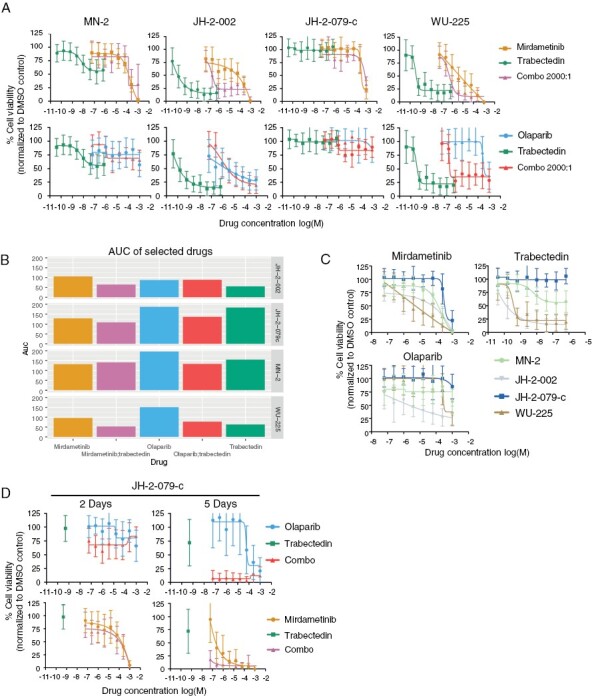
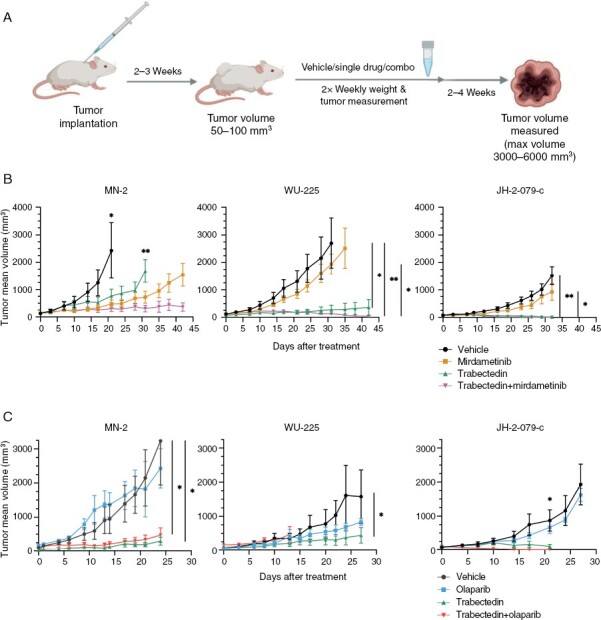
Methods: Genomic analysis was performed on all PDX-tumor pairs. Selected PDX were harvested for assembly into 3D microtissues. Based on prior work in our labs, we evaluated drugs (trabectedin, olaparib, and mirdametinib) ex vivo and in vivo. For 3D microtissue studies, cell viability was the endpoint as assessed by Zeiss Axio Observer. For PDX drug studies, tumor volume was measured twice weekly. Bulk RNA sequencing was performed to identify pathways enriched in cells.

Results: We developed 13 NF1-associated MPNST-PDX and identified mutations or structural abnormalities in NF1 (100%), SUZ12 (85%), EED (15%), TP53 (15%), CDKN2A (85%), and chromosome 8 gain (77%). We successfully assembled PDX into 3D microtissues, categorized as robust (>90% viability at 48 h), good (>50%), or unusable (<50%). We evaluated drug response to "robust" or "good" microtissues, namely MN-2, JH-2-002, JH-2-079-c, and WU-225. Drug response ex vivo predicted drug response in vivo, and enhanced drug effects were observed in select models.

Conclusions: These data support the successful establishment of a novel 3D platform for drug discovery and MPNST biology exploration in a system representative of the human condition.

Keywords: 3D microtissues; MPNST; NF1; PDX; drug screening; genomic variants.


Figures

Figure 1.
Figure 1.
Diverse MPNST patient tumors used in separate models. (A) Schematic description of patient derived xenografts engrafted into NRG mice for drug studies. (B) Heatmap of single nucleotide variants across all 13 PDX-tumor pairs (X = PDX; T = parental tumor). Each somatic variant is present in only a fraction of samples. Percent-wise distribution is shown on the right. (C) Copy number variations in 13 PDX-tumor pairs.
Figure 2.
Figure 2.
Characterization of PDX 3D microtissues before and after assembly. (A) Schematic description of dissociated patient derived xenograft tumors processed into 3D microtissues. (B) Representative brightfield and fluorescent images of PDX 3D microtissues made from MN-2, JH-2-002, JH-2-079-c, and WU-225 stained with calcein AM (live) and DRAQ5 (total) after two days in culture. Scale bars: 200 µm. (C) Microtissue (μT) composition characterization before and after microtissue assembly. Pre-assembly shows percent positive cells for each antibody via flow cytometry. Post-assembly shows average amount of cells per microtissue via viability staining. (D) Representative immunofluorescent images of WU-225 microtissues 48 hours post-encapsulation stained for human nuclei (ab254080, Abcam), S-100 b (sc-393919, Santa Cruz Biotechnology), H3K27me3 (9733, Cell Signaling Technologies), and Ki-67 (RM9106S1, Fisher Scientific). Nuclear counts and number of cells positive for a given stain for a single microtissue were determined. Scale bars 100 µm. (E) Percent of WU-225 cells positive for immunofluorescence averaged across microtissues for each stain in panel C. Error bars represent mean±SD, n≥39 microtissues for all stains. (F) WU-225 microtissues were exposed to mirdametinib (10 µM), selumetinib (10 µM) or DMSO for 0, 2 or 8 h and phospho-ERK levels were assessed via immunofluorescence. Microtissues were stained with pERK (4370, Cell Signaling Technologies) and mean pixel intensity was adjusted with background signal. Error bars represent mean±SD, n ≥ 100 microtissues per condition. Confidence interval of 95% shown. *** indicates P < 0.001. **** indicates P < 0.0001.
Figure 3.
Figure 3.
RNA sequencing analysis shows some similarities among different PDX. (A) Two-dimensional embedding of gene expression of each patient sample from PCA. Shape and color indicate microtissue quality from Table 1. (B) Over-representation analysis (ORA) of PDX based on microtissue quality that were determined as usable (robust and good) versus unusable. Color shown is the Log2 of combined score obtained from enrichR web server using the Reactome reference gene set. All terms have adjusted p-value <= 0.05. (C) Heatmaps of RNA counts of the genes in the gene sets of “activation of ras in b cells” and “notch1 intracellular domain regulated transcription” from ORA in panel B. Values shown are z-scored centered by column.
Figure 4.
Figure 4.
Ex vivo PDX 3D microtissues are inhibited with trabectedin drug combinations. (A) Dose response curves of four PDX 3D microtissues exposed to trabectedin combinations with either mirdametinib or olaparib at drug ratios of 2000:1 after two days in culture. Data points and error bars represent mean±SD, ≥10 microtissues/data point. (B) Area under the curve (AUC) of single agents and trabectedin combinations from panel A. (C) Dose response curves of four PDX 3D microtissues exposed to single agents mirdametinib, trabectedin or olaparib for two days in culture. Data points and error bars represent mean±SD, ≥10 microtissues/data point. (D) Dose response curves of JH-2-079-c exposed to trabectedin combinations with either mirdametinib or olaparib for two or five days in 3D microtissues. Trabectedin concentration was kept constant (0.5 nM) with varied concentrations of mirdametinib or olaparib. Data points and error bars represent mean ± SD, ≥10 microtissues/data point.
Figure 5.
Figure 5.
In vivo tumor growth is inhibited with trabectedin treatments. (A) Schema describing timeline of drug administration following PDX engraftment. (B) Tumor volume response to mirdametinib, trabectedin or the combination of the two in MN-2, WU-225, and JH-2-079-c PDX grown in mice. (C) Tumor volume response to olaparib, trabectedin or the combination of the two in MN-2, WU-225, and JH-2-079-c PDX grown in mice. Data points and error bars represent mean±SEM n = 3-5, ANOVA was used to assess statistical significance (**P < 0.01; *P < 0.05).

References

    1. Kourea HP, Bilsky MH, Leung DHY, Lewis JJ, Woodruff JM.. Subdiaphragmatic and intrathoracic paraspinal malignant peripheral nerve sheath tumors: A clinicopathologic study of 25 patients and 26 tumors. Cancer. 1998;82(11):2191–2203. - PubMed
    1. Reilly KM, Kim A, Blakely J, et al. . Neurofibromatosis Type 1–associated MPNST state of the science: outlining a research agenda for the future. J Natl Cancer Inst. 2017;109(8). - PMC - PubMed
    1. Prudner BC, Ball T, Rathore R, Hirbe AC.. Diagnosis and management of malignant peripheral nerve sheath tumors: Current practice and future perspectives. Neuro-Oncol Adv. 2020;2(Supplement_1Suppl 1):i40–i49. - PMC - PubMed
    1. Zheng H, Chang L, Patel N, et al. . Induction of abnormal proliferation by nonmyelinating Schwann cells triggers neurofibroma formation. Cancer Cell. 2008;13(2):117–128. - PubMed
    1. Yang FC, Ingram DA, Chen S, et al. . Nf1-dependent tumors require a microenvironment containing Nf1+/−- and c-kit-dependent bone marrow. Cell. 2008;135(3):437–448. - PMC - PubMed

Publication types