. 2023 Jun 1;15(6):evad096.
doi: 10.1093/gbe/evad096.

Phylogenomic Testing of Root Hypotheses

Affiliations

Phylogenomic Testing of Root Hypotheses

Fernando D K Tria et al. Genome Biol Evol. .

Abstract

The determination of the last common ancestor (LCA) of a group of species plays a vital role in evolutionary theory. Traditionally, an LCA is inferred by the rooting of a fully resolved species tree. From a theoretical perspective, however, inference of the LCA amounts to the reconstruction of just one branch-the root branch-of the true species tree and should therefore be a much easier task than the full resolution of the species tree. Discarding the reliance on a hypothesized species tree and its rooting leads us to reevaluate what phylogenetic signal is directly relevant to LCA inference and to recast the task as that of sampling the total evidence from all gene families at the genomic scope. Here, we reformulate LCA and root inference in the framework of statistical hypothesis testing and outline an analytical procedure to formally test competing a priori LCA hypotheses and to infer confidence sets for the earliest speciation events in the history of a group of species. Applying our methods to two demonstrative data sets, we show that our inference of the opisthokonta LCA is well in agreement with the common knowledge. Inference of the proteobacteria LCA shows that it is most closely related to modern Epsilonproteobacteria, raising the possibility that it may have been characterized by a chemolithoautotrophic and anaerobic life style. Our inference is based on data comprising between 43% (opisthokonta) and 86% (proteobacteria) of all gene families. Approaching LCA inference within a statistical framework renders the phylogenomic inference powerful and robust.

Keywords: last common ancestor (LCA); phylogenetics; proteobacteria; rooting; species tree.


Figures

<sc>Fig.</sc> 1.
Fig. 1.
—Outline of the analytical procedure. Stages are depicted clockwise from top-left. The input for the analysis is (1) gene trees of all protein families for a group of species, including the information of AD per branch as calculated by MAD. Protein families are classified into complete and partial, single-copy, or multicopy families according to the gene copy number per species. (2) Branch ADs in the gene trees supply evidence for hypothetical root partitions in the species tree; these are collected in the (3) root support matrix. The information in the root support matrix is used to identify candidates for the species root partition (including the consensus root partition, if exists). (4) The comparison of root candidates is done by comparing the distribution of their ADs in all gene trees in a pairwise test. (5) If several root partitions are similarly supported by ADs, these can be analyzed in the context of a root neighborhood, where weakly supported partitions are sequentially eliminated from the root partitions set. (6) The remaining root partitions comprise the species LCA confidence set.
<sc>Fig.</sc> 2.
Fig. 2.
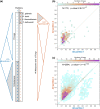
—Pairwise testing of competing root hypotheses in the opisthokonta data set. (a) The two most frequent root branches among the CSC gene trees (supplementary table S1a, Supplementary Material online). (b) CSC gene families, and (c) all gene families. Colormaps are the joint distribution of paired AD values. Smaller ADs indicate better support, whereby candidate 1 outcompete candidate 2 above the diagonal and candidate 2 wins below the diagonal. P values are for the two-sided Wilcoxon signed-rank test used to compare paired branch AD values. Note the gain in power concomitant to larger sample size.
<sc>Fig.</sc> 3.
Fig. 3.
—Correspondence of OTU splits and tested root partitions. (a) In CSC gene trees; (b) in PSC gene trees; and (c) in CMC gene trees. PMC gene trees entail both the b and c operations. OTU splits refer to branches in gene trees and are represented as black circles and white squares. Species partitions refer to possible branches in the hypothetical species tree, with unknown topology, and are represented as gray shades. In CSC gene trees, all branches (including internal and external) can be mapped to species partitions in a one-to-one manner (green arrows in a; note that only several splits are illustrated). For mapping branches from PSC gene trees (b) to species partitions, we remove from the species partitions the species missing in the gene tree and term the reduced version of the species partitions as OTU partitions. In CMC gene trees (c), only branches that form species splits can be mapped onto species partitions. A species splits in a CMC gene tree is a branch for which all gene copies of any one species are present on the same side of the split.
<sc>Fig.</sc> 4.
Fig. 4.
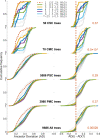
—Cumulative distribution plots of AD in the proteobacteria data set. Left: cumulative distribution of unpaired AD values for the 25 candidate root partitions. Right: cumulative distribution of paired differences to candidate 1 (i.e., the most frequent candidate), whereby positive differences indicate better support for candidate 1 and negative values better support for candidate i (see supplementary table S1b, Supplementary Material online for candidate partition definitions). The results from gene family (i.e., tree) classes are stacked vertically. P values of the least significant among the contrasts to candidate 1 are shown in red (FDR adjusted for all 300 pairwise comparisons; details in supplementary table S2b, Supplementary Material online).
<sc>Fig.</sc> 5.
Fig. 5.
—LCA inference by sequential elimination in the proteobacteria data set. (a) Phylogenetic split network of the 50 CSC gene trees; (b) trace of the sequential elimination process (see supplementary table S1b, Supplementary Material online for candidate partition definitions). Selected partitions are indicated by gray arcs in a and bold numbers in b.

References

    1. Benjamini Y, Hochberg Y. 1995. Controlling the false discovery rate: a practical and powerful approach to multiple testing. J R Stat Soc Series B Stat Methodol. 57:289–300.
    1. Bettisworth B, Stamatakis A. 2021. Root digger: a root placement program for phylogenetic trees. BMC Bioinform 22:225. - PMC - PubMed
    1. Bremer N, Knopp M, Martin WF, Tria FDK. 2022. Realistic gene transfer to gene duplication ratios identify different roots in the bacterial phylogeny using a tree reconciliation method. Life 12:995. - PMC - PubMed
    1. Campbell BJ, Engel AS, Porter ML, Takai K. 2006. The versatile ε-proteobacteria: key players in sulphidic habitats. Nat Rev Microbiol. 4:458–468. - PubMed
    1. Cherlin S, Heaps SE, Nye TMW, Boys RJ, Williams TA, Embley TM. 2018. The effect of nonreversibility on inferring rooted phylogenies. Mol Biol Evol. 35:984–1002. - PMC - PubMed

Publication types