. 2023 Jan-Dec:19:17448069231174315.
doi: 10.1177/17448069231174315.

Peripheral sensory neurons and non-neuronal cells express functional Piezo1 channels

Affiliations

Peripheral sensory neurons and non-neuronal cells express functional Piezo1 channels

Seung Min Shin et al. Mol Pain. 2023 Jan-Dec.

Abstract

Here, we present evidence showing Piezo1 protein expression in the primary sensory neurons (PSNs) and non-neuronal cells of rat peripheral nervous system. Using a knockdown/knockout validated antibody, we detected Piezo1 immunoreactivity (IR) in ∼60% of PSNs of rat dorsal root ganglia (DRG) with higher IR density in the small- and medium-sized neurons. Piezo1-IR was clearly identified in DRG perineuronal glia, including satellite glial cells (SGCs) and Schwann cells; in sciatic nerve Schwann cells surrounding the axons and cutaneous afferent endings; and in skin epidermal Merkel cells and melanocytes. Neuronal and non-neuronal Piezo1 channels were functional since various cells (dissociated PSNs and SGCs from DRGs, isolated Schwann cells, and primary human melanocytes) exhibited a robust response to Piezo1 agonist Yoda1 by an increase of intracellular Ca2+ concentration ([Ca2+]i). These responses were abolished by non-specific Piezo1 antagonist GsMTx4. Immunoblots showed elevated Piezo1 protein in DRG proximal to peripheral nerve injury-induced painful neuropathy, while PSNs and SGCs from rats with neuropathic pain showed greater Yoda1-evoked elevation of [Ca2+]i and an increased frequency of cells responding to Yoda1, compared to controls. Sciatic nerve application of GsMTx4 alleviated mechanical hypersensitivity induced by Yoda1. Overall, our data show that Piezo1 is widely expressed by the neuronal and non-neuronal cells in the peripheral sensory pathways and that painful nerve injury appeared associated with activation of Piezo1 in PSNs and peripheral glial cells.

Keywords: Piezo-type mechanosensitive ion channel component 1; immunohistochemistry; peripheral nervous system.


Conflict of interest statement

The author(s) declared no potential conflicts of interest with respect to the research, authorship, and/or publication of this article.

Figures
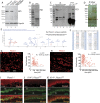
Figure 1.
Figure 1.
Specificity of Piezo1 (PZ1) antibody. Immunoblot (IB) detects canonical PZ1 protein band at the mass size of ∼300 kDa with comparable densities in the lysates of Cas9N2A cells and mCherry-expressing Cas9N2A cells, but PZ1 is completely ablated in Cas9N2A cells transduced by LV-mediated PZ1-Crispr gRNAs (A). Canonical PZ1 is detected upon IB of DRG lysates, with additional bands at ∼200 and ∼70 kDa (B) which are detected in the reduced total lysate proteins loaded on the gel (C, left size) but only canonical PZ1 is clearly detected in PZ1 Co-IP samples (C, right size, asterisk denotes IgG heavy chain). Co-IP sample was size-separated, silver stained (D, asterisk denotes IgG heavy chain), and gel pieces ranging ∼320-150 kDa excised for mass spectrometry. Representative MS/MS spectrum of an ion from rat Piezo1 peptide 1888GAAVVEAEHEEGEEGR1093 (E, red) and m/z fragments matched (F, red). Representative IHC images show PZ1-IR (red) in the sections of DRG (G) and TG (H) and PZ1-expressing PSN cross-section area plotted versus intensity (right panels of G and H) from adult naïve rats. Dashed line indicates cutoff levels of background signals. IHC montage images of colabeling of PZ1 or PZ2 (red) with CK14 (green) on hindpaw skin sections from wide-type (WT) mice (I) and Piezo1-ko mice (J, K), as indicated. Epi and de denote epidermis and dermis. Scale bars: 50 μm for G, H; 25 μm for I-K. Gas9N2A, N2A cell stably expressing Gas9; IP-IB, immunoprecipitation-immunoblot; DRG, dorsal root ganglia; IHC, immunohistochemistry; CK14, cytokeratin.
Figure 2.
Figure 2.
DRG Piezo1 (PZ1): Double immunostaining (male). Representative IHC montage images of DRG sections show PZ1-IR (red) co-stained with PSN markers (green), including Tubb3 (A), CGRP (B), IB4 (C), Cav3.2 (D), NF200 (E), and NKA1α (F, F1). The panels in the right sides of A-E calculate the percentage of PZ1-neurons overlaid to Tubb3-neurons (A1), neurons positive for CGRP/PZ1 (B1) and IB4/PZ1 (C1) overlaid to PZ1-neurons, and PZ1-neurons overlaid to Cav3.2 (D1) and NF200 (E1) neurons. The numbers are the counted PZ1-IR neurons (red) and marker-labeled neurons (green). ICA analyzes colocalization between PZ1 and NKA1α and scatter plots for the region demarcated by the white dashed line in panel F1 show data clustered along both positive and negative axes for both Piezo1 and NKA1α (G). “A” is the intensity of Piezo1 while “a” is the average of these values, and “B” is the intensity of NKA1α while “b” is the average of these values. For this region, the ICQ value is 0.059 (Psign test<0.001). (H-L) Show PZ1 (red) with a selection of glial cell markers (green), including GS (H), Hmgcs1 (I) with the squared region shown at high magnification (I1), S100 (J) with the squared region shown at high magnification (J1), and GFAP (K, K1). White arrowheads in panel I1, J1, point to the colabeled glial cells. ICA analysis for colocalization between PZ1 and GFAP for the region demarcated by the white dashed line in panel K1 shows scattered plot data clustered along both positive and negative axes for both PZ1 and GFAP (L). “A” is the intensity of PZ1 while “a” is the average of these values, and “B” is the intensity of GFAP while “b” is the average of these values. For this region, the intensity correlation quotient (ICQ) value is 0.122 (Psign test<0.001). (M, N) Show rat DRG neuron enrichment culture at DIV 0.25 (M) and isolated DRG neuron-free glial cell culture at DIV4 (N). (O) Canonical PZ1 protein band (∼300 kDa) was clearly detected upon immunoblot in the lysates prepared from rat DRG tissue, enriched rat DRG neurons, purified DRG glia, and 50B11 and F11 DRG neuronal-like cells. Scale bars: 50 μm for all. DRG, dorsal root ganglia, IHC, immunohistochemistry; PSN, primary sensory neuron; Tubb3, β3-tubulin; GS, glutamine synthetase; Hmgcs1, 3-hydroxy-3-methylglutaryl coenzyme A synthase-1; ICA, Intensity correlation analysis.
Figure 3.
Figure 3.
IHC of Piezo1 (PZ1) axonal component and Schwann cell expression (male). Representative IHC montage images show double immunostaining of Piezo1 (red) with a selection of neuronal markers (green), including Tubb3 (A), NF200 (B), and NKA1α (C); and PZ1 (red) with glia markers (green), including MBP (D), S100 (E), and GAP43 (F). Human Schwann cells (G) and isolated Schwann cells (H) from rat sciatic nerve show double staining of Piezo1 (red) with S100 (green). Scale bars: 50 μm for all. Immunoblots show detection of canonical PZ1 protein (∼300 kDa) in the lysates of primary cultured human and rat Schwann cells (I, J). GAP43, Growth associated protein 43; MBP, myelin basic protein.
Figure 4.
Figure 4.
IHC of Piezo1 (PZ1) expression in spinal cord (male). PZ1-IR (red) is co-stained with a selection of dorsal horn presynaptic markers (green), including IB4 (A), CGRP (B), Syp (C), and Synpr (D), showing immunocolocalization (yellow) in the magnified merged images (A1-D1). D1 is the squared region of panel D. Piezo1-IR (red) and NeuN (green) on the DH (E) and VH (F) show immunocolocalization (yellow) of PZ1 with the squared region of panel E showing the magnified image (E1) and amplified image showing PZ1-labeled VH neurons (F1). Piezo1-IR (red) and PKCγ (green) on the DH (G) show immunocolocalization (yellow) in the magnified merged images (G1). (H) Positive PZ1 (red) in GFAP-positive (green) astrocytes on spinal cord DH sections, with the squared region shown at high magnification (H1). Immunoblots show detection of clean canonical PZ1 protein band (∼300 kDa) in the lysates of primary cultured rat spinal cord glial cells (I) and NSC SC-neurons (J). Scale bars in IHC images: 50 μm for all. Syp, synaptophysin; Synpr, synaptoporin, DH, spinal cord dorsal horn; VH, ventral horn.
Figure 5.
Figure 5.
IHC delineation of Piezo1 (PZ1) expression in skin (male). Hindpaw glabrous skin sections display PZ1 (red) and CK14 (green), showing colabeling (yellow, empty arrowheads) in the merged image (A, B); the white arrowheads point to PZ1 labeled Meissner corpuscles. PZ1-IR in Meissner’s corpuscles (white arrowheads) is immunolocalized with NF200 (C), IB4 (D), and CGRP) (E). PZ1-IR in the hairy skin lanceolate endings is colabeled with NF200 (F, white arrowheads) and CGRP around hair follicles (G, white arrowheads point to lanceolate endings), as well as putative onion-like Pacinian corpuscle colabeled with NF200 (H). PZ1-IR is immunocolocalized with CGRP (I) and IB4 (J), NF200 (K), Cav3.2 (L), and S100 (M) in the nerve bundles within dermis. IHC reveals colabeling of PZ1 (red) with Syn (green) in the nerve bundles within the dermis (N, white arrowheads; red arrowheads point to PZ1-labeled endothelial cells of small vesicles). PZ1 (red) is colabeled with Syn (green) in the epidermis (O), with the squared region rotated clockwise 90-degree shown at high magnification (O1). PZ1 (red) is co-stained with ACTA2 (green) in the nerve bundles within the dermis (P, white arrowheads point to nerve bundles, red arrowheads to PZ1-labeled endothelial cells of small vesicles, and green arrowheads to ACTA2-labled vascular smooth muscles). IHC shows PZ1-IR colabeled with S100 in Meissner’s corpuscles (white arrowheads) (Q, R), with the squared region in panel Q shown at high magnification (Q1); and in epidermal basal layer cells (S and T, empty arrowheads; white arrowheads point to Meissner corpuscles). Scale bars: 50 μm for all. IHC, immunohistochemistry; Cav3.2, T-type calcium channel 3.2α1H; Syp, synaptophysin; ACTA2, α-Smooth muscle actin.
Figure 6.
Figure 6.
Piezo1 in human melanocytes (female). Shown are ICC montage images of double labeling of PZ1 (A, red) with S100 (B, green), Piezo1/S100 colabeling (C, merged), showing morphology of melanocytes in phase image (D). Scale bars: 25 μm for all. Detection of canonical PZ1 protein (∼300 kDa) in the lysates of human melanocytes, asterisk denotes putative non-specific band (E). Representative [Ca2+]i traces (F) and bar charts (G) summarize averaged [Ca2+]i peak values evoked by different concentration of Yoda1 and Yoda1 plus GsMTx4 (1 μM, red text) as indicated in human melanocytes. ICC, immunocytochemistry; hMCs, human melanocytes.
Figure 7.
Figure 7.
Yoda1-stimualted functional Piezo1 in primary cultural cells and spinal cord/DRG neuronal cell lines. Representative [Ca2+]i traces and bar charts summarize averaged [Ca2+]i peak values evoked by different concentration of Yoda1 and Yoda1 plus GsMTx4 (1 μM, red text) as indicated in acute dissociated PSNs (A, A1) with dot plots (A2) showing correlation of Yoda1 responses to PSN sizes (small-medium size ≤40 diameter), DRG dissociated SGCs (B, B1, including other glia, e.g. SCs), primary cultural SCs isolated from naïve rat sciatic nerves (C, C1), dissociated spinal DH glia (D, D1), NSC spinal cord motor neurons (G, G1), 50B11 DRG neurons (H, H1), and F11 DRG neurons (I, I1). The numbers on the top of scattered plots with bars are the responders (numerators) out of total cells recorded (denominators) and % of responders (brackets). DRG, dorsal root ganglia; PSN, primary sensory neuron; DH, spinal cord dorsal horn.
Figure 8.
Figure 8.
Activation of Piezo1 in PSNs and SGCs following TNI in male rats. Scattered plots with bars summarize means ± SEM of mechanical allodynia (vF) and hyperalgesia (Pin) in TNI (A) and SNI (C) rats (n = 10 for each group), unpaired two-tailed Student’s t-test for vF and Mann–Whitney test for Pin. DRG homogenates were extracted from the DRG (pooled L4/L5) at 28 days after TNI (B) and SNI (D) or control (sham), and subjected to immunoblotting (IB) as shown in the representative IBs of Piezo1, Iba1, and Gapdh. The densitometry of canonical piezo1 (∼300 KDa, asterisks denote non-specific bands) and Iba1was analyzed and summarized in bar charts (right panels of B, D); unpaired two-tailed Student’s t-test. Comparison of [Ca2+]i traces evoked by 1 and 10 μM of Yoda1 in PSNs (E) and SGCs (containing other glia population) (F), the scattered plots with bars showing the averaged [Ca2+]i peak values evoked by 1 and 10 μM of Yoda1 in PSNs (E1) and SGCs (F1) from sham and TNI rats, unpaired two-tailed Student’s t-test. Shown in E2 and F2 summarize the % of responders versus non-responders evoked by 1, 5, and 10 μM of Yoda1 in PSNs (E2) and SGCs (F2) from sham and TNI rats, chi-square and Fisher’s exact tests. *p < 0.05, **p < 0.01, and ***p < 0.001. TNI, tibial nerve injury; SNI, spared nerve injury; DRG, dorsal root ganglia; Iba1, allograft inflammatory factor-1.
Figure 9.
Figure 9.
Reversal of Yoda1-induced mechanical hypersensitivity by GsMTx4. (A, B) Scatter and line plots show time courses for the group averages of sensitivity to vF (A1, B1) and Pin (A2, B2) following sciatic nerve injection of saline, Yoda1 (20 μM) or Yoda1 (20 μM) plus GsMTx4 (40 μM) in male and female naïve rats, as indicated, for comparison to BL (repeated measures two-way ANOVA and Tukey post-hoc for vF and nonparametric analyses by Friedman’s test with Dunn’s post hoc for Pin. Right scattered plots of A1-B2 show AUCs (15–60 min) comparison among groups, one-way ANOVA, and Tukey post-hoc. *p < 0.05, **p < 0.01, and ***p < 0.001.

References

    1. Coste B, Mathur J, Schmidt M, Earley TJ, Ranade S, Petrus MJ, Dubin AE, Patapoutian A. Piezo1 and Piezo2 are essential components of distinct mechanically activated cation channels. Science 2010; 330: 55–60. DOI: 10.1126/science.1193270 - DOI - PMC - PubMed
    1. Ranade SS, Syeda R, Patapoutian A. Mechanically activated ion channels. Neuron 2015; 87: 1162–1179. DOI: 10.1016/j.neuron.2015.08.032 - DOI - PMC - PubMed
    1. Ranade SS, Qiu Z, Woo SH, Hur SS, Murthy SE, Cahalan SM, Xu J, Mathur J, Bandell M, Coste B, Li YSJ, Chien S, Patapoutian A. Piezo1, a mechanically activated ion channel, is required for vascular development in mice. Proc Natl Acad Sci U S A 2014; 111: 10347–10352. DOI: 10.1073/pnas.1409233111 - DOI - PMC - PubMed
    1. Ranade SS, Woo SH, Dubin AE, Moshourab RA, Wetzel C, Petrus M, Mathur J, Bégay V, Coste B, Mainquist J, Wilson AJ, Francisco AG, Reddy K, Qiu Z, Wood JN, Lewin GR, Patapoutian A. Piezo2 is the major transducer of mechanical forces for touch sensation in mice. Nature 2014; 516: 121–125. DOI: 10.1038/nature13980 - DOI - PMC - PubMed
    1. Alper SL. Genetic Diseases of PIEZO1 and PIEZO2 Dysfunction. Curr Top Membr 2017; 79: 97–134. DOI: 10.1016/bs.ctm.2017.01.001 - DOI - PubMed

Publication types

LinkOut - more resources