. 2023 May 29;14(1):3097.
doi: 10.1038/s41467-023-38878-8.

Evidence against a temporal association between cerebrovascular disease and Alzheimer's disease imaging biomarkers

Affiliations

Evidence against a temporal association between cerebrovascular disease and Alzheimer's disease imaging biomarkers

Petrice M Cogswell et al. Nat Commun. .

Abstract

Whether a relationship exists between cerebrovascular disease and Alzheimer's disease has been a source of controversy. Evaluation of the temporal progression of imaging biomarkers of these disease processes may inform mechanistic associations. We investigate the relationship of disease trajectories of cerebrovascular disease (white matter hyperintensity, WMH, and fractional anisotropy, FA) and Alzheimer's disease (amyloid and tau PET) biomarkers in 2406 Mayo Clinic Study of Aging and Mayo Alzheimer's Disease Research Center participants using accelerated failure time models. The model assumes a common pattern of progression for each biomarker that is shifted earlier or later in time for each individual and represented by a per participant age adjustment. An individual's amyloid and tau PET adjustments show very weak temporal association with WMH and FA adjustments (R = -0.07 to 0.07); early/late amyloid or tau timing explains <1% of the variation in WMH and FA adjustment. Earlier onset of amyloid is associated with earlier onset of tau (R = 0.57, R2 = 32%). These findings support a strong mechanistic relationship between amyloid and tau aggregation, but not between WMH or FA and amyloid or tau PET.


Conflict of interest statement

P.M.C, E.S.L., T.M.T., C.T.M., H.J.W, J.L.G., R.I.R., and S.A.P. have no disclosures. J.G.R. serves as an assistant editor for Neurology and receives research support from the NIH. C.G.S. receives research support from the NIH. M.L.S. holds stock in medical-related companies, unrelated to the current work: Align Technology, Inc., LHC Group, Inc., Medtronic, Inc., Mesa Laboratories, Inc., Natus Medical Inc., and Varex Imaging Corporation. He has also owned stock in these medical-related companies within the past three years, unrelated to the current work: CRISPR Therapeutics, Gilead Sciences, Inc., Globus Medical Inc., Inovio Biomedical Corp., Ionis Pharmaceuticals, Johnson & Johnson, Medtronic, Inc., Oncothyreon, Inc., Parexel International Corporation. D.S.K. served on a Data Safety Monitoring Board for the DIAN study. He serves on a Data Safety Monitoring Board for a tau therapeutic for Biogen but receives no personal compensation. He was a site investigator in the Biogen aducanumab trials. He is an investigator in a clinical trial sponsored by Lilly Pharmaceuticals and the University of Southern California. He serves as a consultant for Samus Therapeutics, Third Rock, Roche, and Alzeca Biosciences but receives no personal compensation. He receives research support from the NIH. P.V. received speaker fees from Miller Medical Communications, Inc. and receives research support from the NIH. R.C.P. serves as a consultant for Roche Inc., Merck Inc., and Biogen, Inc. He serves on the Data Safety Monitoring Board for Genentech, Inc and receives a royalty from Oxford University Press and UpToDate. C.R.J. serves on an independent data monitoring board for Roche, has served as a speaker for Eisai, and consulted for Biogen, but he receives no personal compensation from any commercial entity. He receives research support from NIH and the Alexander Family Alzheimer’s Disease Research Professorship of the Mayo Clinic.

Figures
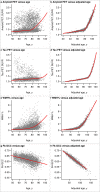
Fig. 1
Fig. 1. Relationships between age and PET or MRI outcomes from the primary AFT model fit in the MCSA + ADRC.
Scatter plots of amyloid PET SUVR, tau PET SUVR, WMH%, and FA GCC vs age (a, c, e, g) and adjusted age (b, d, f, h). The adjusted age is the participant’s estimated age with respect to the biomarker of interest based on both the covariate and random effects. Each dot represents one observation, and individuals having serial data contribute multiple observations: amyloid PET (n = 4640), tau PET (n = 2249), WMH% (n = 5261), FA GCC (n = 3635). The red curves indicate a hypothetical common curve; we assume all individuals follow this trajectory of biomarker progression with the curve shifted left or right based on the random effects and covariates effects. Source data are provided as a Source Data file. *ADRC = Mayo Alzheimer’s Disease Research Center, AFT = accelerated failure time model, FA GCC = fractional anisotropy in the genu of the corpus callosum, MCSA = Mayo Clinic Study of Aging, SUVR = standardized uptake value, WMH% = white matter hyperintensity volume scaled as % of total intracranial volume.
Fig. 2
Fig. 2. Relationships of biomarker values and individual-level adjustments in the MCSA + ADRC.
In the left column (panels a, c, e, g, i, k), scatter plots display each 2-way relationship between the outcome measures used in the model; each dot represents one observation, and a participant could have multiple observations. The number of observations varies across comparisons based on data availability: tau PET SUVR with amyloid PET SUVR (n = 2243), WMH% with amyloid PET SUVR (n = 4587), FA GCC with amyloid PET SUVR (n = 3388), WMH% with tau PET SUVR (n = 2196), FA GCC with tau PET SUVR (n = 1321), and FA GCC with WMH% (n = 3626). In the right column (panels b, d, f, h, j, l), scatter plots summarize each 2-way relationship between the model output of individual adjustments. The individual adjustments are shown in years and indicate whether a participant’s level of disease burden was consistent with earlier onset or later onset relative to their demographic peers; each dot represents one participant, and the number of participants varies across the comparisons based on data availability: tau PET SUVR with amyloid PET SUVR (n = 1440), WMH% with amyloid PET SUVR (n = 2383), FA GCC with amyloid PET SUVR (n = 2006), WMH% with tau PET SUVR (n = 1417), FA GCC with tau PET SUVR (n = 1119), and FA GCC with WMH% (n = 2004). An 80% ellipse indicates the strength of association between the y-axis variable onset adjustment for a given x-axis variable onset adjustment; a perfect circle would indicate no relationship between adjustments. The x-axes and y-axes are flipped for individual adjustments. A higher positive value or earlier onset relative to the population mean is shown to the left of the x-axis and bottom of the y-axis. The percent variation explained (square of the correlation*100) between individual-level adjustments is given in the upper right-hand corner. Source data are provided as a Source Data file. *ADRC = Mayo Alzheimer’s Disease Research Center, FA GCC = fractional anisotropy in the genu of the corpus callosum, MCSA = Mayo Clinic Study of Aging, SUVR = standardized uptake value, WMH% = white matter hyperintensity volume scaled as % of total intracranial volume.
Fig. 3
Fig. 3. Relationships of AD (amyloid and tau PET) and CVD (WMH% and FA GCC) biomarker values and individual adjustments with those of hippocampal volume (HVa) in the MCSA + ADRC.
In the left column (panels a, c, e, g), scatter plots display each 2-way relationship between the outcome measures used in the model; each dot represents one observation, and a participant could have multiple observations. The number of observations varies across comparisons based on data availability: HVa with amyloid PET SUVR (n = 4640), HVa with tau PET SUVR (n = 2249), HVa with WMH% (n = 5261), and HVa with FA GCC (n = 3635). In the right column (panels b, d, f, h), scatter plots summarize each 2-way relationship between the model output of individual adjustments. The individual adjustments are shown in years and indicate whether a participant’s level of disease burden was consistent with earlier onset or later onset relative to their demographic peers; each dot represents one participant, and the number of participants varies across the comparisons based on data availability: HVa with amyloid PET SUVR (n = 2406), HVa with tau PET SUVR (n = 1440), HVa with WMH% (n = 2383), and HVa with FA GCC (n = 2006). An 80% ellipse indicates the strength of association between the y-axis variable onset adjustment for a given x-axis variable onset adjustment; a perfect circle would indicate no relationship between adjustments. The x-axes and y-axes are flipped for the individual adjustments. A higher positive value or earlier onset relative to the population mean is shown to the left of the x-axis and bottom of the y-axis. The percent variation explained (square of the correlation × 100) between individual-level adjustments is given in the upper right-hand corner. Source data are provided as a Source Data file. *ADRC = Mayo Alzheimer’s Disease Research Center, FA GCC = fractional anisotropy in the genu of the corpus callosum, HVa = hippocampal volume adjusted for head size, MCSA = Mayo Clinic Study of Aging, SUVR = standardized uptake value, WMH% = white matter hyperintensity volume scaled as % of total intracranial volume.
Fig. 4
Fig. 4. Covariate effects for each outcome by independent cohort.
Values shown are mean (95% credible interval). Estimates are in years and represent estimated adjustment or years by which that biomarkers progression is shifted earlier (positive) or later (negative) with vs without that covariate. A model was fit on each of cohorts: MCSA + ADRC shown in orange circles and ADNI shown in blue triangles. In statistical analysis, each participant was an independent observation with n = 2406 for the MCSA + ADRC and n = 740 for ADNI. Source data are provided as a Source Data file. * ADNI = Alzheimer’s Disease Neuroimaging Initiative, ADRC = Mayo Alzheimer’s Disease Research Center, FA GCC = fractional anisotropy in the genu of the corpus callosum, MCSA = Mayo Clinic Study of Aging, SUVR = standardized uptake value, WMH% = white matter hyperintensity volume scaled as % of total intracranial volume.
Fig. 5
Fig. 5. Percent variance explained of individual adjustments for pairs of outcomes, with estimates shown by cohort.
Values shown are R2 with 95% credible intervals. Estimates computed from models fit on each of two cohorts: MCSA + ADRC shown in the orange circle and ADNI in a blue triangle. In the statistical analyses, each participant was a unique observation, and the number of participants varies across the comparisons based on data availability. For the MCSA + ADRC: amyloid PET SUVR with tau PET SUVR (n = 1440), amyloid PET SUVR with WMH% (n = 2383), amyloid PET SUVR with FA GCC (n = 2006), tau PET SUVR with WMH% (n = 1417), tau PET SUVR with FA GCC (n = 1119), and FA GCC with WMH% (n = 2004). For ADNI: amyloid PET SUVR with tau PET SUVR (n = 660), amyloid PET SUVR with WMH% (n = 723), amyloid PET SUVR with FA GCC (n = 572), tau PET SUVR with WMH% (n = 665), tau PET SUVR with FA GCC (n = 527), and FA GCC with WMH% (n = 575). Source data are provided as a Source Data file. * ADNI = Alzheimer’s Disease Neuroimaging Initiative, ADRC = Mayo Alzheimer’s Disease Research Center, FA GCC = fractional anisotropy in the genu of the corpus callosum, MCSA = Mayo Clinic Study of Aging, SUVR = standardized uptake value, WMH% = white matter hyperintensity volume scaled as % of total intracranial volume.

References

    1. Arvanitakis Z, Capuano AW, Leurgans SE, Bennett DA, Schneider JA. Relation of cerebral vessel disease to Alzheimer’s disease dementia and cognitive function in elderly people: a cross-sectional study. Lancet Neurol. 2016;15:934–943. doi: 10.1016/S1474-4422(16)30029-1. - DOI - PMC - PubMed
    1. Brickman AM, et al. Reconsidering harbingers of dementia: progression of parietal lobe white matter hyperintensities predicts Alzheimer’s disease incidence. Neurobiol. Aging. 2015;36:27–32. doi: 10.1016/j.neurobiolaging.2014.07.019. - DOI - PMC - PubMed
    1. DeCarli C, et al. Cerebrovascular and brain morphologic correlates of mild cognitive impairment in the National Heart, Lung, and Blood Institute Twin Study. Arch. Neurol. 2001;58:643–647. doi: 10.1001/archneur.58.4.643. - DOI - PubMed
    1. Garnier-Crussard A, et al. White matter hyperintensity topography in Alzheimer’s disease and links to cognition. Alzheimer’s Dement. 2022;18:422–433. doi: 10.1002/alz.12410. - DOI - PMC - PubMed
    1. Kivipelto M, et al. Obesity and vascular risk factors at midlife and the risk of dementia and Alzheimer disease. Arch. Neurol. 2005;62:1556–1560. doi: 10.1001/archneur.62.10.1556. - DOI - PubMed

Publication types