. 2023 May 29;14(1):3101.
doi: 10.1038/s41467-023-38770-5.

The nuclear lamina couples mechanical forces to cell fate in the preimplantation embryo via actin organization

Affiliations

The nuclear lamina couples mechanical forces to cell fate in the preimplantation embryo via actin organization

Robin M Skory et al. Nat Commun. .

Abstract

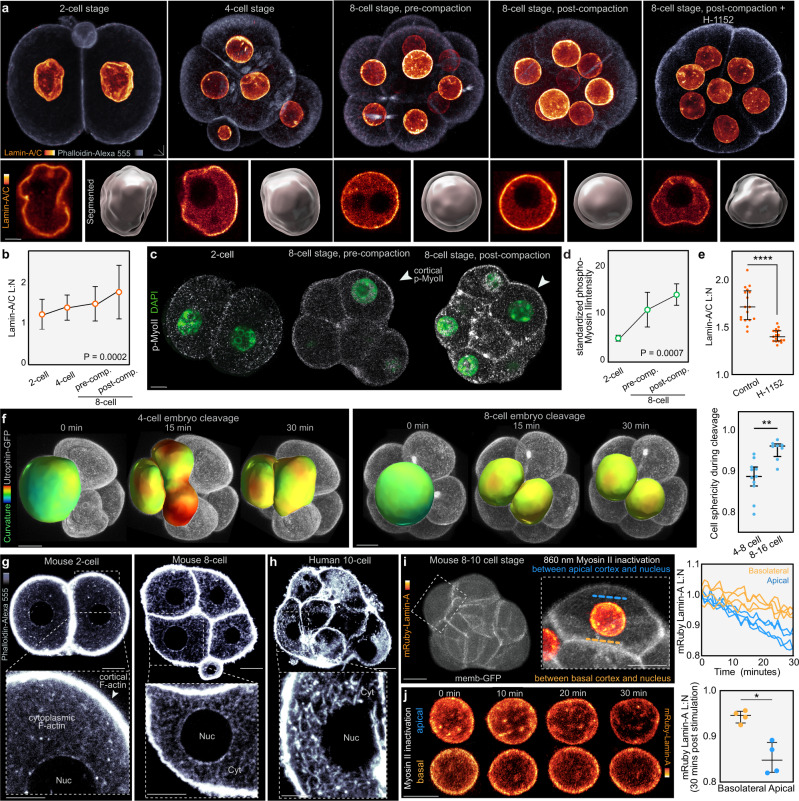
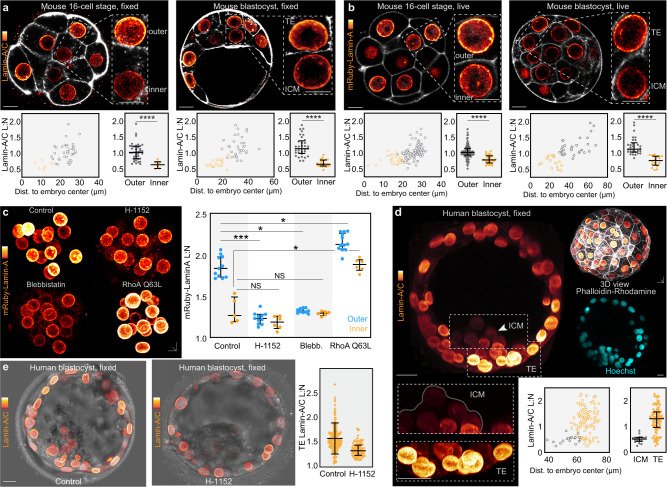
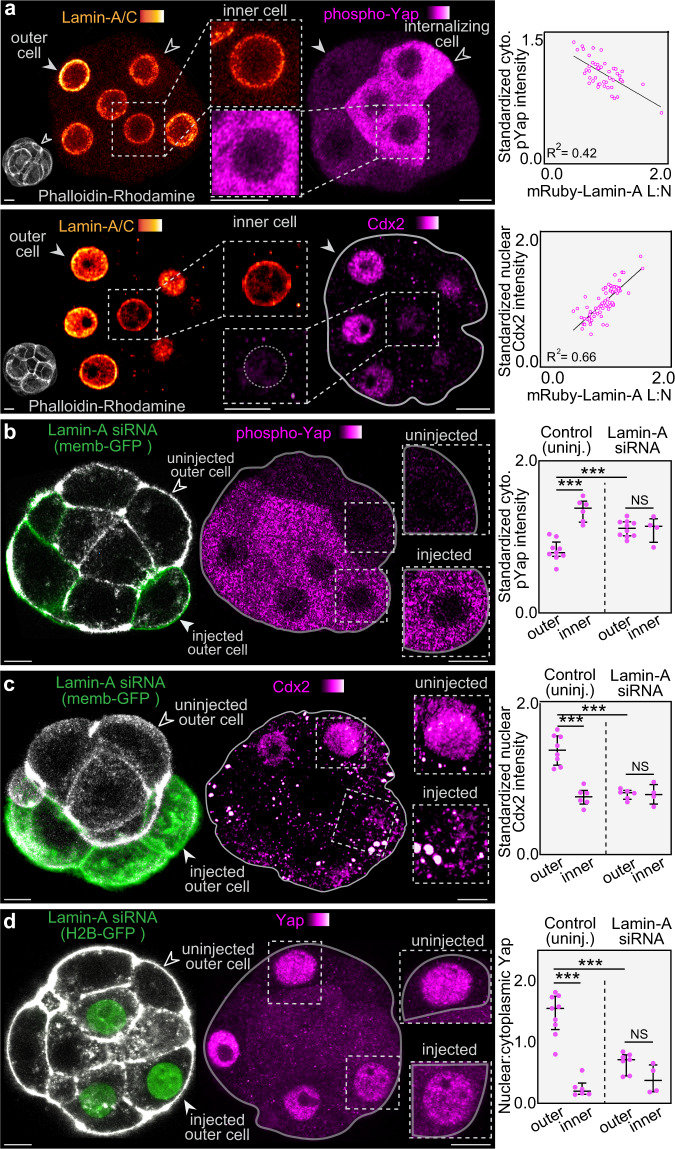
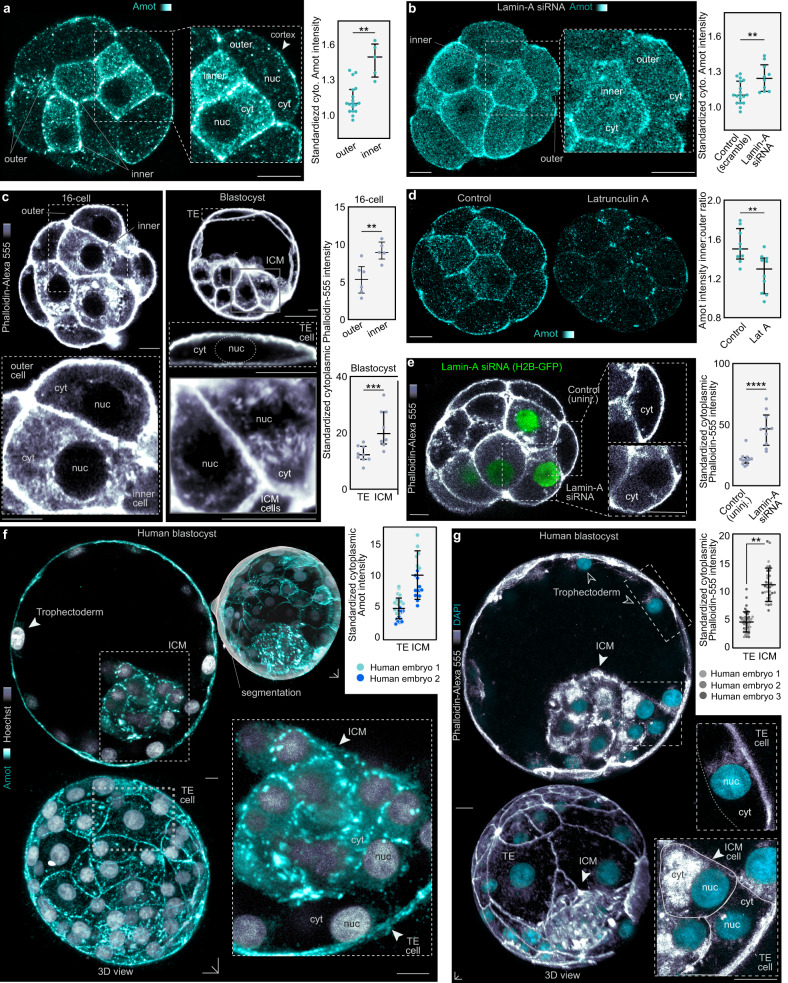
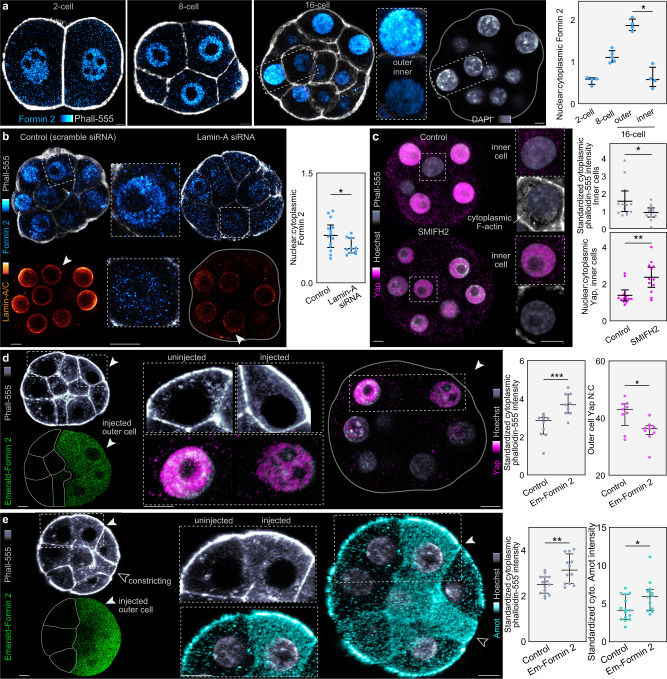
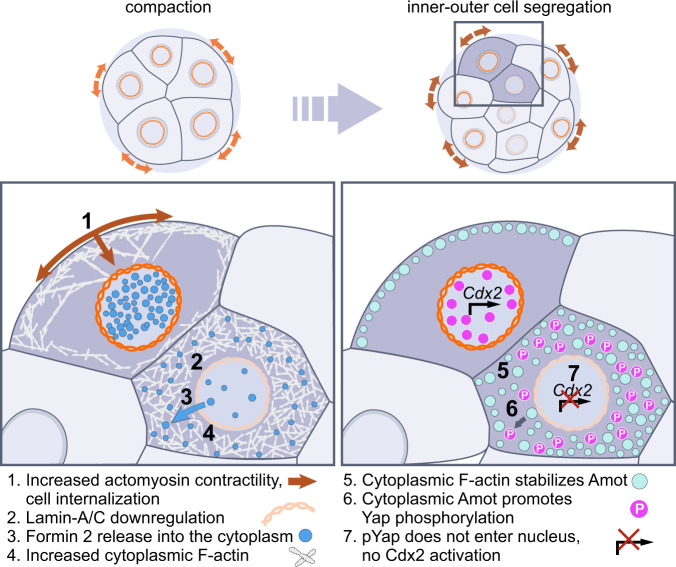
During preimplantation development, contractile forces generated at the apical cortex segregate cells into inner and outer positions of the embryo, establishing the inner cell mass (ICM) and trophectoderm. To which extent these forces influence ICM-trophectoderm fate remains unresolved. Here, we found that the nuclear lamina is coupled to the cortex via an F-actin meshwork in mouse and human embryos. Actomyosin contractility increases during development, upregulating Lamin-A levels, but upon internalization cells lose their apical cortex and downregulate Lamin-A. Low Lamin-A shifts the localization of actin nucleators from nucleus to cytoplasm increasing cytoplasmic F-actin abundance. This results in stabilization of Amot, Yap phosphorylation and acquisition of ICM over trophectoderm fate. By contrast, in outer cells, Lamin-A levels increase with contractility. This prevents Yap phosphorylation enabling Cdx2 to specify the trophectoderm. Thus, forces transmitted to the nuclear lamina control actin organization to differentially regulate the factors specifying lineage identity.


Conflict of interest statement

The authors declare no competing interests.

Figures

Fig. 1
Fig. 1. Lamin-A L:N responds to changes in actomyosin contractility prior to lineage segregation.
a, b 3D immunofluorescence and quantification of Lamin-A/C lamina:nucleoplasm levels (Lamin-A/C L:N) in intact mouse embryos shows that Lamin-A/C L:N increases during development prior to lineage segregation. This is accompanied by changes in nuclear shape, with nuclei becoming more spherical over time. Treatment with H-1152 (50 µM, 4 h) causes a reduction in Lamin-A/C L:N and nuclear sphericity. Insets show 1 µm sections of the nucleus and 3D segmentation of the lamina (transparent) and nucleoplasm (opaque). Dots represent the mean and error bars represent SD (n = 10 for 2-cell, n = 34 for 4-cell, n = 59 for pre-compaction 8-cell, n = 54 for post-compaction 8-cell; P = 0.0002, Kruskal-Wallis test). c, d Immunofluorescence and quantification (fluorescence intensity standardized to DAPI) shows rising phosphorylated-myosin II between the 2-, 8-, and 16-cell stages. Dots represent the mean and error bars represent SD. n = 4 for 2-cell, n = 14 for 8 cell, and n = 16 for 16-cell. P = 0.0007 Kruskal-Wallis test. e Lamin-A/C L:N decreases after treatment with H-1152 at the 8-cell stage. n = 17 for control and H-1152. ****P < 0.0001, Mann-Whitney U test. f, Live-imaging of 4-cell and 8-cell cleavage divisions reveals greater deformation of cell shape at early stages. Utrophin-GFP allows 3D segmentation and analysis of local curvature. n = 11 for 4-8 cell, n = 8 for 8-16 cell. **P = 0.006, Mann-Whitney U test. Staining with phalloidin reveals an F-actin meshwork throughout the cytoplasm in early-stage mouse (g) and human (h) embryos. The meshwork extends from the cell cortex to the nucleus and the cytoplasmic density remains similar between the 2- and 8-cell stages. Representative examples selected from phalloidin stainings of >100 mouse embryos (g) and 9 human embryos (h). i, j Disrupting the contractility of the F-actin meshwork causes a reduction in mRuby-Lamin-A L:N. Spatiotemporally controlled stimulation of azido-blebbistatin was performed using a 860 nm laser targeting the F-actin meshwork between the nucleus and cortex (i). Graph shows mRuby-Lamin-A L:N following photostimulation. n = 4 for apical and basolateral, p = 0.0286, Mann-Whitney U test. All statistical tests are two-tailed. Bars in dot plots represent median and interquartile range. Scale bars, 10 µm. Source data are provided as a Source Data file.
Fig. 2
Fig. 2. Differences in Lamin-A L:N identify lineage segregation in mouse and human embryos.
a, b, Immunofluorescence for Lamin-A/C in fixed mouse embryos (a) and live-imaging of mRuby-Lamin-A (b) at different developmental stages. Images show thin confocal sections to illustrate inner-outer differences. Lamin-A L:N plotted against distance to embryo center of mass. For (a) n = 6 for 16-cell inner, n = 40 for 16-cell outer, n = 21 for blastocyst ICM, n = 33 for blastocyst trophectoderm. For (b) n = 29 for 16-cell inner, n = 48 for 16-cell outer, n = 18 for blastocyst ICM, n = 32 for blastocyst trophectoderm. ****P < 0.0001, Mann-Whitney U test. c, Live-imaging and quantification of mRuby-Lamin-A in embryos treated with H-1152 or blebbistatin show reduced mRuby-Lamin-A L:N. Conversely, embryos expressing the constitutively active RhoA mutant Q63L show increased mRuby-Lamin-A L:N. n = 11 for control outer, n = 5 for control inner, n = 11 for H-1152 outer, n = 6 for H-1152 inner, n = 10 for blebbistatin outer, n = 6 for blebbistatin inner, n = 13 for RhoA Q63L outer and n = 6 for RhoA Q63L inner. ***P < 0.0007, *P = 0.0343 for control outer vs blebbistatin outer, *P = 0.0410 for control outer vs RhoA Q63L outer. *P = 0.0418 control inner vs RhoA Q63L inner. Mann-Whitney U test. d, Human blastocyst immunostained for Lamin-A/C shows lower Lamin-A L:N in the ICM versus trophectoderm (TE). Quantification shows the relationship between Lamin-A/C L:N and distance to embryo center of mass. n = 19 for ICM, n = 108 for trophectoderm (two human blastocysts were analyzed and therefore statistical analysis was not performed). e, Human blastocysts treated with ROCK inhibitor H-1152 have reduced Lamin-A/C L:N (one human blastocyst per group, trophectoderm cells n = 199 for control, n = 95 for H-1152. All statistical tests are two-tailed. Bars in dot plots represent median and interquartile range. Scale bars, 10 µm. Source data are provided as a Source Data file.
Fig. 3
Fig. 3. Lamin-A controls the transcriptional regulators Yap and Cdx2.
a, Cytoplasmic intensity of phospho-Yap and nuclear Cdx2 correlate with Lamin-A/C L:N. Open arrowhead indicates a cell undergoing internalization via apical constriction. n = 48 for phospho-Yap, n = 71 for Cdx2, R2 = 0.42 for phospho-Yap, R2 = 0.66 for Cdx2. b–d, Knockdown of Lamin-A by siRNA causes an increase in cytoplasmic phospho-Yap levels (b), a reduction in nuclear Cdx2 levels (c) and a reduction in nuclear:cytoplasmic Yap levels (d). siRNAs were microinjected into a single cell of the 2-cell embryo. Membrane-GFP or H2B-GFP was used to label injected cells (arrowheads). For (b) n = 9 for control outer, n = 6 for control inner, n = 10 for Lamin-A siRNA outer, n = 4 for Lamin-A siRNA inner. ***P = 0.0004 for control inner vs control outer, ***P = 0.0006 for control outer vs Lamin-A siRNA outer, NS > 0.999. For (c) n = 8 for control outer, n = 6 control inner, n = 6 Lamin-A siRNA outer, n = 4 Lamin-A siRNA inner. ***P = 0.0007 for control inner vs control outer, ***P = 0.0007 for control outer vs Lamin-A siRNA outer, NS = 0.9143. For (d) n = 9 for control outer, n = 6 for control inner, n = 7 for Lamin-A siRNA outer, n = 4 for Lamin-A siRNA inner. ***P = 0.0004 for control inner vs control outer, ***P = 0.0003 for control outer vs Lamin-A siRNA outer, NS = 0.0727. All statistical tests are two-tailed. Fluorescence intensities represent results standardized to DAPI. Bars in dot plots represent median and interquartile range. Scale bars, 10 µm Source data are provided as a Source Data file.
Fig. 4
Fig. 4. Lamin-A regulates the F-actin meshwork, which serves as a scaffold to stabilize cytoplasmic Amot.
a, Amot levels are increased in the cytoplasm of inner cells. Immunofluorescence images of Amot in fixed mouse embryos with standardized Amot intensity, n = 18 for outer, n = 5 for inner **P = 0.0011, Mann-Whitney U test. b, Knockdown of Lamin-A by siRNA causes an increase in cytoplasmic levels of Amot in outer cells. siRNAs were microinjected at the 1-cell stage. n = 18 for control, n = 10 for Lamin-A siRNA **P = 0.003, Mann-Whitney U test. c, F-actin meshwork density increases in the cytoplasm of inner cells at the 16-cell stage and in the ICM at the blastocyst stage. Insets show detail of cytoplasmic meshwork (cyt) and absence of actin in the nucleus (nuc). n = 5 for 16-cell inner, n = 6 for 16-cell outer, n = 8 for blastocyst ICM, n = 25 for blastocyst trophectoderm **P = 0.0087, ***P = 0.001, Mann-Whitney U test. d, Latrunculin A causes Amot disruption. Note the decrease in cytoplasmic Amot in the inner cell cytoplasm. n = 9 for control, n = 10 Latrunculin A, **P = 0.0061 Mann-Whitney U test. e, Knockdown of Lamin-A by siRNA causes an increase in cytoplasmic F-actin levels. siRNA was microinjected into a single cell of the 2-cell embryo. H2B-GFP labels injected cells. Inset shows detailed view of cytoplasmic F-actin. n = 12 for control, n = 10 for Lamin-A siRNA. ****P < 0.0001, Mann-Whitney U test. f, g, Human blastocysts immunostained for Amot (f) and stained with phalloidin (g) show increased levels of cytoplasmic Amot and F-actin in the ICM compared to trophectoderm (TE). For Amot (f), n = 2 human embryos (no statistical comparison performed). For phalloidin (g), n = 3 human embryos. P = 0.0025 by paired two-tailed t-test. For human embryos, dots represent individual cells. Fluorescence intensities represent results standardized to DAPI. Bars in dot plots represent median and interquartile range. All statistical tests are two-tailed. Scale bars, 10 µm. Source data are provided as a Source Data file.
Fig. 5
Fig. 5. Lamin-A regulates fate by controlling actin nucleator localization.
a, Formin 2 shows a high nuclear:cytoplasmic ratio, which is increased in outer cells following cell internalization. n = 4 for all stages. *P = 0.0286, Mann-Whitney U test. b, Knockdown of Lamin-A by siRNA reduces nuclear:cytoplasmic Formin 2. siRNA was microinjected at the 1-cell stage. Insets show reduced levels of Lamin-A in siRNA. n = 14 for control, n = 10 for Lamin-siRNA. *P = 0.0470, Mann-Whitney U test. c, Treatment with SMIFH2 reduces inner cell F-actin and increases nuclear:cytoplasmic Yap. 16-cell embryos were either treated with DMSO (control) or 250 µM SMIFH2 and immunostained for Yap and with phalloidin. Insets highlight the differences between inner cell cytoplasmic phalloidin intensity and nuclear Yap intensity between control and treated embryos. *P = 0.0364, **P = 0.0024, Mann-Whitney U test. d, e, Emerald-Formin 2 overexpression. Emerald-Formin 2 RNA was microinjected into a single cell of the 2-cell embryo, fixed at the 16-cell stage and immunostained for either Yap or Amot. Injected cells can be identified by Emerald-Formin 2 expression (arrowheads). Injected outer cells show increases in cytoplasmic phalloidin, nuclear Yap and cytoplasmic Amot intensities compared to uninjected cells. For panel (d) n = 10 for Emerald-Formin 2 (injected cells), n = 9 for control (uninjected cells). ***P = 0.0006, *P = 0.0244, Mann-Whitney U test. For panel (e) n = 9 for control (uninjected cells), n = 10 for Emerald-Formin 2 (injected cells). **P = 0.0063, *P = 0.0414, Mann-Whitney U test. Fluorescence intensities represent results standardized to DAPI. Bars in dot plots represent median and interquartile range. All statistical tests are two-tailed. Scale bars, 10 µm. Source data are provided as a Source Data file.
Fig. 6
Fig. 6. Schematic summary of main results.
Schematic summary shows the main events allowing Lamin-A to link changes in mechanical forces to cell fate in the embryo.

References

    1. Johnson MH, Ziomek CA. The foundation of two distinct cell lineages within the mouse morula. Cell. 1981;24:71–80. doi: 10.1016/0092-8674(81)90502-X. - DOI - PubMed
    1. Samarage CR, et al. Cortical tension allocates the first inner cells of the mammalian embryo. Dev. Cell. 2015;34:435–447. doi: 10.1016/j.devcel.2015.07.004. - DOI - PubMed
    1. Strumpf D, et al. Cdx2 is required for correct cell fate specification and differentiation of trophectoderm in the mouse blastocyst. Development. 2005;132:2093–2102. doi: 10.1242/dev.01801. - DOI - PubMed
    1. Ralston A, Rossant J. Cdx2 acts downstream of cell polarization to cell-autonomously promote trophectoderm fate in the early mouse embryo. Dev. Biol. 2008;313:614–629. doi: 10.1016/j.ydbio.2007.10.054. - DOI - PubMed
    1. Sudol M, et al. Characterization of the mammalian YAP (Yes-associated protein) gene and its role in defining a novel protein module, the WW domain. J. Biol. Chem. 1995;270:14733–14741. doi: 10.1074/jbc.270.24.14733. - DOI - PubMed

Publication types

LinkOut - more resources