

Menstrual cycle length variation by demographic characteristics from the Apple Women's Health Study
- PMID: 37248288
- PMCID: PMC10226714
- DOI: 10.1038/s41746-023-00848-1
Menstrual cycle length variation by demographic characteristics from the Apple Women's Health Study
Abstract
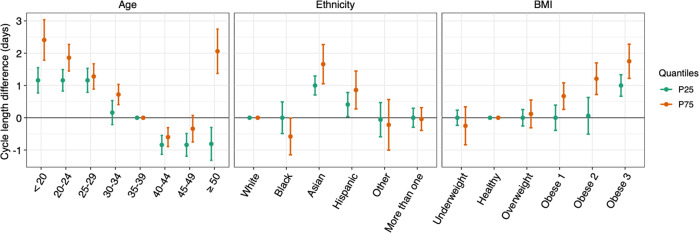
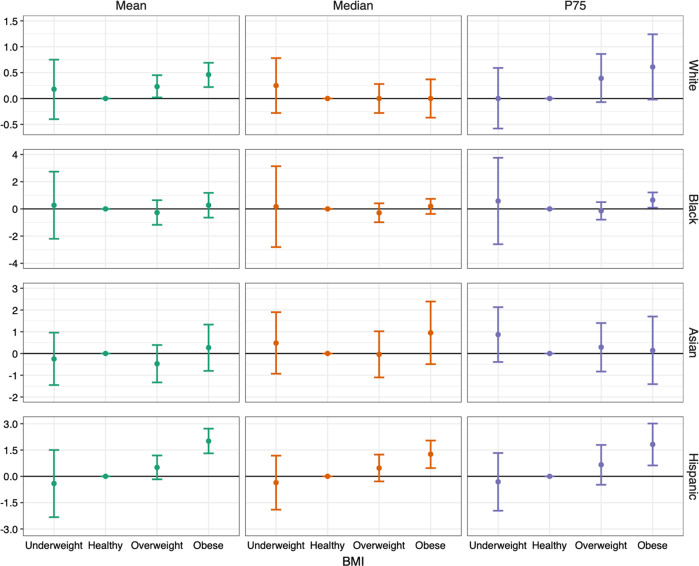
Menstrual characteristics are important signs of women's health. Here we examine the variation of menstrual cycle length by age, ethnicity, and body weight using 165,668 cycles from 12,608 participants in the US using mobile menstrual tracking apps. After adjusting for all covariates, mean menstrual cycle length is shorter with older age across all age groups until age 50 and then became longer for those age 50 and older. Menstrual cycles are on average 1.6 (95%CI: 1.2, 2.0) days longer for Asian and 0.7 (95%CI: 0.4, 1.0) days longer for Hispanic participants compared to white non-Hispanic participants. Participants with BMI ≥ 40 kg/m2 have 1.5 (95%CI: 1.2, 1.8) days longer cycles compared to those with BMI between 18.5 and 25 kg/m2. Cycle variability is the lowest among participants aged 35-39 but are considerably higher by 46% (95%CI: 43%, 48%) and 45% (95%CI: 41%, 49%) among those aged under 20 and between 45-49. Cycle variability increase by 200% (95%CI: 191%, 210%) among those aged above 50 compared to those in the 35-39 age group. Compared to white participants, those who are Asian and Hispanic have larger cycle variability. Participants with obesity also have higher cycle variability. Here we confirm previous observations of changes in menstrual cycle pattern with age across reproductive life span and report new evidence on the differences of menstrual variation by ethnicity and obesity status. Future studies should explore the underlying determinants of the variation in menstrual characteristics.
© 2023. The Author(s).
Conflict of interest statement
All authors declare no support from any organization for the submitted work; C.L.C. and T.F.C. are employed by Apple Inc. and own Apple Inc. stock. No financial relationships with any organizations that might have an interest in the submitted work in the previous three years; no other relationships or activities that could appear to have influenced the submitted work.
Figures
References
-
- American Academy of Pediatrics Committee on Adolescence, American College of Obstetricians and Gynecologists Committee on Adolescent Health Care. Diaz A, Laufer MR, Breech LL. Menstruation in girls and adolescents: using the menstrual cycle as a vital sign. Pediatrics. 2006;118:2245–2250. doi: 10.1542/peds.2006-2481. - DOI - PubMed
LinkOut - more resources
Full Text Sources
