. 2023 May 29;14(1):3103.
doi: 10.1038/s41467-023-38899-3.

Natural killer cells and innate lymphoid cells 1 tune anxiety-like behavior and memory in mice via interferon-γ and acetylcholine

Affiliations

Natural killer cells and innate lymphoid cells 1 tune anxiety-like behavior and memory in mice via interferon-γ and acetylcholine

Stefano Garofalo et al. Nat Commun. .

Abstract

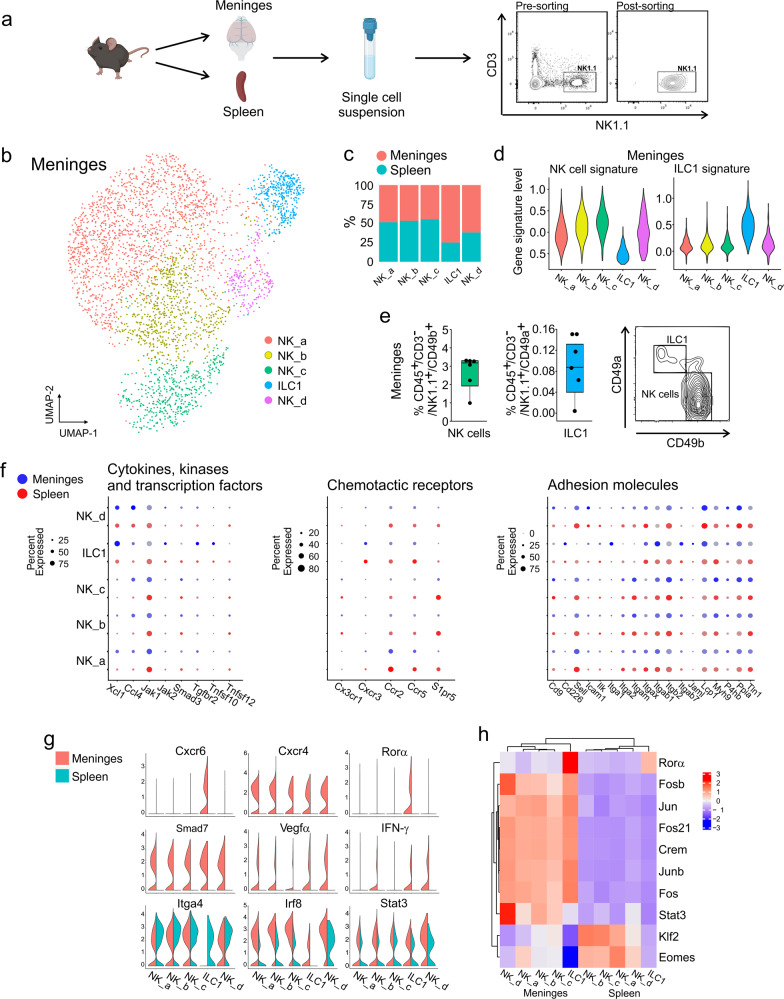
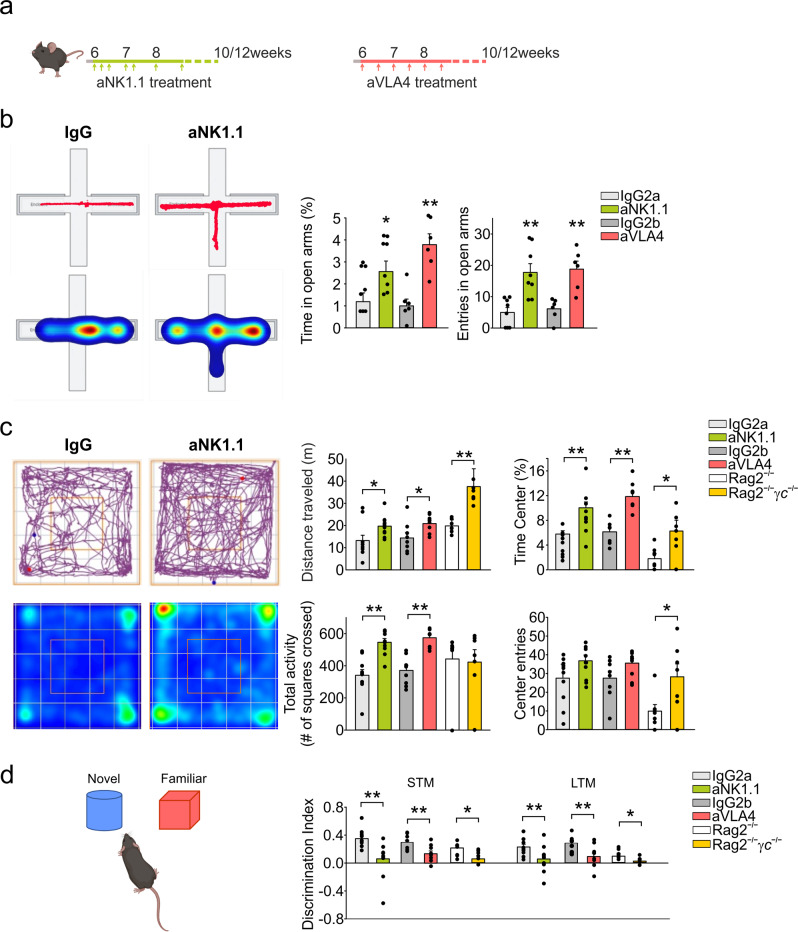
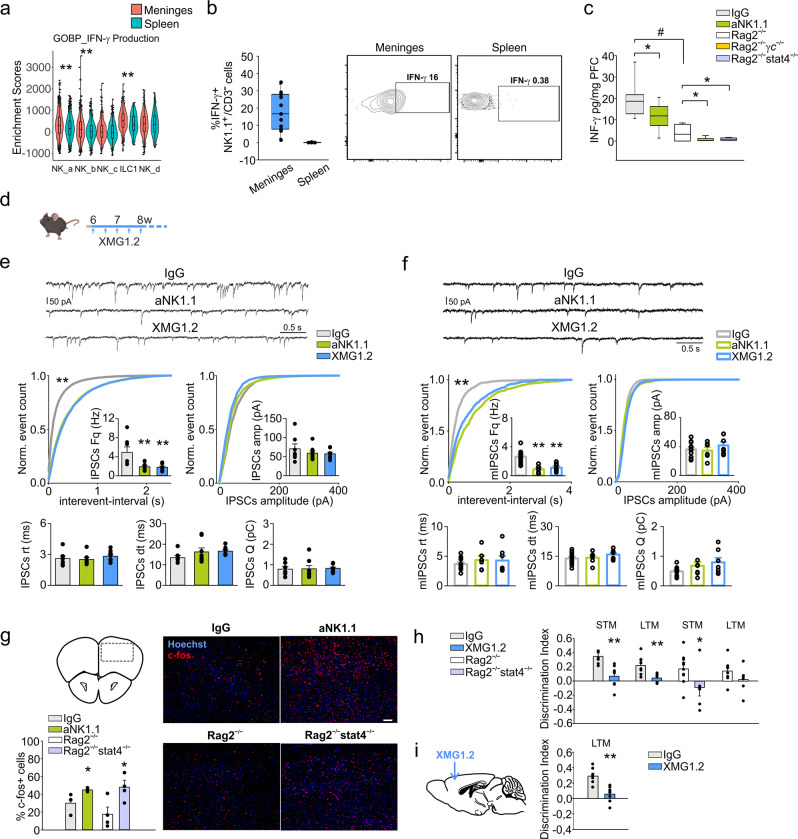
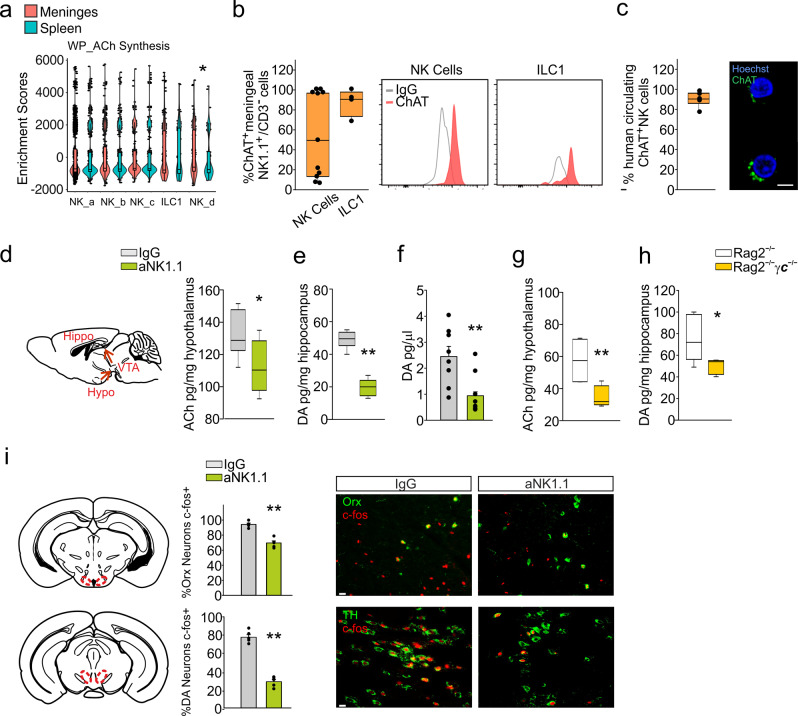
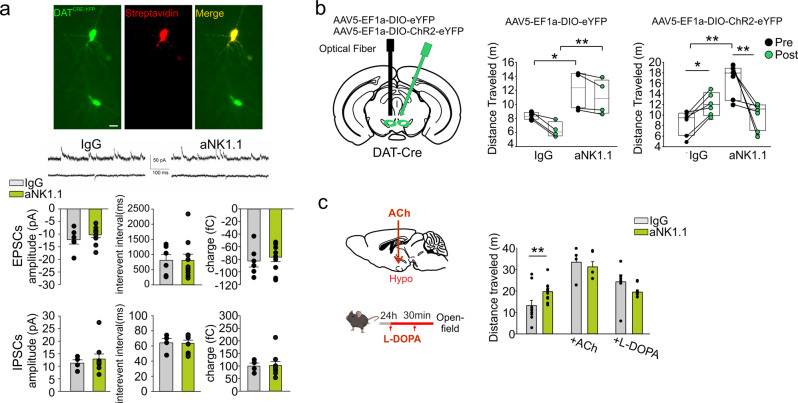
The mechanisms of communication between the brain and the immune cells are still largely unclear. Here, we characterize the populations of resident natural killer (NK) cells and innate lymphoid cells (ILC) 1 in the meningeal dura layer of adult mice. We describe that ILC1/NK cell-derived interferon-γ and acetylcholine can contribute to the modulation of brain homeostatic functions, shaping synaptic neuronal transmission and neurotransmitter levels with effects on mice behavior. In detail, the interferon-γ plays a role in the formation of non-spatial memory, tuning the frequency of GABAergic neurotransmission on cortical pyramidal neurons, while the acetylcholine is a mediator involved in the modulation of brain circuitries that regulate anxiety-like behavior. These findings disclose mechanisms of immune-to-brain communication that modulate brain functions under physiological conditions.


Conflict of interest statement

The authors declare no competing interests.

Figures

Fig. 1
Fig. 1. Transcriptional landscape of meningeal NK cells and ILC1.
a Schematic overview of sorted meningeal or splenic CD3/NK1.1+ cells. C57BL/6 mice (n = 50) were intracardially perfused with PBS, and CD3/NK1.1+ cells were sorted from meninges or spleen. Figure created with BioRender.com. b UMAP representation of CD3/NK1.1+ cells derived from meninges (3392 cells). Profiles colored are from clusters identified subsets of NK cells and ILC1. c Percentage of NK cell subsets and ILC1 obtained in the meninges and spleen. d Violin plots represent the distribution of ILC1 and NK cell gene expression programs defined in Robinette et al., grouped by clusters in the meninges. e NK cells and ILC1 frequency in the meninges of C57BL/6 mice (n = 6). Right: representative FACS analysis of meningeal ILC1/NK cells. For boxplots, the center line, boxes and whiskers represent the median, inner quartiles, and rest of the data distribution, respectively. f DotPlot represent the expression levels of ILCs archetypal genes within the identified NK cells and ILC1 clusters in meninges and spleen. g Violin plots represent the distribution of indicated genes grouped by clusters and divided for tissue. h Heatmap of the scaled regulon activity for select regulons expressed in each NK cell and ILC1 population.
Fig. 2
Fig. 2. Role of NK cells and ILC1 in mice behavior.
a Scheme of aNK1.1 and aVLA4 treatments in C57BL/6 mice. b The percentage of time spent and the frequency of entries in the open arms in elevated plus maze in IgG2a and aNK1.1 treated mice (n = 8 mice per condition; *p = 0.048, **p < 0.001 two-tailed Student’s t test), and IgG2b and aVLA4 treated mice (n = 6 mice per condition, **p < 0.001 two-tailed Student’s t test). Data are expressed as mean ± SEM. c Open-field test (10 min) results for IgG2a-, aNK1.1-, IgG2b-, aVLA4-treated mice (n = 10 IgG2a and aNK1.1, n = 8 IgG2b and aVLA4 mice), and Rag2−/− and Rag2−/−γc−/− mice (n = 7 per condition) showing total distance traveled (*p = 0.039 IgG2a vs aNK1.1 mice, *p = 0.037 IgG2b vs aVLA4 mice, **p = 0.002 Rag2−/− vs Rag2−/−γc−/−), percent time spent in the center (**p < 0.001 IgG2a vs aNK1.1 and IgG2b vs aVLA4 mice, **p = 0.022 Rag2−/− vs Rag2−/−γc−/−), center episodes (p = 0.102 IgG2a vs aNK1.1 mice, p = 0.151 IgG2b vs aVLA4 mice, *p = 0.036 Rag2−/− vs Rag2−/−γc−/−), and the total activity (**p < 0.001 IgG2a vs aNK1.1 and IgG2b vs aVLA4 mice; two-tailed Student’s t test). Data are expressed as mean ± SEM. d Discrimination index analyzed after 1 h (short term memory - STM) and 24 h (long term memory - LTM) in mice treated with IgG2a, aNK1.1, IgG2b and aVLA4 (n = 10 IgG2a and aNK1.1, n = 8 IgG 2b and aVLA4 mice, **p = 0.003 IgG2a vs aNK1.1, **p = 0.004 IgG2b vs aVLA4, one-way ANOVA), and in Rag2−/− and Rag2−/−γc−/− mice (n = 7 mice per condition, *p = 0.011 one-way ANOVA). Data are expressed as mean ± SEM. c, d Open-field test results on distance traveled for IgG2a-treated mice vs Rag2−/− and Rag2−/−γc−/− (**p < 0.01 IgG2a vs Rag2−/− mice, **p < 0.001 IgG2a vs Rag2−/−γc−/− mice, two-way ANOVA). Object novelty discrimination in IgG2a-treated mice vs Rag2−/− and Rag2−/−γc−/− mice (STM **p < 0.001 IgG2a vs Rag2−/− and Rag2−/−γc−/− mice; LTM **p < 0.01 IgG2a vs Rag2−/− mice, two-way ANOVA). Data are representative of at least two experiments with similar results. a, d Figure created with BioRender.com.
Fig. 3
Fig. 3. ILC1-NKcells derived-IFN-γ regulates non spatial memory.
a Violin plot of the distribution of genes related to IFN-γ production in different clusters and tissue (n = 50 mice **p < 0.01 Kruskal–Wallis post-hoc Dunn test). b FACS analysis of frequency of IFN-γ+ cells in the CD3/NK1.1+ cell population obtained from the meninges and spleen (n = 11). Right: representative plot of meningeal and splenic frequency of CD3/NK1.1+ cells. c Level of IFN-γ protein in the PFC of mice treated with IgG or aNK1.1 (n = 9 mice per condition, *p = 0.033 two-tailed Student’s t test), and Rag2−/−, Rag2−/−γc−/− and Rag2−/−stat4−/− mice (n = 7 mice per group, *p = 0.013 two-tailed Student’s t test; IgG-treated mice vs Rag2−/− #p < 0.001 two-tailed Student’s t test). For boxplots (a–c) the center line, boxes and whiskers represent the median, inner quartiles, and rest of the data distribution, respectively. d Scheme of XMG1.2 treatment in C57BL/6 mice. e Top: Representative traces of sIPSCs recorded in PFC L5 pyramidal neurons obtained from mice chronically treated with IgG, aNK1.1, or XMG1.2. Bottom: Cumulative distribution and bar graph (inset) of interevent-interval, amplitude values, rise time (rt), decay time (dt) and mean charge (Q) mean values of sIPSCs obtained from 7, 8, and 8 cells recorded from mice treated with IgG, aNK1.1, and XMG1.2, respectively (one-way ANOVA **p < 0.001, Ks = 0.95). The inset bar graph represents the mean frequency values recorded in the same cells (one-way ANOVA **p = 0.005). Data are expressed as mean ± SEM. f Top: Representative traces of mIPSCs recorded in L5 pyramidal neurons obtained from mice chronically treated with IgG, aNK1.1, or XMG1.2. Bottom: Cumulative distribution of interevent-interval, amplitude values, rise time (rt), decay time (dt) and mean charge (Q) mean values of mIPSCs obtained from 11, 7, and 6 cells recorded from mice treated with IgG, aNK1.1, and XMG1.2, respectively (**p < 0.001, Ks = 0.68). The inset bar graph represents the mean frequency values recorded in the same cells (*p < 0.001). Data are expressed as mean ± SEM. g Analysis of c-fos+ cells in the PFC of mice treated with IgG or aNK1.1 and Rag2−/− or Rag2−/−stat4−/− mice expressed as % of total nuclei (n = 4 mice per group, *p < 0.034 two-tailed Student’s t test). Representative immunofluorescences on the right. Error bars show mean ± SEM. Scale bar: 100 μm. h Discrimination index in NOR test analyzed after 1 h (STM) and 24 h (LTM) in mice treated with IgG and XMG1.2 (n = 8 mice per condition; **p < 0.001 one-way ANOVA), and Rag2−/− (n = 11) and Rag2−/−stat4−/− (n = 7) mice (*p = 0.034 one-way ANOVA). Data are expressed as mean ± SEM. i Left: Scheme of XMG1.2 intracerebral administration in C57BL/6 mice. Right: Discrimination index in NOR test analyzed in mice with intra-hippocampal administration of IgG or XMG1.2 (n = 7 mice per condition; **p < 0.004 one-way ANOVA). Data are expressed as mean ± SEM. (d, g, i) Figure created with BioRender.com.
Fig. 4
Fig. 4. ILC1-NKcells derived-Ach regulates anxiety like behavior.
a Violin plot of the distribution of genes related to ACh synthesis in different clusters and tissue (n = 50 mice *p < 0.05 Kruskal–Wallis post-hoc Dunn test). b FACS analysis of the frequency of ChAT+ cells in the CD3/NK1.1+/CD49b+ (NK) cell (n = 6) and CD3/NK1.1+/CD49a+ cell (ILC1) (n = 4) populations obtained from the meninges. c) Immunofluorescence analysis of the percentage of ChAT+ NK cells collected from the blood of healthy donors (n = 6). Scale bar: 5 μm. For boxplots (ac) the center line, boxes and whiskers represent the median, inner quartiles, and rest of the data distribution, respectively. d Left: Scheme of ACh intracerebral administration in C57BL/6 mice. Right: Expression of ACh in the hypothalamus of mice treated with IgG or aNK1.1 (n = 6 mice per condition, *p = 0.036 two-tailed Student’s t test). Left: Scheme of hypothalamus-VTA-hippocampus circuit. e Expression of DA in the hippocampus of mice treated with IgG or aNK1.1 (n = 6 mice per condition, **p < 0.001 two-tailed Student’s t test). f Microdialysis of basal DA in the hippocampus of IgG- (n = 6) or aNK1.1-treated (n = 9 mice, **p = 0.005 one-way ANOVA). g Expression of ACh in the hypothalamus of Rag2−/− and Rag2−/−γc−/− mice (n = 6 mice per group, **p = 0.002 two-tailed Student’s t test). h Expression of DA in the hippocampus of Rag2−/− and Rag2−/−γc−/− mice (n = 6 mice per condition, *p = 0.019 two-tailed Student’s t test). For boxplots (dh), the center line, boxes and whiskers represent the median, inner quartiles, and rest of the data distribution, respectively. i Immunohistochemistry demonstrating c-Fos expression in orexin hypotalamic neurons and in VTA dopaminergic neurons following behavioral test in IgG- or aNK1.1-treated mice. Center: quantification of c-Fos+ cells express as percentage of total Orx+ or TH+ neurons in the different areas (n = 6 mice per condition; **p < 0.001, two-tailed Student’s t test. Scale bar: 50 μm). Data are expressed as mean ± SEM. (d, i) Figure created with BioRender.com.
Fig. 5
Fig. 5. Optogenetically reactivated VTA restores aNK1.1-mice behavior.
a Middle: Representative traces of sIPSCs (upper) and sEPSCs (lower) recorded in VTA DATCRE-yfp neurons (top) obtained from mice treated with IgG and aNK1.1. Scale bar: 20 μm. Bottom: Bar graph of interevent-interval, amplitude values, and charge mean values of sIPSCs and sEPSCs obtained from 6 cells recorded from mice. b Left: scheme of virus injection and optic fiber implantation. Right: in the open-field test, ChR2:YFP-expressing IgG-treated mice increase the distance traveled, in contrast the aNK1.1-treated mice displayed a reduction in the explorative behavior (after 5 min in the new arena light stimulation is carried out, maintained for additional 5 min) (n = 6 mice per treatment, one-way ANOVA *p < 0.05 **p < 0.01). c Left: Scheme of ACh and L-DOPA administration in C57BL/6 mice. Right: Open-field test results for IgG- and aNK1.1-treated mice after the intra-hypothalamic administration of ACh or i.p. injection with L-DOPA as indicated (left), showing total distance traveled (n = 10 IgG- and aNK1.1 mice; n = 6 ACh-IgG- and ACh-aNK1.1 mice; **p < 0.001 two-way ANOVA; L-DOPA IgG vs aNK1.1 **p = 0.002, two-way ANOVA). Data are expressed as mean ± SEM. b, c Figure created with BioRender.com.

References

    1. Schafflick D, et al. Single-cell profiling of CNS border compartment leukocytes reveals that B cells and their progenitors reside in non-diseased meninges. Nat. Neurosci. 2021;24:1225–1234. doi: 10.1038/s41593-021-00880-y. - DOI - PubMed
    1. Rustenhoven J, et al. Functional characterization of the dural sinuses as a neuroimmune interface. Cell. 2021;184:1000–1016.e27. doi: 10.1016/j.cell.2020.12.040. - DOI - PMC - PubMed
    1. Alves de Lima K, et al. Meningeal γδ T cells regulate anxiety-like behavior via IL-17a signaling in neurons. Nat. Immunol. 2020;21:1421–1429. doi: 10.1038/s41590-020-0776-4. - DOI - PMC - PubMed
    1. Cugurra A, et al. Skull and vertebral bone marrow are myeloid cell reservoirs for the meninges and CNS parenchyma. Science. 2021;373:eabf7844. doi: 10.1126/science.abf7844. - DOI - PMC - PubMed
    1. Brioschi S, et al. Heterogeneity of meningeal B cells reveals a lymphopoietic niche at the CNS borders. Science. 2021;373:eabf9277. doi: 10.1126/science.abf9277. - DOI - PMC - PubMed

Publication types