. 2023 Jun;29(6):1448-1455.
doi: 10.1038/s41591-023-02358-9. Epub 2023 May 29.

Propagative α-synuclein seeds as serum biomarkers for synucleinopathies

Affiliations

Propagative α-synuclein seeds as serum biomarkers for synucleinopathies

Ayami Okuzumi et al. Nat Med. 2023 Jun.

Erratum in

  • Author Correction: Propagative α-synuclein seeds as serum biomarkers for synucleinopathies.
    Okuzumi A, Hatano T, Matsumoto G, Nojiri S, Ueno SI, Imamichi-Tatano Y, Kimura H, Kakuta S, Kondo A, Fukuhara T, Li Y, Funayama M, Saiki S, Taniguchi D, Tsunemi T, McIntyre D, Gérardy JJ, Mittelbronn M, Kruger R, Uchiyama Y, Nukina N, Hattori N. Okuzumi A, et al. Nat Med. 2025 Feb;31(2):698. doi: 10.1038/s41591-025-03521-0. Nat Med. 2025. PMID: 39856337 Free PMC article. No abstract available.

Abstract

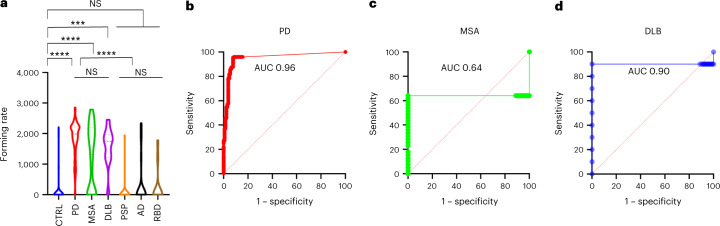
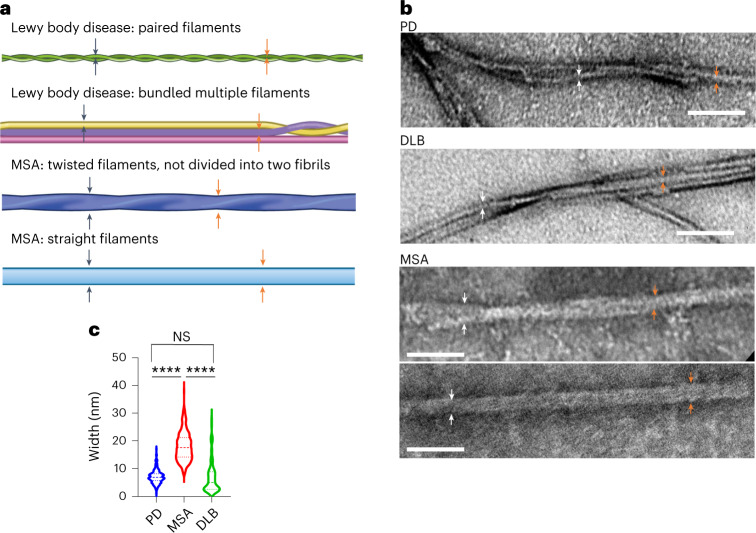
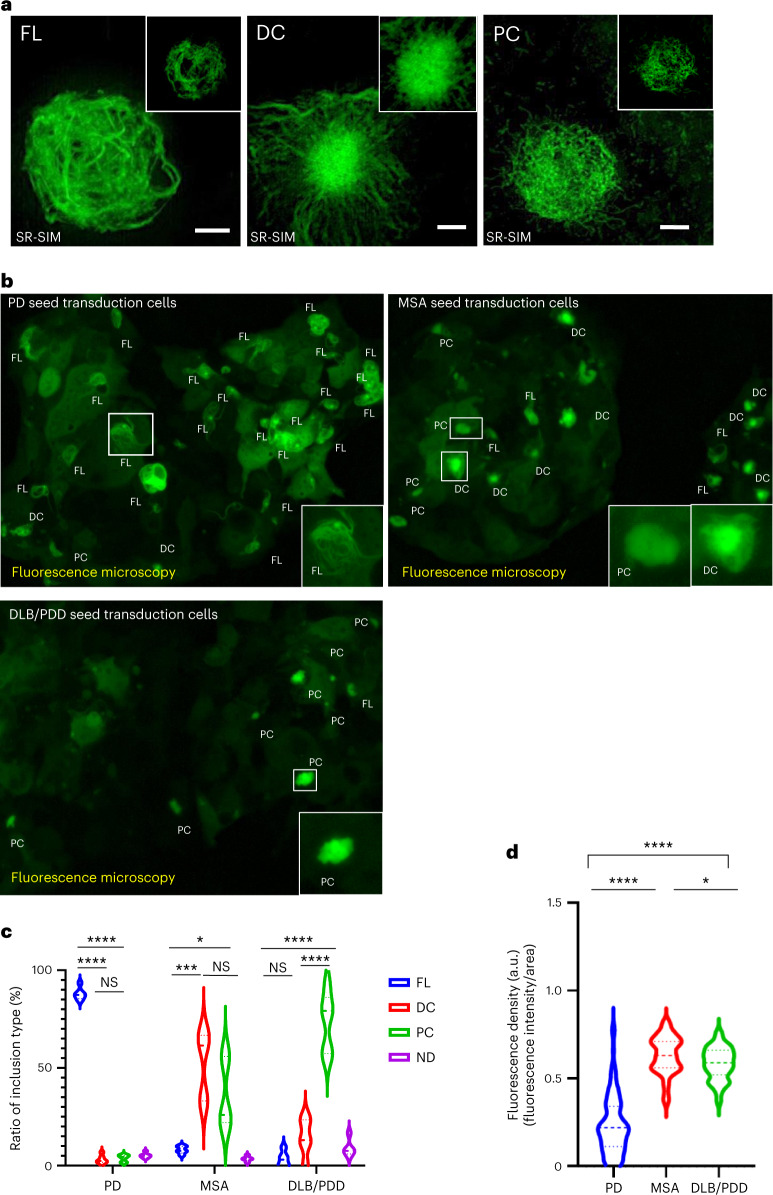
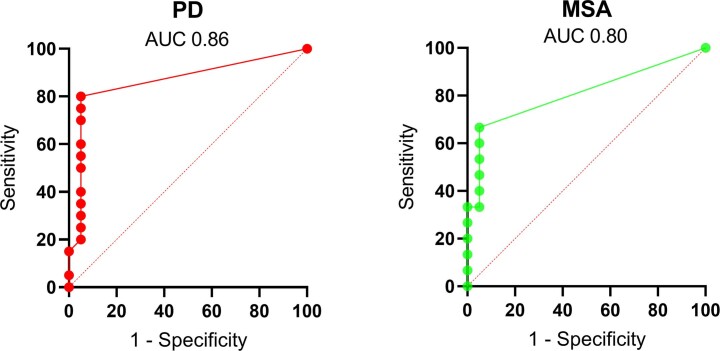
Abnormal α-synuclein aggregation is a key pathological feature of a group of neurodegenerative diseases known as synucleinopathies, which include Parkinson's disease (PD), dementia with Lewy bodies and multiple system atrophy (MSA). The pathogenic β-sheet seed conformation of α-synuclein is found in various tissues, suggesting potential as a biomarker, but few studies have been able to reliably detect these seeds in serum samples. In this study, we developed a modified assay system, called immunoprecipitation-based real-time quaking-induced conversion (IP/RT-QuIC), which enables the detection of pathogenic α-synuclein seeds in the serum of individuals with synucleinopathies. In our internal first and second cohorts, IP/RT-QuIC showed high diagnostic performance for differentiating PD versus controls (area under the curve (AUC): 0.96 (95% confidence interval (CI) 0.95-0.99)/AUC: 0.93 (95% CI 0.84-1.00)) and MSA versus controls (AUC: 0.64 (95% CI 0.49-0.79)/AUC: 0.73 (95% CI 0.49-0.98)). IP/RT-QuIC also showed high diagnostic performance in differentiating individuals with PD (AUC: 0.86 (95% CI 0.74-0.99)) and MSA (AUC: 0.80 (95% CI 0.65-0.97)) from controls in a blinded external cohort. Notably, amplified seeds maintained disease-specific properties, allowing the differentiation of samples from individuals with PD versus MSA. In summary, here we present a novel platform that may allow the detection of individuals with synucleinopathies using serum samples.


Conflict of interest statement

N.H. reports receiving grants and fees unrelated to this research during the conduct of the study; grants from the Japan Society for the Promotion of Science (JSPS), the Japan Agency for Medical Research and Development (AMED), the Japan Science and Technology Agency (JST), the Health and Labour Sciences Research Grant, the International Parkinson and Movement Disorder Society and the Michael J. Fox Foundation for Parkinsonʼs Research; personal fees for speakers honoraria from Sumitomo Pharma, Takeda Pharmaceutical, Kyowa Kirin, AbbVie GK, Otsuka Pharmaceutical, Novartis, Ono Pharmaceutical, Eisai, Teijin Pharma and Daiichi Sankyo; and personal fees for consultancies and advisory boards from Sumitomo Pharma, Takeda Pharmaceutical, Kyowa Kirin, Ono Pharmaceutical, Teijin Pharma and PARKINSON Laboratories. N.H. also owns shares in PARKINSON Laboratories (equity stock (8%)). T.H. reports receiving grants from Kyowa Kirin, the Setsuro Fujii Memorial of the Osaka Foundation for Promotion of Fundamental Medical Research, JSPS KAKENHI (under grant no. 21K07424), the Japan Agency for Medical Research and Development (grant nos. 21wm0425015 and 21dk0207055) and Daiichi Sankyo Selects Research Partners for TaNeDS Collaborative Drug Discovery Project and speakers honoraria from Sumitomo Dainippon Pharma, Takeda Pharmaceutical, Kyowa Kirin, Novartis, Sanofi, Eisai and Otsuka Pharmaceutical during the conduct of the study. A.O. reports receiving grants from the research grant for biogenic amines and neurological disorders and JSPS KAKENHI (under grant no. 19K16928) and speakers honoraria from Takeda Pharmaceutical and Kyowa Kirin, during the conduct of the study. R.K. reports receiving grants and fees unrelated to this research during the conduct of the study; grants from the Fonds National de la Recherche (FNR) Luxembourg, the Fondation Veuve-Metz-Tesch Luxembourg, the Leir Foundation, the Michael J. Fox Foundation for Parkinsonʼs Research (MJFF), the Parkinsonʼs Foundation, the Movement Disorder Society, the European Institute of Innovation and Technology (EIT Health), the Innovative Medicines Initiative (IMI) of the European Union and the European pharmaceutical industry and the European Union’s Horizon 2020 and Horizon Europe research and innovation programs; and personal speaker’s honoraria and/or travel grants from AbbVie, Zambon and Medtronic. R.K. participated as PI or site-PI for industry-sponsored clinical trials without receiving honoraria. The remaining authors declare no competing interests.

Figures

Fig. 1
Fig. 1. Parameters describing the kinetics of α-synuclein aggregation in the serum IP/RT-QuIC and ROC analysis of the diagnostic performance of serum IP/RT-QuIC for synucleinopathy.
a, Comparison of the forming rates of each group. The violin plots match those represented in the kinetic curves. Violin plots show the range and average distribution. The symbols indicate outliers according to Tukey’s test. Statistical analysis was performed using two-sided one-way ANOVA with Tukeyʼs multiple comparisons test, resulting in a significance of P < 0.001 (***) and P < 0.0001 (****) between each group (CTRL versus PD, P < 0.0001; CTRL versus MSA, P < 0.0001; CTRL versus DLB, P = 0.0001; CTRL versus PSP, P = 0.9914; CTRL versus AD, P = 0.8547; CTRL versus RBD, P = 0.9300; PD versus MSA, P = 0.9971; PD versus DLB, P = 0.9277; MSA versus DLB, P = 0.8415; PSP versus AD, P = 0.6755; PSP versus RBD, P = 0.9660; AD versus RBD, P > 0.9999; PD, MSA and DLB versus PSP, AD and RBD, P < 0.0001). b–d, ROC curves for serum IP/RT-QuIC comparing the control group to PD (b), MSA (c) and DLB (d). NS, not significant.
Fig. 2
Fig. 2. Structural differences between products of serum IP/RT-QuIC derived from participants with LB diseases or MSA.
a, Schematic view of the main morphology of serum IP/RT-QuIC products derived from patients with LB diseases and MSA. Arrows indicate the measurement sites. b, Negative-stained TEM images of serum IP/RT-QuIC products derived from patients with PD, DLB and MSA. c, Violin plots show the range and average distribution. Statistical analysis was performed using one-way ANOVA followed by Tukey’s correction, resulting in significances of P < 0.0001 (****) among PD, DLB and MSA (PD versus MSA, P < 0.0001; PD versus DLB, P = 0.9514; MSA versus DLB, P < 0.0001). We measured the widths of 10 fibrils and took measurements at two sites for each fibril (PD (n = 50), MSA (n = 25), DLB (n = 9)). Scale bars, 100 nm. NS, not significant.
Fig. 3
Fig. 3. Serum IP/RT-QuIC-amplified α-synuclein seeds from participants with PD, MSA and DLB/PDD induce intracellular inclusions with distinct morphologies.
a, Intracellular α-synuclein inclusions generated by serum IP/RT-QuIC products derived from patients with PD, MSA and DLB are visualized using SR-SIM. Representative morphologies of GFP-fused α-synuclein A53T inclusions generated by each disease-derived seed transduction in 293-SynG cells are shown. There are three different morphologies, including fibrous (FL), dense-core (DC) and pale-core (PC) inclusion (n = 5 different samples). The inset shows a single layer of the center slice of the inclusions. Scale bars are 2 μm, and the inset sides of the square are 10 µm. b, Images using BZ-X810 are generated as the full-focus image based on 10–20 z-stack images with 3-µm steps with a ×40 objective lens, and insets represent magnified images of inclusions in the square. Representative low-resolution images of 293-SynG cells transduced with each disease-derived seed. c, Violin plots indicate the ratio of each type of inclusion in five (MSA and DLB/PDD) or six (PD) independent low-resolution images obtained from each disease-specific seed transduced cell and evaluated in a blinded manner by three independent examiners as indicated. Statistical analysis was performed using a two-sided one-way ANOVA followed by Tukey’s correction, resulting in significances of P < 0.05 (*), P < 0.001 (***) and P < 0.0001 (****) among FL, DC, PC and ND among each synucleinopathy (PD: FL versus DC, P < 0.0001; FL versus PC, P < 0.0001; DC versus PC, P = 0.9596; MSA: FL versus DC, P = 0.0002; FL versus PC, P = 0.0131; DC versus PC, P = 0.2351; DLB/PDD: FL versus DC, P = 0.3194; FL versus PC, P < 0.0001; DC versus PC, P < 0.0001). d, The fluorescence density of intracellular α-synuclein inclusions, which was calculated as low-resolution fluorescence intensity of inclusion bodies divided by the area of inclusions, generated by seeds derived from patients with PD, MSA and DLB/PDD (PD versus MSA, P < 0.0001; PD versus DLB/PDD, P < 0.0001; MSA versus DLB/PDD, P = 0.0254) (n > 20 for each group). Violin plots show the range and average distribution. Statistical analysis was performed using a two-sided one-way ANOVA followed by Tukey’s correction, resulting in significances of P < 0.0001 (****) and P < 0.05 (*) among PD, MSA and DLB/PDD. ND, not determined; NS, not significant.
Extended Data Fig. 1
Extended Data Fig. 1. ROC analysis of the diagnostic performance of serum IP/RT-QuIC for synucleinopathy in the external cohort.
ROC curves for serum IP/RT-QuIC comparing the control group with PD and MSA groups. AUC, the area under the curve; MSA, multiple system atrophy; PD, Parkinson’s disease.
Extended Data Fig. 2
Extended Data Fig. 2. Morphological analysis of amplified products derived from the serum and CSF of PD and MSA cases.
(a-d) Negative-stained transmission electron microscopy images of α-synuclein fibrils derived from serum and CSF by IP/RT-QuIC and RT-QuIC, respectively. (a) PD (case 2) and (b) MSA (case 2). The arrows indicate the measurement sites of the width. Scale bars are 100 nm. The widths of the amplified α-synuclein fibrils are shown for all (c) PD (n = 6: case 1, p = 0.5590; case 2, p = 0.7981; case 3, p = 0.7238; case 4, p = 0.7915 ; case 5, p = 0.3705; case 6, p = 0.6793) and (d) MSA cases (n = 3: case 1, p = 0.5801; case 2, p = 0.6237). The data represent mean ± SEM. Statistical analysis was conducted using a two-tailed t-test. We measured the width of 10 fibrils at two sites for each fibril. CSF, cerebrospinal fluid; MSA, multiple system atrophy; NS, not significant; PD, Parkinson’s disease.
Extended Data Fig. 3
Extended Data Fig. 3. α-synuclein seeds derived from the serum of PD and MSA cases induce different propagation processes of phosphorylated α-synuclein in the injected mouse brain.
α-synuclein seeds derived from the serum of PD and MSA cases were injected into the mouse brain striatum. Phosphorylated α-synuclein pathology observed at (a) three months (n = 3), (b) six months (n = 3), and (c) 12 months (n = 3) after the injection. Immunostaining was conducted on each brain region (Str, CTX, and SN) using the anti-p-syn #64 antibody. Scale bars are 50 µm. The total area of the phosphorylated α-synuclein-positive inclusions was quantified chronologically for contralateral Str (d) (3months: PD vs. MSA-P, p = 0.0154; MSA-P vs. MSA-C, p = 0.0158; PD vs. MSA-C, p = 0.9997; 6 months: PD vs. MSA-P, p = 0.0007; MSA-P vs. MSA-C, p = 0.1087; PD vs. MSA-C, p = 0.0052, 1 year: PD vs. MSA-P, p = 0.0009; MSA-P vs. MSA-C, p = 0.9995; PD vs. MSA-C, p = 0.0009), contralateral CTX (e) (3months: PD vs. MSA-P, p = 0.0238; MSA-P vs. MSA-C, p = 0.0371; PD vs. MSA-C, p = 0.9259; 6 months: PD vs. MSA-P, p < 0.0001; MSA-P vs. MSA-C, p = 0.9940; PD vs. MSA-C, p < 0.0001, 1 year: PD vs. MSA-P, p = 0.0007; MSA-P vs. MSA-C, p = 0.0117; PD vs. MSA-C, p = 0.0405), and ipsilateral SN (f) (3months: PD vs. MSA-P, p < 0.0001; MSA-P vs. MSA-C, p = 0.7635; PD vs. MSA-C, p < 0.0001; 6 months: PD vs. MSA-P, p = 0.0001; MSA-P vs. MSA-C, p = 0.0383; PD vs. MSA-C, p = 0.0001, 1 year: PD vs. MSA-P, p < 0.0001; MSA-P vs. MSA-C, p = 0.0078; PD vs. MSA-C, p = 0.0002). Horizontal axis: time after α-synuclein seed injection; vertical axis: total area of phosphorylated α-synuclein-positive inclusions (μm2) per unit area (mm2). Data are represented as mean area per region ± SEM (n = 5 mice per group). Statistical analysis was conducted using two-sided one-way analysis of variance with post hoc Bonferroni test, resulting in significances of p < 0.0001 (****), p < 0.001 (***), p < 0.01 (**), and p < 0.05 (*) among each group. CTX, cortex; MSA, multiple system atrophy; MSA-C, MSA cerebellar variant; MSA-P, MSA Parkinsonian variant; PD, Parkinson’s disease; SN, substantia nigra; Str, striatum.
Extended Data Fig. 4
Extended Data Fig. 4. MSA-seeds induce oligodendrocyte degeneration compared with PD-seeds in the injected mouse brains.
α-synuclein seeds derived from the serum of PD or MSA cases were injected into the mouse striatum. The total area of the NeuN-positive neurons was quantified chronologically for (a) Str (n = 3: PD, p = 0.2282; MSA-P, p = 0.1409; MSA-C, p = 0.2306), (b) CTX (n = 3: PD, p = 0.411; MSA-P, p = 0.1465; MSA-C, p = 0.1953), and (c) SN (n = 3: PD, p < 0.0001; MSA-P, p < 0.0001; MSA-C, p < 0.0001). The total area of the Gst-pi-positive oligodendrocytes was quantified chronologically for (d) CTX (n = 3: PD, p = 0.053; MSA-P, p = 0.017; MSA-C, p = 0.003). Horizontal axis: time after α-synuclein seed injection; vertical axis: total area of NeuN-positive neurons or GST-pi-positive oligodendrocytes (μm2) per unit area (mm2). Data are represented as mean area per region ± SEM, n = 5 mice per group. Statistical analysis was conducted using two-sided one-way analysis of variance, resulting in significances of p < 0.0001 (****), p < 0.01 (**) and p < 0.05 (*) among each group. CTX, cortex; MSA, multiple system atrophy; MSA-C, MSA cerebellar variant; MSA-P, MSA Parkinsonian variant; NS, not significant; PD, Parkinson’s disease; SN, substantia nigra; Str, striatum.

Comment in

References

    1. Rossi, M. et al. Ultrasensitive RT-QuIC assay with high sensitivity and specificity for Lewy body-associated synucleinopathies. Acta Neuropathol.140, 49–62 (2020). - PMC - PubMed
    1. Shahnawaz, M. et al. Discriminating α-synuclein strains in Parkinson’s disease and multiple system atrophy. Nature578, 273–277 (2020). - PMC - PubMed
    1. Spillantini, M. G. et al. α-Synuclein in Lewy bodies. Nature388, 839–840 (1997). - PubMed
    1. Wong, Y. C. & Krainc, D. α-synuclein toxicity in neurodegeneration: mechanism and therapeutic strategies. Nat. Med.23, 1–13 (2017). - PMC - PubMed
    1. Iranzo, A. et al. Detection of α-synuclein in CSF by RT-QuIC in patients with isolated rapid-eye-movement sleep behaviour disorder: a longitudinal observational study. Lancet Neurol.20, 203–212 (2021). - PubMed