. 2023 Jul;3(7):894-907.
doi: 10.1038/s43587-023-00424-y. Epub 2023 May 29.

Human microglia show unique transcriptional changes in Alzheimer's disease

Affiliations

Human microglia show unique transcriptional changes in Alzheimer's disease

Katherine E Prater et al. Nat Aging. 2023 Jul.

Abstract

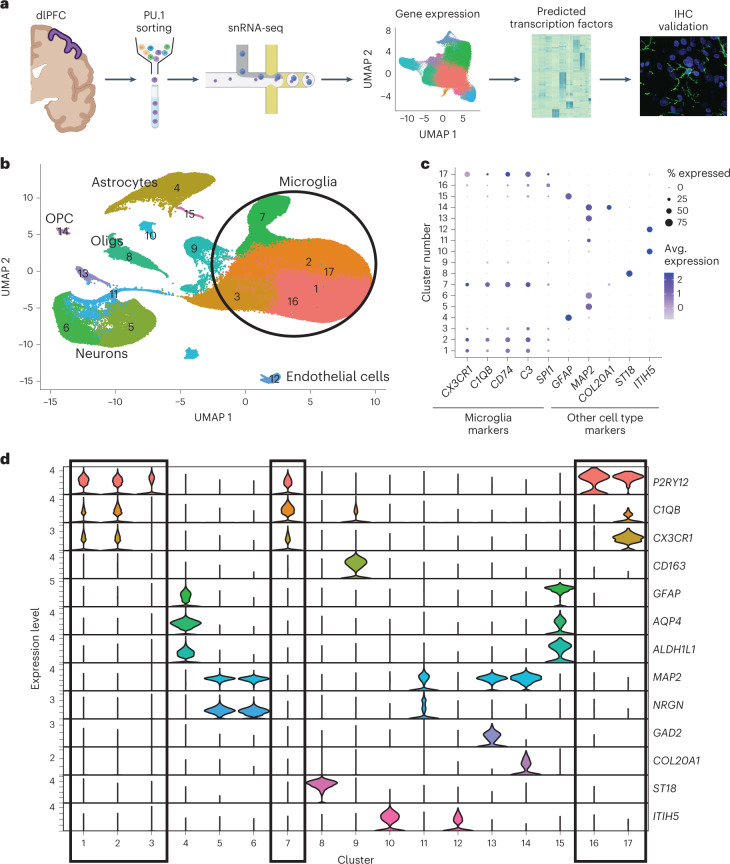
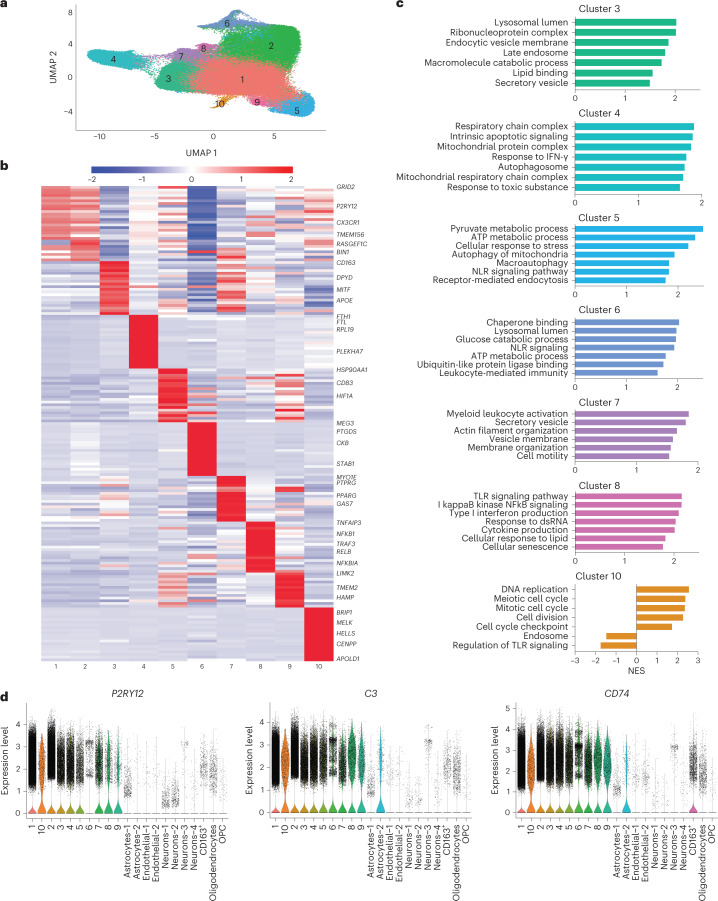
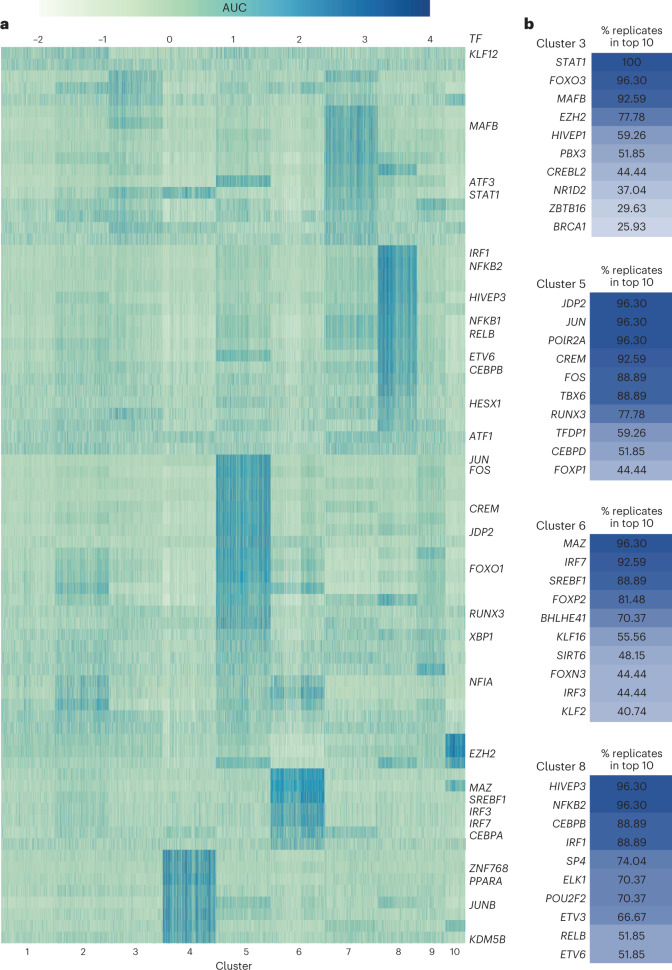
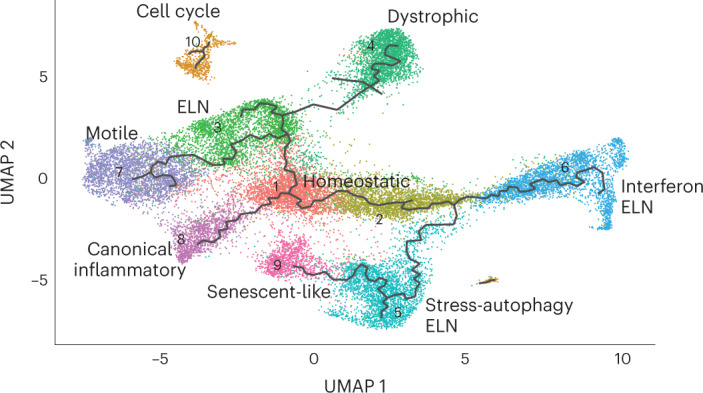
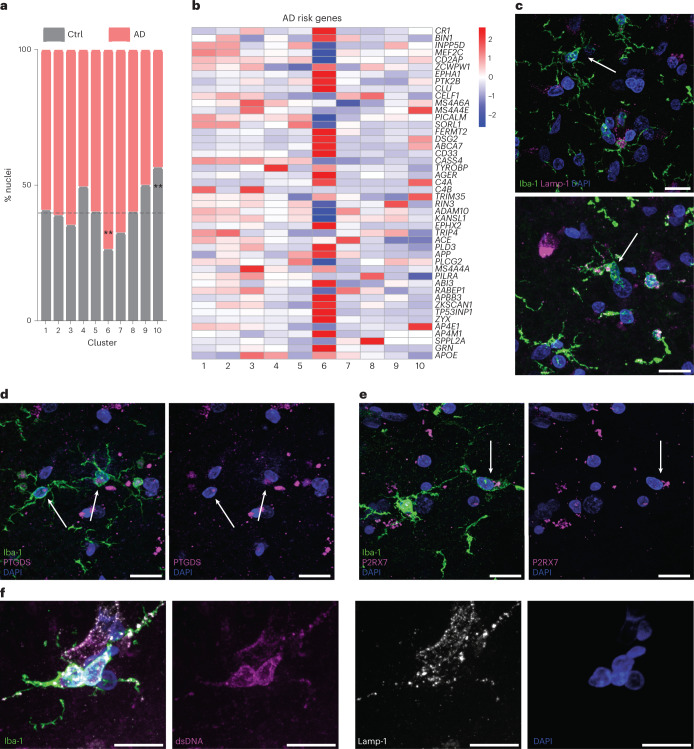
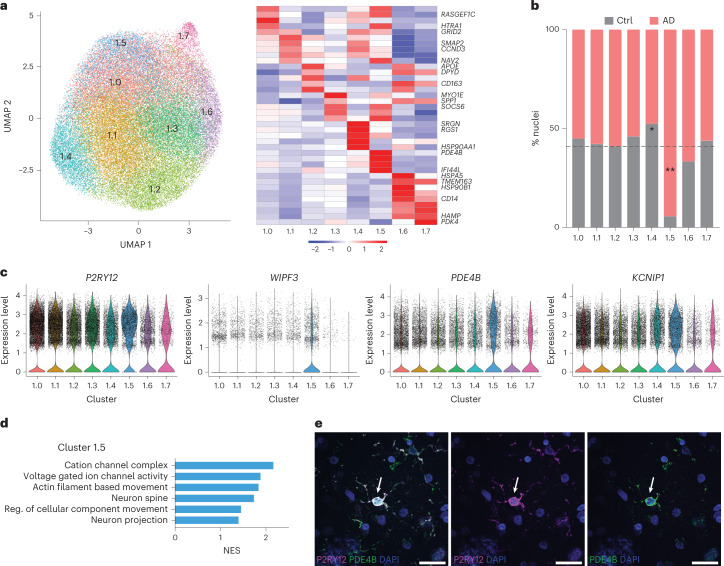
Microglia, the innate immune cells of the brain, influence Alzheimer's disease (AD) progression and are potential therapeutic targets. However, microglia exhibit diverse functions, the regulation of which is not fully understood, complicating therapeutics development. To better define the transcriptomic phenotypes and gene regulatory networks associated with AD, we enriched for microglia nuclei from 12 AD and 10 control human dorsolateral prefrontal cortices (7 males and 15 females, all aged >60 years) before single-nucleus RNA sequencing. Here we describe both established and previously unrecognized microglial molecular phenotypes, the inferred gene networks driving observed transcriptomic change, and apply trajectory analysis to reveal the putative relationships between microglial phenotypes. We identify microglial phenotypes more prevalent in AD cases compared with controls. Further, we describe the heterogeneity in microglia subclusters expressing homeostatic markers. Our study demonstrates that deep profiling of microglia in human AD brain can provide insight into microglial transcriptional changes associated with AD.


Conflict of interest statement

The authors declare no competing interests.

Figures

Fig. 1
Fig. 1. PU.1 enrichment yields a large dataset of microglia nuclei.
a, Experimental design of 22 postmortem human dorsolateral prefrontal cortices (created in part with BioRender). b, UMAP of the PU.1 sorted nuclei from the 22-subject dataset demonstrates that, although other cell types, including neurons, astrocytes, oligodendrocytes (Oligs) and their progenitors (OPCs) as well as endothelial cells, are present, six clusters, including the three largest, are composed of microglia nuclei. c, Representative cell type marker genes (x axis) with the percent of nuclei that express a gene (size of dot) in each cluster (distributed along the y axis) and the average expression level (color intensity) are shown for microglia (CX3CR1, C1QB, CD74 and C3), astrocytes (GFAP), neurons (MAP2), OPCs (COL20A1), Oligs (ST18) and endothelial cells (ITIH5) for each cluster. d, Gene expression of a wider set of cell type marker genes demonstrates that clusters 1, 2, 3, 7, 16 and 17 are composed of microglia. IHC, immunohistochemistry.
Fig. 2
Fig. 2. Microglia states have diverse gene expression and biological pathway correlates.
a, UMAP of unbiased clustering on the nuclei from the six PU.1 sorted clusters (1, 2, 3, 7, 16 and 17, shown in Fig. 1d) meeting criteria for microglia from the 22-sample dataset contains 10 microglia clusters. b, Differential expression analysis comparing each cluster to all other clusters demonstrates distinct gene expression profiles for each. The top 25 genes from each cluster are displayed with gene names annotated on the right. Cluster 1 is high in expression of canonical microglia genes (CX3CR1 and P2RY12). c, GSEA analysis of genes that differentiate each cluster from cluster 1 (‘homeostatic marker’) suggests distinct biological pathways. d, Canonical microglia marker gene expression in the microglia dataset versus other cell types sorted during PU.1 enrichment demonstrates enrichment of microglia marker gene expression in the 10 clusters. NES, normalized enrichment score.
Fig. 3
Fig. 3. Transcription factor regulatory networks are specific to microglia phenotypes.
a, SCENIC workflow identified transcription factor regulated networks associated with different phenotypic clusters of microglia. Heat map of area under the curve (AUC) of the transcription factor (regulon activity in clusters). b, Percentage of instances where transcription factor regulons occured in the top 10 regulon specificity scores per cluster (out of 27 permutations). Darker color indicates higher percentage of replication.
Fig. 4
Fig. 4. Microglia transcriptomic progression may take multiple paths.
Monocle trajectory inference applied to the microglia dataset demonstrates that multiple phenotypic options radiate outward from cluster 1. Each branch has several potential endpoints, suggesting that microglia may not progress along a single staged linear trajectory but, instead, proceed through one of several transition states to reach various transcriptomic end phenotypes.
Fig. 5
Fig. 5. Cluster 6 demonstrates enrichment of AD risk genes and suggests the presence of dysregulated lysosomal and cytosolic DNA regulation in microglia in AD.
a, Cluster 6 is significantly increased in AD brain (chi-square FDR-corrected P = 0.0064), whereas cluster 10 is increased in control (Ctrl) samples (chi-square FDR-corrected P = 0.0006). b, Heat map of AD-associated risk gene expression across microglia clusters shows stronger differential expression in cluster 6. c, Demonstration of lysosome morphology heterogeneity in microglia. Representative images from an AD case demonstrate microglia (Iba-1, green) with heterogeneity in morphology and Lamp-1 signal. Examples are of a ramified (top arrow) and greater lysosome (Lamp-1, magenta) signal and an ‘activated’ or less-ramified phenotype (bottom arrow). d, Representative microglia (Iba-1, green) with high PTGDS (red) expression, a cluster 6 marker in an AD case. e, Representative microglia (Iba-1, green) with high expression of P2RX7 (magenta) expression, a cluster 6 marker in an AD case. f, A representative example of activated microglia with both large numbers of lysosomes (Lamp-1, white) and cytosolic dsDNA (magenta) in an AD case. All representative images in cf display staining replicated in multiple fields and at least three human brains. All scale bars represent 15 µm. **Corrected P < 0.01.
Fig. 6
Fig. 6. Within microglia expressing homeostatic markers there is a subcluster uniquely enriched in AD brain samples.
a, Subclustering of cluster 1 homeostatic marker microglia (HM) revealed seven subpopulations defined by differential gene expression. b, Subcluster 1.5 is greatly expanded in AD brain samples (chi-square FDR-corrected P = 6.2936 × 10−13), whereas subcluster 1.4 is increased in control (Ctrl) brain samples (chi-square FDR-corrected P = 0.0194). c, Gene expression of P2RY12 demonstrates high expression across the HM subclusters, with highest expression in subcluster 1.5. Genes differentially expressed in subcluster 1.5, such as WIPF3, PDE4B and KCNIP, also demonstrate high expression. d, Pathway enrichment in subcluster 1.5 demonstrates unique enrichment for motility, ion channel activity and neuron-related processes. e, Immunohistochemistry validates the presence of double-positive high P2RY12-expressing and PDE4B-expressing microglia in AD brain. Representative images display staining replicated in multiple fields and at least three human brains. Scale bars, 25 µm. *Corrected P < 0.05; **corrected P < 0.01. Reg., regulation.
Extended Data Fig. 1
Extended Data Fig. 1. PU.1 enrichment increases the number of microglia nuclei and enhances microglia cluster resolution in snRNAseq studies.
(A) Fluorescence-activated nuclei sorting plot of nuclei isolated from dorsolateral prefrontal cortex grey matter of postmortem human brain tissue demonstrate a DAPI-positive population from which later populations are drawn. (B) Isotype and PU.1 staining examples demonstrating the PU.1 positive population. (C) Unsorted snRNAseq data from four samples demonstrates multiple brain cell types and a small population of microglia (n = 1032 cells) that can be further subdivided into five clusters. (D) After PU.1 enrichment, a snRNAseq dataset from the same four individuals contains a larger number of microglia (n = 23,310 cells), and these microglia can be further discriminated into nine clusters.
Extended Data Fig. 2
Extended Data Fig. 2. Gene expression of microglia marker genes in the 10 identified microglia subclusters.
Microglia marker genes, CX3CR1, C1Qb, SPI1 (PU.1), and APOE all demonstrate higher expression in the 10 microglia subclusters (numbered 1–10 on the left) than in other cell type clusters (labeled by cell type on the right).
Extended Data Fig. 3
Extended Data Fig. 3. Gene expression of astrocyte and peripheral monocyte marker genes in the 10 identified microglia subclusters.
(A) Astrocyte marker genes GFAP and S100B demonstrate higher expression in the two Astrocytes-1 and Astrocytes-2 subclusters than in the 10 defined microglia subclusters. While microglia cluster 6 does have expression of GFAP, it does not have expression of S100B. (B) Peripheral monocyte markers CCL5 and have low expression in our dataset but are most highly expressed by the CD163+ cluster which was not included in our microglia dataset.
Extended Data Fig. 4
Extended Data Fig. 4. Gene Ontology Network Enrichment of the Endolysosomal Microglia Clusters 3, 5, and 6.
The genes differentially expressed in Clusters 3, 5, and 6 were employed to drive a network-based gene ontology enrichment using the Cytoscape application ClueGO. This approach uses a one-sided positive enrichment algorithm that employs hypergeometric testing, with a kappa-threshold of 0.4 to optimize the biological process connections. Each term drawn into the network was initially filtered for multiple testing corrections threshold of p < 0.05, and hierarchically weighted for terms with a Benjamini-Hochberg correction value of p < 0.01. The nodes are represented within each network based upon two factors: number of genes (size of circle) and statistical significance (bright red = Benjamini-Hochberg corrected p < 0.05; dark brown = Benjamini-Hochberg corrected p < 0.0005). (A) In Cluster 3, three small subclusters were identified associated with endocytosis, receptor mediated endocytosis, and lipid binding and synthesis (far left); a second subcluster centers on synaptic endocytosis (middle group); and a third involves vesicle transport (far right). (B) In Cluster 5, a subcluster of terms was identified spanning autophagy, receptor mediated autophagy, and the regulation of these two terms (far left); a second larger cluster identifies endocytosis and receptor-mediated endocytosis, processes linked with autophagic regulation, as well as vesicular transport. (C) In Cluster 6, three subnetworks were identified within the ELN space, demonstrating active endocytosis, lysosomal processes and transfer between these compartments and the trans-golgi network (left). A second large cluster of terms was identified associated with innate immune function, activation, and regulation, as well as linked inflammatory processes (right side).
Extended Data Fig. 5
Extended Data Fig. 5. APOE ε3/ε3 genotype does not substantially alter microglial clustering in human autopsy brain.
(A) UMAP of unbiased clustering on 13 samples of only APOE ε3/ε3 individuals shows 9 clusters. (B) Similar to the clusters identified in the Mixed APOE genotype dataset, the clusters identified in the APOE ε3/ε3 genotype dataset are distinct by gene expression. The top 5 genes are displayed for each cluster. (C) Venn diagrams demonstrating overlap between clusters from the Mixed APOE and APOE ε3/ε3 cohorts demonstrating significant overlap in gene expression profiles.
Extended Data Fig. 6
Extended Data Fig. 6. Top transcription factors for each cluster from the full cohort microglia subclusters are unique and represent biological function switches.
These are the transcription factors that most often drove gene expression in clusters 4, 7, 9, and 10. Values denote the percentage of replicates of permutations of the dataset where that transcription factor was unique to the given cluster, with darker color indicating higher percentages. Note that while a few similar transcription factors are seen in multiple clusters, particularly the most prevalent transcription factors are unique, and are representative of gene expression driving biological functions in these clusters.
Extended Data Fig. 7
Extended Data Fig. 7. Transcription factor regulatory networks are specific and unique to subpopulations of microglia within the APOE ε3/ε3 genotype clusters.
Similar to the larger dataset, transcription factors driving gene expression within clusters are distinct when the data is comprised of only APOE ε3/ε3 allele carriers.
Extended Data Fig. 8
Extended Data Fig. 8. Gene sets demonstrate differential expression by cluster based on predicted biological function.
Heatmaps of: (A) the Gene Ontology (GO) set of Endolysosomal genes demonstrate significant upregulation in Cluster 6. (B) The Kyoto Encyclopedia of Genes and Genomes (KEGG) set of Toll-Like Receptor (TLR) genes demonstrates significant upregulation in Cluster 8 as would be expected given the classical inflammatory phenotype observed in the gene expression. (C) The ‘Disease Associated Microglia’ (DAM) gene list from Keren-Shaul et al. 2017 shows upregulation of genes across multiple clusters in our human dataset. This replicates other human studies which have not identified a single DAM cluster unlike studies involving mouse models of Alzheimer’s disease.
Extended Data Fig. 9
Extended Data Fig. 9. A subset of microglia demonstrate dsDNA signal and greater Lamp-1 signal in AD brain.
(A) A representative example of staining observed in multiple fields across at least three humans shows an activated microglia with both large numbers of lysosomes (Lamp-1, white), and cytosolic dsDNA (magenta) in an AD case (filled arrowhead). (B) Microglia (pointed arrowhead) without cytosolic dsDNA immunoreactivity (magenta) in the same case and tissue section appear ramified with less Lamp-1 signal. All scale bars represent 15 microns.
Extended Data Fig. 10
Extended Data Fig. 10. The APOE ε3/ε3 genotype cohort also demonstrates a subcluster of the homeostatic-marker-expressing cluster increased in AD brain.
(A) The results from the full dataset were replicated in the pure APOE ε3/ε3 allele cohort, suggesting multiple subpopulations exist within the ‘homeostatic’ cluster. These subpopulations are distinct by gene expression despite being comprised of one ‘homeostatic’ subpopulation. (B) Within the APOE ε3/ε3 cohort ‘homeostatic’ Cluster 1, there is a Cluster 1.5 that is significantly increased in AD brain like we found in the full cohort (Fig. 6; Chi-squared FDR corrected p = 6.7673 × 10−6). **= p < 0.01.

Comment in

References

    1. Podlesny-Drabiniok A, Marcora E, Goate AM. Microglial phagocytosis: a disease-associated process emerging from Alzheimer’s disease genetics. Trends Neurosci. 2020;43:965–979. - PMC - PubMed
    1. Calsolaro V, Edison P. Neuroinflammation in Alzheimer’s disease: current evidence and future directions. Alzheimers Dement. 2016;12:719–732. - PubMed
    1. Colonna M, Butovsky O. Microglia function in the central nervous system during health and neurodegeneration. Annu. Rev. Immunol. 2017;35:441–468. - PMC - PubMed
    1. McQuade A, Blurton-Jones M. Microglia in Alzheimer’s disease: exploring how genetics and phenotype influence risk. J. Mol. Biol. 2019;431:1805–1817. - PMC - PubMed
    1. Milner MT, Maddugoda M, Gotz J, Burgener SS, Schroder K. The NLRP3 inflammasome triggers sterile neuroinflammation and Alzheimer’s disease. Curr. Opin. Immunol. 2021;68:116–124. - PubMed

Publication types