. 2023 Jun;26(6):997-1007.
doi: 10.1038/s41593-023-01345-0. Epub 2023 May 29.

Postsynaptic synucleins mediate endocannabinoid signaling

Affiliations

Postsynaptic synucleins mediate endocannabinoid signaling

Eddy Albarran et al. Nat Neurosci. 2023 Jun.

Abstract

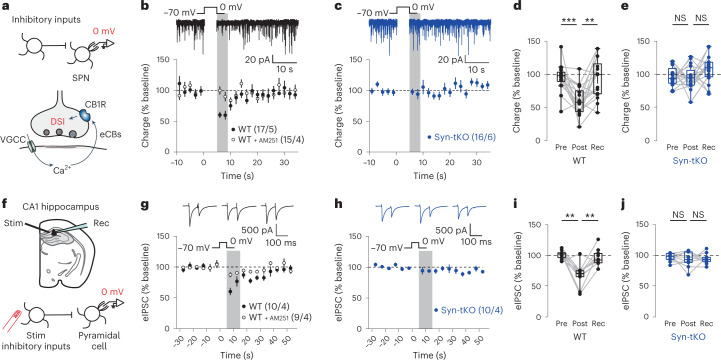
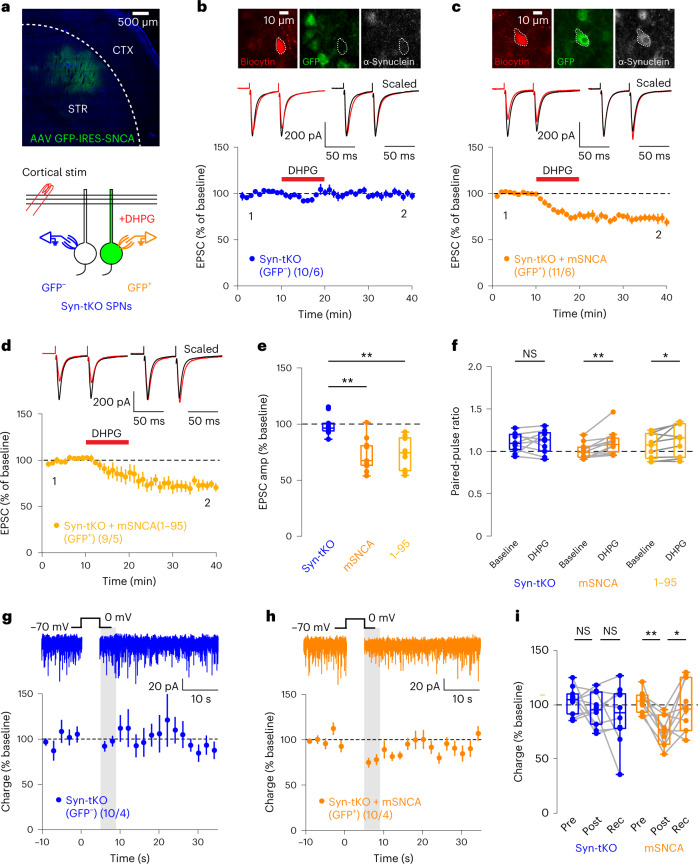
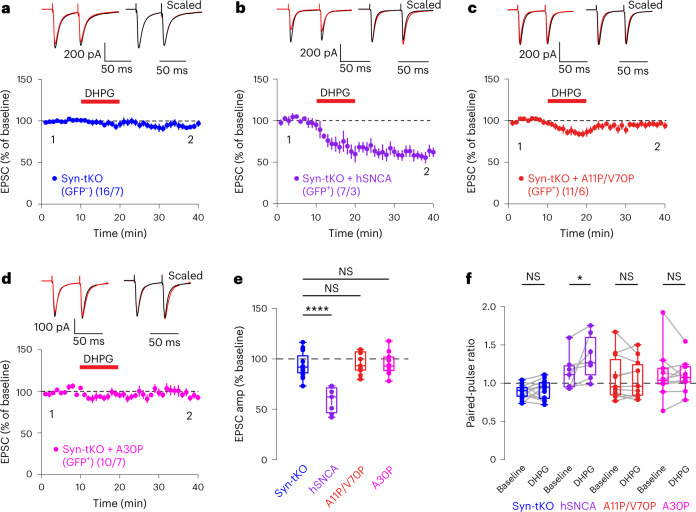
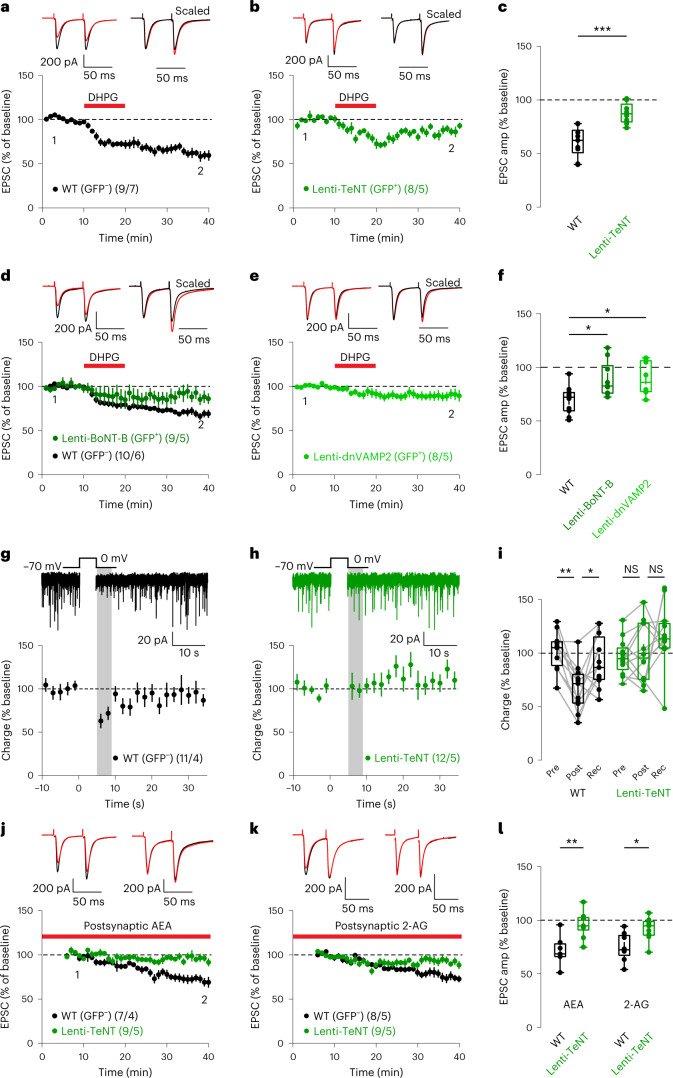
Endocannabinoids are among the most powerful modulators of synaptic transmission throughout the nervous system, and yet little is understood about the release of endocannabinoids from postsynaptic compartments. Here we report an unexpected finding that endocannabinoid release requires synucleins, key contributors to Parkinson's disease. We show that endocannabinoids are released postsynaptically by a synuclein-dependent and SNARE-dependent mechanism. Specifically, we found that synuclein deletion blocks endocannabinoid-dependent synaptic plasticity; this block is reversed by postsynaptic expression of wild-type but not of mutant α-synuclein. Whole-cell recordings and direct optical monitoring of endocannabinoid signaling suggest that the synuclein deletion specifically blocks endocannabinoid release. Given the presynaptic role of synucleins in regulating vesicle lifecycle, we hypothesize that endocannabinoids are released via a membrane interaction mechanism. Consistent with this hypothesis, postsynaptic expression of tetanus toxin light chain, which cleaves synaptobrevin SNAREs, also blocks endocannabinoid-dependent signaling. The unexpected finding that endocannabinoids are released via a synuclein-dependent mechanism is consistent with a general function of synucleins in membrane trafficking and adds a piece to the longstanding puzzle of how neurons release endocannabinoids to induce synaptic plasticity.


Conflict of interest statement

The authors declare no competing interests.

Figures

Fig. 1
Fig. 1. eCB-dependent LTD is abolished in Syn-tKO mice.
a, Experimental configuration (bottom, one representative differential interference contrast (DIC) image of ~700 whole-cell recordings included in this study). b, Top, representative traces of evoked corticostriatal EPSCs across a range of stimulation intensities. Bottom, input–output curves in WT and Syn-tKO mice (WT: n = 12 cells, 6 mice; Syn-tKO: n = 13 cells, 6 mice; P = 0.888). c, Representative traces of responses to repeated stimulation across a range of stimulation frequencies. d,e, No difference in use-dependent synaptic properties in Syn-tKO mice, as measured by short-term depression dynamics (d; WT: n = 14 cells, 4 mice; Syn-tKO: n = 11 cells, 3 mice; 5 Hz: P = 0.304; 50 Hz: P = 0.651; 100 Hz: P = 0.691) and steady-state amplitudes (e; P = 0.756) in response to repeated stimulation across a range of frequencies. f, Schematic of eCB-LTD experiments. Top, whole-cell recordings from SPNs during induction of eCB-LTD; bottom, eCB-LTD induction with DHPG (50 µM) and depolarization (−50 mV). gj, DHPG-induced eCB-LTD in WT mice is fully blocked by the CB1R antagonist AM251 (10 µM) (WT: n = 11 cells, 4 mice, 69.95 ± 1.70%; WT + AM251: n = 8 cells, 5 mice, 96.89 ± 3.42%; P = 6.375 × 10−4); top, representative traces. h, eCB-LTD is abolished in Syn-tKO mice (Syn-tKO: n = 11 cells, 4 mice, 97.76 ± 3.49%; P = 2.106 × 10−4); top, representative trace. i, Summary of EPSC amplitudes. j, Summary of PPRs (WT baseline: 1.18 ± 0.04; post-DHPG: 1.39 ± 0.06; P = 0.001; Syn-tKO baseline: 1.17 ± 0.05; post-DHPG: 1.19 ± 0.05; P = 0.831; WT + AM251 baseline: 1.26 ± 0.06; post-DHPG: 1.27 ± 0.06; P = 0.641). Data are mean ± s.e.m. i,j, Box plots are depicted as mean (center), first/third quartiles (lower/upper box limits) and minima/maxima (bottom/top whiskers). Statistical significance was assessed by two-sided tests, including two-way repeated-measures ANOVA with multiple comparisons (b,d,e), ANOVA with multiple comparisons (i) and Wilcoxon signed tests (j) (***P < 0.001; **P < 0.01; NS, not significant). Source data
Fig. 2
Fig. 2. DSI is abolished in Syn-tKO mice.
a, Schematic of DSI experiments. Top, whole-cell recordings from SPNs during induction of DSI; bottom, DSI induction pathway engaged with depolarization (depol) (0 mV). b, DSI in WT mice is blocked by AM251 (10 µM); top, representative WT recorded trace. c, DSI is abolished in Syn-tKO mice; top, representative Syn-tKO recorded trace. d, Summary of DSI for WT mice (n = 17 cells, 5 mice, pre-depol: 95.64 ± 5.01%, post-depol: 59.91 ± 5.28%, recovery: 93.51 ± 7.20%, P = 5 × 10−4, P = 1.6 × 10−3). e, Summary of DSI for Syn-tKO mice (n = 16 cells, 6 mice, pre-depol: 97.25 ± 3.66%, post-depol: 95.70 ± 4.54%, recovery: 107.59 ± 5.20%, P = 0.959, P = 0.148). f, Schematic of DSI experiments in CA1 of the hippocampal pyramidal neurons. g,i, Summary of DSI in WT mice (n = 10 cells, 4 mice; pre-depol: 101.50 ± 2.18%; post-depol: 68.26 ± 5.85%; recovery: 96.77 ± 4.36%; P = 3.9 × 10−3, P = 3.9 × 10−3). h,j, Summary of DSI in Syn-tKO (n = 10 cells, 4 mice; pre-depol: 97.24 ± 2.08%; post-depol: 93.70 ± 3.94%; recovery: 94.73 ± 2.72%; P = 0.625, P = 0.846). Data are mean ± s.e.m. d,e,i,j, Box plots are depicted as mean (center), first/third quartiles (lower/upper box limits) and minima/maxima (bottom/top whiskers). Statistical significance was assessed by two-sided tests, including Wilcoxon signed tests (d,e,i,j) (***P < 0.001; **P < 0.01; NS, not significant). Rec, recovery. Source data
Fig. 3
Fig. 3. eCB release is impaired in Syn-tKO mice.
a, Schematic of WIN-LTD experiments. bd, Normal WIN-LTD in WT and Syn-tKO mice (WT: n = 9/7, 39.91 ± 3.18%; Syn-tKO: n = 8/3, 42.46 ± 4.36%; P = 0.673). e, PPRs in WT mice (baseline: 1.09 ± 0.07; post-WIN: 1.36 ± 0.12; P = 3.9 × 10−3) and Syn-tKO mice (baseline: 0.99 ± 0.04; post-WIN: 1.33 ± 0.07; P = 7.8 × 10−3). f, Schematic of eCB-loading experiments. gj, eCB-loading causes LTD in WT cells, blocked by AM251 (AEA WT: n = 9/3, 72.40 ± 3.10%; AEA WT + AM251: n = 7/5, 99.13 ± 2.63%; P = 1.08 × 10−5; 2-AG WT: n = 8/5, 74.92 ± 4.66%). h, eCB loading fails to induce LTD in Syn-tKO cells (AEA Syn-tKO: n = 9/3, 98.16 ± 3.05; P = 7.08 × 10−6; 2-AG Syn-tKO: n = 7/4, 101.22 ± 2.46%; P = 6.21 × 10−4). eCB loading increases PPRs in WT cells (AEA baseline: 1.02 ± 0.04; end: 1.19 ± 0.05; P = 3.9 × 10−3; 2-AG baseline: 1.26 ± 0.08; end: 1.38 ± 0.09; P = 7.8 × 10−3), not Syn-tKO cells (AEA baseline: 1.00 ± 0.04; end: 1.00 ± 0.05; P = 0.82; 2-AG baseline: 1.44 ± 0.07; end: 1.45 ± 0.06; P = 0.81). k, Top, GRABeCB2.0 activation; bottom, representative image (1/32) of a GRABeCB2.0-expressing slice. l, Stimulation increases GRABeCB2.0 signal in WT condition; top, representative images. mo, Stimulation-evoked GRABeCB2.0 transients in Syn-tKO slices are reduced (WT: n = 16/5, 0.31 ± 0.07 ΔF/F0; Syn-tKO: n = 16/4, 0.05 ± 0.02 ΔF/F0; P = 8.52 × 10−4). l,m,o, No differences between WT and Syn-tKO slices with AEA (WT: 0.61 ± 0.09 ΔF/F0; Syn-tKO: 0.37 ± 0.07 ΔF/F0; P = 0.073) or AM251 (WT: −0.05 ± 0.04 ΔF/F0; Syn-tKO: 0.02 ± 0.03 ΔF/F0; P = 0.086). Data are mean ± s.e.m. n = cells or slices per mouse. d,e,i,j,n,o, Box plots are depicted as mean, first/third quartiles and minima/maxima. Significance was assessed by two-sided tests: Mann–Whitney tests (d,j,n,o), Wilcoxon signed tests (e) and ANOVA with multiple comparisons (i) (****P < 0.0001; ***P < 0.001; **P < 0.01; NS, not significant). Source data
Fig. 4
Fig. 4. Postsynaptic α-Syn rescues eCB plasticity in Syn-tKO mice by a cell-autonomous mechanism.
a, Experimental approach. Top, AAV-mediated expression of α-Syn and GFP in dorsolateral striatum of Syn-tKO mice; bottom, Syn-tKO (GFP) and α-Syn-expressing SPNs (GFP+) targeted for recordings. b,c, Top, Post hoc verification of α-Syn expression. bf, Postsynaptic expression of full-length α-Syn in Syn-tKO cells is sufficient to rescue eCB-LTD (GFP, pooled: n = 10 cells, 6 mice, 99. 04 ± 2.89%; GFP+, mSNCA: n = 11 cells, 6 mice, 72.71 ± 4.32%; P = 2.09 × 10−4). d, Postsynaptic expression of a C-terminus-truncated α-Syn (1–95) still rescued eCB-LTD in Syn-tKO mice (GFP+, 1–95: n = 9 cells, 5 mice, 73.47 ± 4.84%; P = 5.41 × 10−4). e, Summary of EPSC amplitudes. f, Summary of PPRs in full-length α-Syn-expressing cells (GFP+, mSNCA; baseline: 1.01 ± 0.03; post-DHPG: 1.11 ± 0.04; P = 2.0 × 10−3), C-terminus-truncated α-Syn-expressing cells (GFP+, 1–95; baseline: 1.07 ± 0.05; post-DHPG: 1.14 ± 0.06; P = 0.039) and GFP cells (GFP, pooled; baseline: 1.08 ± 0.03; post-DHPG: 1.09 ± 0.04; P = 1.0). gi, Postsynaptic expression of full-length α-Syn rescues DSI in Syn-tKO SPNs (GFP cells: n = 10 cells, 4 mice, pre-depol: 103.58 ± 4.01%, post-depol: 95.81 ± 4.88%, recovery: 90.66 ± 8.44%, P = 0.695, P = 0.770; GFP+ cells: n = 10 cells, 4 mice, pre-depol: 102.73 ± 3.19%, post-depol: 76.21 ± 4.29%, recovery: 98.32 ± 7.27%, P = 3.9 × 10−3, P = 0.027). i, Summary of DSI. Data are mean ± s.e.m. e,f,i, Box plots are depicted as mean (center), first/third quartiles (lower/upper box limits) and minima/maxima (bottom/top whiskers). Statistical significance was assessed by two-sided tests, including Wilcoxon signed tests (f,i) and ANOVA with multiple comparisons (e) (**P < 0.01; *P < 0.05; NS, not significant). depol, depolarization. Rec, recovery. Source data
Fig. 5
Fig. 5. α-Syn membrane interaction domain is required for eCB-LTD.
af, eCB-LTD is absent in GFP SPNs (a), rescued by full-length human α-Syn (b) but not rescued by the expression of mutant A11P/V70P α-Syn (c) or by α-Syn harboring the PD mutation A30P (d) (GFP, pooled: n = 16 cells, 7 mice, 93.84 ± 3.06%; GFP+, hSNCA: n = 7 cells, 3 mice, 59.08 ± 4.90%, P = 4.98 × 10−7; A11P/V70P: n = 11 cells, 6 mice, 95.40 ± 3.17%; P = 0.986; A30P: n = 10 cells, 7 mice, 95.75 ± 3.59%; P = 0.977). e, Summary of EPSC amplitudes. f, Summary of PPRs for Syn-tKO cells infected with α-Syn (GFP+, hSNCA baseline: 1.14 ± 0.09; post-DHPG: 1.35 ± 0.11; P = 0.016; GFP, pooled baseline: 0.89 ± 0.02; post-DHPG: 0.92 ± 0.03; P = 0.255; A11P/V70P baseline: 1.07 ± 0.09; post-DHPG: 1.05 ± 0.08; P = 0.496; A30P baseline: 1.12 ± 0.11; post-DHPG: 1.10 ± 0.07; P = 0.695). Data are mean ± s.e.m. e,f, Box plots are depicted as mean (center), first/third quartiles (lower/upper box limits) and minima/maxima (bottom/top whiskers). Statistical significance was assessed by two-sided tests, including ANOVA with multiple comparisons (e) and Wilcoxon signed test (f) (****P < 0.0001; *P < 0.05; NS, not significant). Source data
Fig. 6
Fig. 6. Postsynaptic SNARE function is required for eCB plasticity and eCB release.
ac, Postsynaptic lentiviral expression of TeNT impairs eCB-LTD expression (GFP: n = 9 cells, 7 mice, 60.47 ± 4.73; GFP+: n = 8 cells, 5 mice, 87.54 ± 3.51%; P = 9.87 × 10−4). df, Postsynaptic lentiviral expression of BoNT-B (d) or dnVAMP2 (e) impairs eCB-LTD (GFP: n = 10 cells, 6 mice, 69.38 ± 4.17%; BoNT-B GFP+: n = 9 cells, 5 mice, 89.14 ± 5.52%; P = 0.024; dnVAMP2 GFP+: n = 8 cells, 5 mice, 89.67 ± 5.58%; P = 0.024). f, Summary of EPSC amplitudes. gi, Postsynaptic TeNT impairs striatal DSI (GFP: n = 11 cells, 4 mice, pre-depol: 101.93 ± 5.38%, post-depol: 67.33 ± 6.50%, recovery: 91.48 ± 7.40%, P = 9.77 × 10−4, P = 0.032; GFP+: n = 12 cells, 5 mice, pre-depol: 97.40 ± 4.24%, post-depol: 99.58 ± 7.00%, recovery: 111.00 ± 6.81%, P = 0.569, P = 0.339). jl, Postsynaptic TeNT prevents LTD induced by AEA loading or 2-AG loading (AEA GFP: n = 7 cells, 4 mice, 71.57 ± 5.20%; AEA GFP+: n = 9 cells, 5 mice, 96.06 ± 4.05%, P = 5.2 × 10−3; 2-AG GFP data from Fig. 2g: n = 8 cells, 5 mice, 74.92 ± 4.66%; 2-AG GFP+: n = 9 cells, 5 mice, 92.01 ± 3.57%; P = 0.015). l, Summary of EPSC amplitudes. Data are mean ± s.e.m. c,f,i,l, Box plots are depicted as mean (center), first/third quartiles (lower/upper box limits) and minima/maxima (bottom/top whiskers). Statistical significance was assessed by two-sided tests, including Mann–Whitney tests (c,l) and Wilcoxon signed tests (f) (***P < 0.001; **P < 0.01; *P < 0.05; NS, not significant). depol, depolarization; Rec, recovery. Source data
Extended Data Fig. 1
Extended Data Fig. 1. The triple α/β/γ-synuclein KO has no effect on basal corticostriatal synaptic transmission, but blocks eCB-LTD in aged Syn-tKO mice.
a, Representative traces of evoked corticostriatal EPSCs in WT and Syn-tKO SPNs from aged mice (16–18 months old) across a range of stimulation intensities. b, Input-output curves in WT and Syn-tKO mice (WT: n = 14 cells / 6 mice; Syn-tKO: n = 12 cells / 5 mice; p = 0.960). c-f, DHPG-mediated eCB-LTD in aged (16–18 months old) WT mice is fully blocked by the CB1R antagonist AM251 (10 µM) (WT: n = 9 cells / 4 mice, 73.88 ± 2.74%; WT + AM251: n = 7 cells / 4 mice, 97.06 ± 3.20%; p = 3.026e-5); top, representative traces. d, eCB-LTD is abolished in aged Syn-tKO mice (Syn-tKO: n = 9 cells / 6 mice, 92.57 ± 2.57%; p = 1.955e-4); top, representative trace. e, Summary of EPSC amplitudes. f, Summary of PPRs (WT baseline: 1.02 ± 0.04; post-DHPG: 1.15 ± 0.06; p = 3.9e-3; Syn-tKO baseline: 0.95 ± 0.03; post-DHPG: 0.99 ± 0.03; p = 0.301). Data are mean ± SEM. (e, f) Box plots are depicted as mean (center), first/third quartile (lower/upper box limits), and minima/maxima (bottom/top whiskers). Statistical significance was assessed by two-sided tests, including 2-way repeated measures ANOVA (b), ANOVA with multiple comparisons (e), and Wilcoxon signed tests (f) (**** p < 0.0001; *** p < 0.001; ** p < 0.01; n.s. non-significant). Source data
Extended Data Fig. 2
Extended Data Fig. 2. DHPG-LTD is not abolished in α-Syn-KO and βγ-Syn-KO mice.
a-d, eCB-LTD in α-Syn-KO (WT data from Fig. 1: n = 11 cells / 4 mice, 69.95 ± 1.70%; α-Syn-KO: n = 10 cells / 4 mice, 83.44 ± 4.67%; p = 0.162). b, eCB-LTD in βγ-Syn-KO mice (n = 11 cells / 5 mice, 71.00 ± 3.38%; p = 0.957). c, Summary of EPSC amplitudes. d, Summary of PPRs in α-Syn-KO (baseline: 1.03 ± 0.05; post-DHPG: 1.10 ± 0.06; p = 0.037) and βγ-Syn-KO mice (baseline: 0.98 ± 0.06; post-DHPG: 1.05 ± 0.05; p = 9.8e-3). Data are mean ± SEM. (c, d) Box plots are depicted as mean (center), first/third quartile (lower/upper box limits), and minima/maxima (bottom/top whiskers). Statistical significance was assessed by two-sided tests, including ANOVA with multiple comparisons (c), and Wilcoxon signed tests (d) (**** p < 0.0001; ** p < 0.01; * p < 0.05; n.s. non-significant). Source data
Extended Data Fig. 3
Extended Data Fig. 3. DSI is abolished in dorsal striatum SPNs and hippocampal CA1 pyramidal neurons of Syn-tKO mice.
a, Schematic of evoked DSI experiments in the dorsal striatum. b-e, DSI (evoked-IPSCs) in dorsal striatum SPNs of WT mice (n = 16/5; pre-depol: 100.94 ± 2.09%; post-depol: 76.95 ± 3.64%; recovery: 94.43 ± 2.16%; p = 4.378e-4, p = 7.764e-4). DSI is blocked by AM251 (10 µM) (n = 15/5; pre-depol: 101.15 ± 1.99%; post-depol: 92.13 ± 3.14%; recovery: 99.97 ± 3.50%; p = 0.055, p = 0.277). c, Striatal DSI in Syn-tKO mice (n = 16/5; pre-depol: 102.19 ± 1.29%; post-depol: 95.25 ± 3.54%; recovery: 101.64 ± 2.53%; p = 0.134, p = 0.134). d, Summary of IPSC amplitudes. e, Summary of PPRs during striatal DSI (WT pre-depol: 0.85 ± 0.06; post-depol: 1.08 ± 0.10; recovery: 0.92 ± 0.07; p = 2.3e-3, p = 0.030; WT + AM251 pre-depol: 1.04 ± 0.06; post-depol: 1.04 ± 0.06; recovery: 1.01 ± 0.06; p = 0.847, p = 0.600; Syn-tKO pre-depol: 0.83 ± 0.04; post-depol: 0.82 ± 0.05; recovery: 0.89 ± 0.06; p = 0.959, p = 0.134). f, Schematic of DSI experiments in CA1 neurons. g, Summary of DSI with AM251 (n = 9/4; pre-depol: 101.17 ± 2.82%; post-depol: 89.22 ± 2.67%; recovery: 100.26 ± 4.74%; p = 0.055, p = 0.098). h, Summary of PPRs during hippocampal DSI (WT n = 10/4; pre-depol: 0.69 ± 0.06; post-depol: 0.84 ± 0.05; recovery: 0.69 ± 0.05; p = 0.037, p = 5.9e-3; WT + AM251 n = 9/4; pre-depol: 0.77 ± 0.05; post-depol: 0.70 ± 0.04; recovery: 0.78 ± 0.09; p = 0.098, p = 0.570; Syn-tKO n = 10/4; pre-depol: 0.75 ± 0.06; post-depol: 0.77 ± 0.06; recovery: 0.77 ± 0.05; p = 0.770, p = 1.000). Data are mean ± SEM. n = cells / mice. (d, e, g, h) Box plots are depicted as mean, first/third quartile, and minima/maxima. Statistical significance was assessed by two-sided Wilcoxon signed tests (d, e, g, h) (*** p < 0.001; ** p < 0.01; * p < 0.05; n.s. non-significant). Source data
Extended Data Fig. 4
Extended Data Fig. 4. Syn-tKO has no effect on presynaptic WIN-LTD in aged mice and does not change the total AEA or 2-AG levels in the brain.
a-d, WIN application results in indistinguishable corticostriatal LTD in aged (16–18 months) WT (a) and aged Syn-tKO mice (b) (WT: n = 9 cells / 6 mice, 48.11 ± 3.78%; Syn-tKO: n = 9 cells / 5 mice, 46.01 ± 3.56%; p = 0.605). c, Summary of EPSC amplitudes. d, Summary of PPRs in aged WT (baseline: 1.02 ± 0.03; post-WIN: 1.24 ± 0.04; p = 3.9e-3) and aged Syn-tKO mice (baseline: 0.90 ± 0.03; post-WIN: 1.16 ± 0.06; p = 3.9e-3). e, AEA levels detected in brain tissue of WT and Syn-tKO mice (WT: n = 4 mice, 211.08 ± 16.17 ng/mL; Syn-tKO: n = 5 mice, 194.40 ± 11.94 ng/mL; p = 0.286). f, 2-AG levels detected in brain tissue of WT and Syn-tKO (WT: 172.57 ± 13.55 ng/mL; Syn-tKO: 157.38 ± 9.34 ng/mL; p = 0.191). Data are mean ± SEM. (c, d, e, f) Box plots are depicted as mean (center), first/third quartile (lower/upper box limits), and minima/maxima (bottom/top whiskers). Statistical significance was assessed by two-sided tests, including Mann-Whitney (c, e, f) and Wilcoxon signed tests (d) (** p < 0.01; n.s. non-significant). Source data
Extended Data Fig. 5
Extended Data Fig. 5. α-Syn S129 phosphorylation site mutations do not disrupt rescue of DHPG-induced eCB-LTD.
a, eCB-LTD recorded in GFP- SPNs in Syn-tKO mice. b, c, eCB-LTD recorded from SPNs expressing α-Syn S129A (b) nor S129D (c) mutations. d,e, Summary of EPSC amplitudes. Postsynaptic expression of either S129 mutant α-Syn can rescue eCB-LTD (GFP-, pooled: n = 9 cells / 5 mice, 97.54 ± 2.28%; GFP+, S129A: n = 8 cells / 4 mice, 66.89 ± 5.24%; p = 1.03e-5; GFP+, S129D: n = 10 cells / 4 mice, 73.62 ± 2.89%, p = 1.39e-4). e, Summary of PPRs (S129A baseline: 0.91 ± 0.05; post-DHPG: 1.04 ± 0.06; p = 7.8e-3; S129D baseline: 0.98 ± 0.04; post-DHPG: 1.18 ± 0.06; p = 2.0e-3; GFP- (pooled) baseline: 1.08 ± 0.04; post-DHPG: 1.07 ± 0.04; p = 0.496). Data are mean ± SEM. (d, e) Box plots are depicted as mean (center), first/third quartile (lower/upper box limits), and minima/maxima (bottom/top whiskers). Statistical significance was assessed by two-sided tests, including ANOVA with multiple comparisons (d) and Wilcoxon signed tests (e) (*** p < 0.001; ** p < 0.01; n.s. non-significant). Source data
Extended Data Fig. 6
Extended Data Fig. 6. Sparse lentiviral expression of TeNT in striatal SPNs does not disrupt the basal functional properties of afferent synapses formed onto SPNs.
a, Representative image showing lentiviral expression of GFP-2A-TeNT in the striatum (1 of 8 slices). b, High magnification images. Top: DAPI, middle: GFP, bottom: overlay. c, Quantification of infection efficiency (GFP + / DAPI+): 10.28 ± 1.10% cells, n = 8 slices / 4 mice. d, Representative traces of evoked corticostriatal EPSCs in WT (GFP-) and TeNT-infected (GFP+) SPNs across a range of stimulation intensities. e, Input-output curves (GFP-: n = 12 cells / 5 mice; GFP+: n = 14 cells / 6 mice; p = 0.787). f, Representative traces of mEPSC recordings from WT (GFP-) and TeNT-expressing (GFP+) cells. g-j, Summary of mEPSC frequency (GFP-: n = 17 cells / 5 mice, 2.81 ± 0.22 Hz; GFP+: n = 18 cells / 5 mice, 2.64 ± 0.20 Hz; p = 0.680). h, Cumulative distribution of mEPSC inter-event intervals. i, Summary of mEPSC amplitude (GFP-: 16.78 ± 0.62 pA; GFP+: 16.65 ± 0.55 pA; p = 0.987). j, Cumulative distribution of mEPSC amplitudes. Data are mean ± SEM. (c, g, i) Box plots are depicted as mean (center), first/third quartile (lower/upper box limits), and minima/maxima (bottom/top whiskers). Statistical significance was assessed by two-sided tests, including 2-way repeated measures ANOVA (e) and Mann-Whitney tests (g, i) (n.s. non-significant). Source data
Extended Data Fig. 7
Extended Data Fig. 7. 2-photon Ca2+ imaging in SPN dendrites shows that lentiviral expression of TeNT does not alter SPN dendritic Ca2+ signaling.
a, Representative 2-photon image of a SPN (1 of 8 cells). b, Images of dendritic segments in red (Alexa594, 50 µM) and green (Fluo-5F, 300 µM) channels while cells were depolarized from -70 mV to 0 mV from WT (top) and TeNT-expressing (bottom) SPNs. c, Summary of depolarization-induced changes in dendritic Ca2+ (GFP-, n = 33 dendrites / 4 cells / 3 mice, -70 mV: 0.25 ± 0.11, 0 mV: 1.45 ± 0.53; p = 3.77e-9; GFP + / TeNT-expressing SPNs, n = 36 dendrites / 4 cells / 3 mice, -70 mV: 0.23 ± 0.14, 0 mV: 1.42 ± 0.30; p = 3.77e-9; GFP- vs. GFP+, p = 0.84). Data are mean ± SEM. (c) Box plots are depicted as mean (center), first/third quartile (lower/upper box limits), and minima/maxima (bottom/top whiskers). Statistical significance was assessed by two-sided ANOVA with multiple comparisons (c) (**** p < 0.0001; n.s. non-significant). Source data
Extended Data Fig. 8
Extended Data Fig. 8. Presynaptic CB1R function is not disrupted by lentiviral TeNT expression.
a, b, WIN-induced corticostriatal LTD in GFP- (a) and GFP + (TeNT-expressing) (b) SPNs. c, d, Summary of EPSC amplitudes (c) (GFP-: n = 6 cells / 4 mice, 50.36 ± 2.59%; GFP+: n = 6 cells / 4 mice, 46.73 ± 7.16%; p = 0.818) and of PPRs (d) in GFP- (baseline: 1.17 ± 0.05; post-WIN: 1.40 ± 0.10; p = 0.031) and GFP + SPNs (baseline: 1.25 ± 0.08; post-WIN: 1.56 ± 0.11; p = 0.031). Data are mean ± SEM. (c, d) Box plots are depicted as mean (center), first/third quartile (lower/upper box limits), and minima/maxima (bottom/top whiskers). Statistical significance was assessed by two-sided tests, including Mann-Whitney tests (c) and Wilcoxon signed tests (d) (* p < 0.05; n.s. non-significant). Source data
Extended Data Fig. 9
Extended Data Fig. 9. Acute loading of recombinant TeNT-LC through the patch pipette disrupts DSI in striatal SPNs.
a, Western blot image showing Synaptobrevin-2/VAMP2 cleavage in the presence of recombinant TeNT-LC protein dissolved in recording internal solution (conducted once before all recording experiments). b, Schematic of paired recordings. c, Top: representative paired recordings showing monosynaptic IPSCs in response to evoked presynaptic action potentials. Bottom: Overlay of time-aligned monosynaptic IPSCs across recorded cells. d, Summary of IPSC amplitudes recorded from postsynaptic SPNs. Acute presynaptic dialysis of TeNT (~20 mins) is sufficient to significantly reduce monosynaptic IPSC amplitudes (ctrl: n = 6 pairs / 4 mice, 697.62 ± 78.34 pA; TeNT: 5 pairs / 4 mice, 299.07 ± 109.81 pA; p = 0.017). e, f, Acute TeNT-loading in WT SPNs progressively disrupts striatal DSI (ctrl: 17 cells / 7 mice, 5 min: 69.94 ± 5.11%, 55 min: 73.35 ± 4.56%; ctrl 5 min vs. 55 min: p = 0.554; TeNT: 18 cells / 7 mice, 5 min: 69.00 ± 3.54%, 55 min: 96.37 ± 5.59%; TeNT 5 min vs. 55 min: p = 0.003; ctrl 55 min vs. TeNT 55 min: p = 0.008; ctrl vs. TeNT: p = 0.005). Top, representative DSI recordings. f, Summary of DSI at 5 min (left) and 55 min (right) after TeNT-loading. Data are mean ± SEM. (d, f) Box plots are depicted as mean (center), first/third quartile (lower/upper box limits), and minima/maxima (bottom/top whiskers). Statistical significance was assessed by two-sided tests, including Mann-Whitney tests (d), 2-way repeated measures ANOVA (E), and ANOVA with multiple comparisons (f) (** p < 0.01; * p < 0.05; n.s. non-significant). Source data

References

    1. Maroteaux L, Campanelli JT, Scheller RH. Synuclein: a neuron-specific protein localized to the nucleus and presynaptic nerve terminal. J. Neurosci. 1988;8:2804–2815. doi: 10.1523/JNEUROSCI.08-08-02804.1988. - DOI - PMC - PubMed
    1. Bendor JT, Logan TP, Edwards RH. The funciton of α-Synuclein. Neuron. 2013;79:1044–1066. doi: 10.1016/j.neuron.2013.09.004. - DOI - PMC - PubMed
    1. Sulzer D, Edwards RH. The physiological role of α-synuclein and its relationship to Parkinson’s disease. J. Neurochem. 2019;150:475–486. doi: 10.1111/jnc.14810. - DOI - PMC - PubMed
    1. Simón-Sánchez J, et al. Genome-wide association study reveals genetic risk underlying Parkinson’s disease. Nat. Genet. 2009;41:1308–1312. doi: 10.1038/ng.487. - DOI - PMC - PubMed
    1. Bussell R, Jr., Ramlall TF, Eliezer D. Helix periodicity, topology, and dynamics of membrane-associated α-Synuclein. Protein Sci. 2005;14:862–872. doi: 10.1110/ps.041255905. - DOI - PMC - PubMed

Publication types

MeSH terms

Substances