. 2023 Jun;4(6):893-907.
doi: 10.1038/s43018-023-00563-6. Epub 2023 May 29.

Limiting mitochondrial plasticity by targeting DRP1 induces metabolic reprogramming and reduces breast cancer brain metastases

Affiliations

Limiting mitochondrial plasticity by targeting DRP1 induces metabolic reprogramming and reduces breast cancer brain metastases

Pravat Kumar Parida et al. Nat Cancer. 2023 Jun.

Abstract

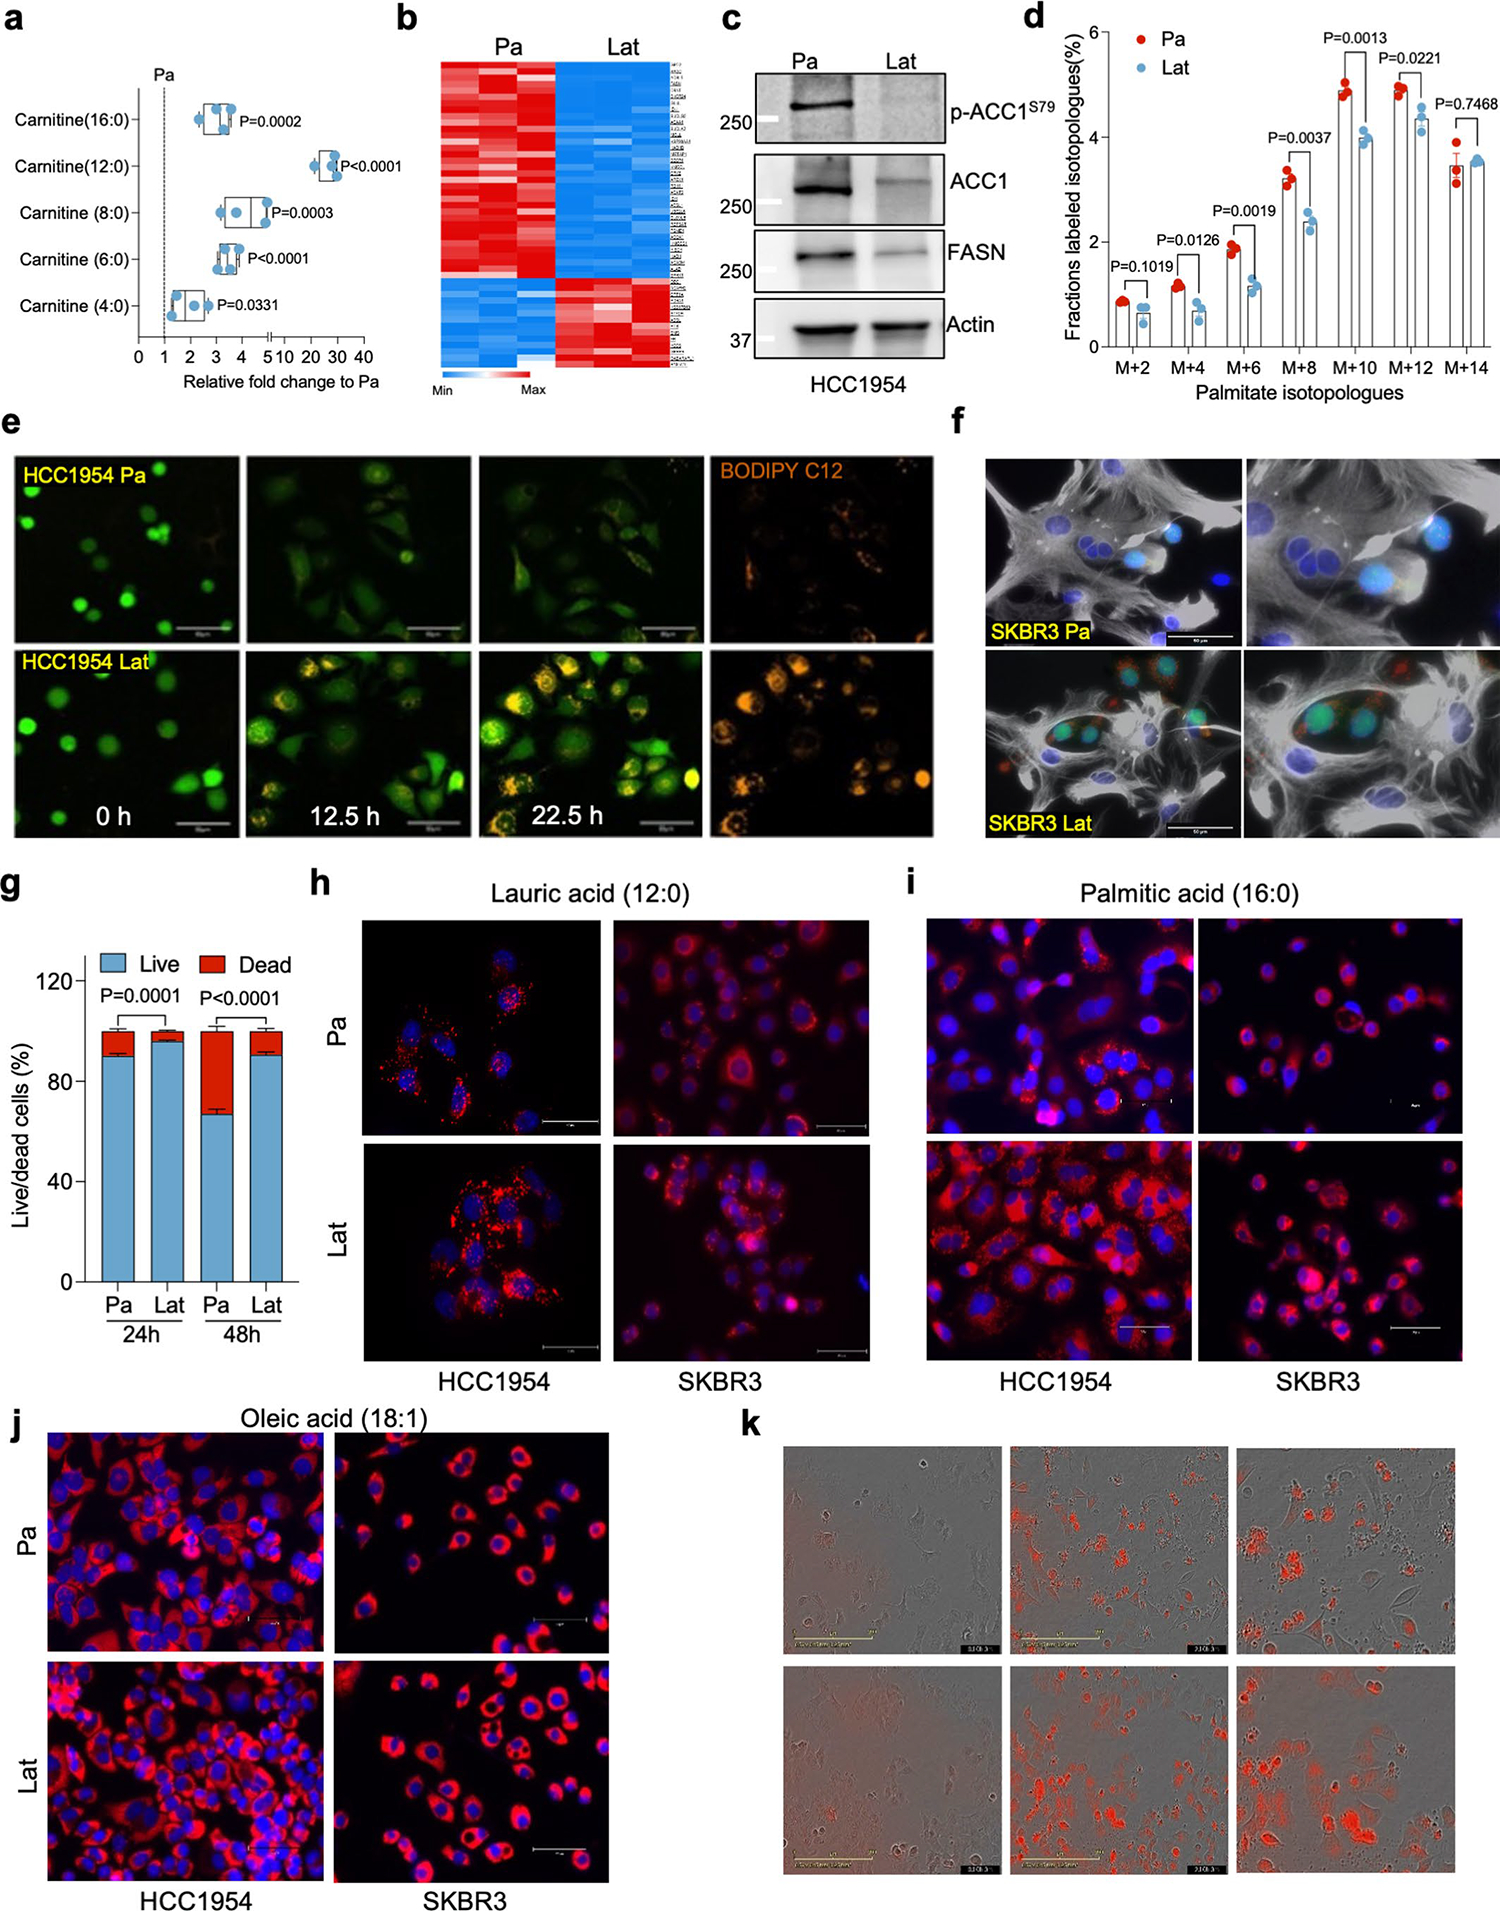
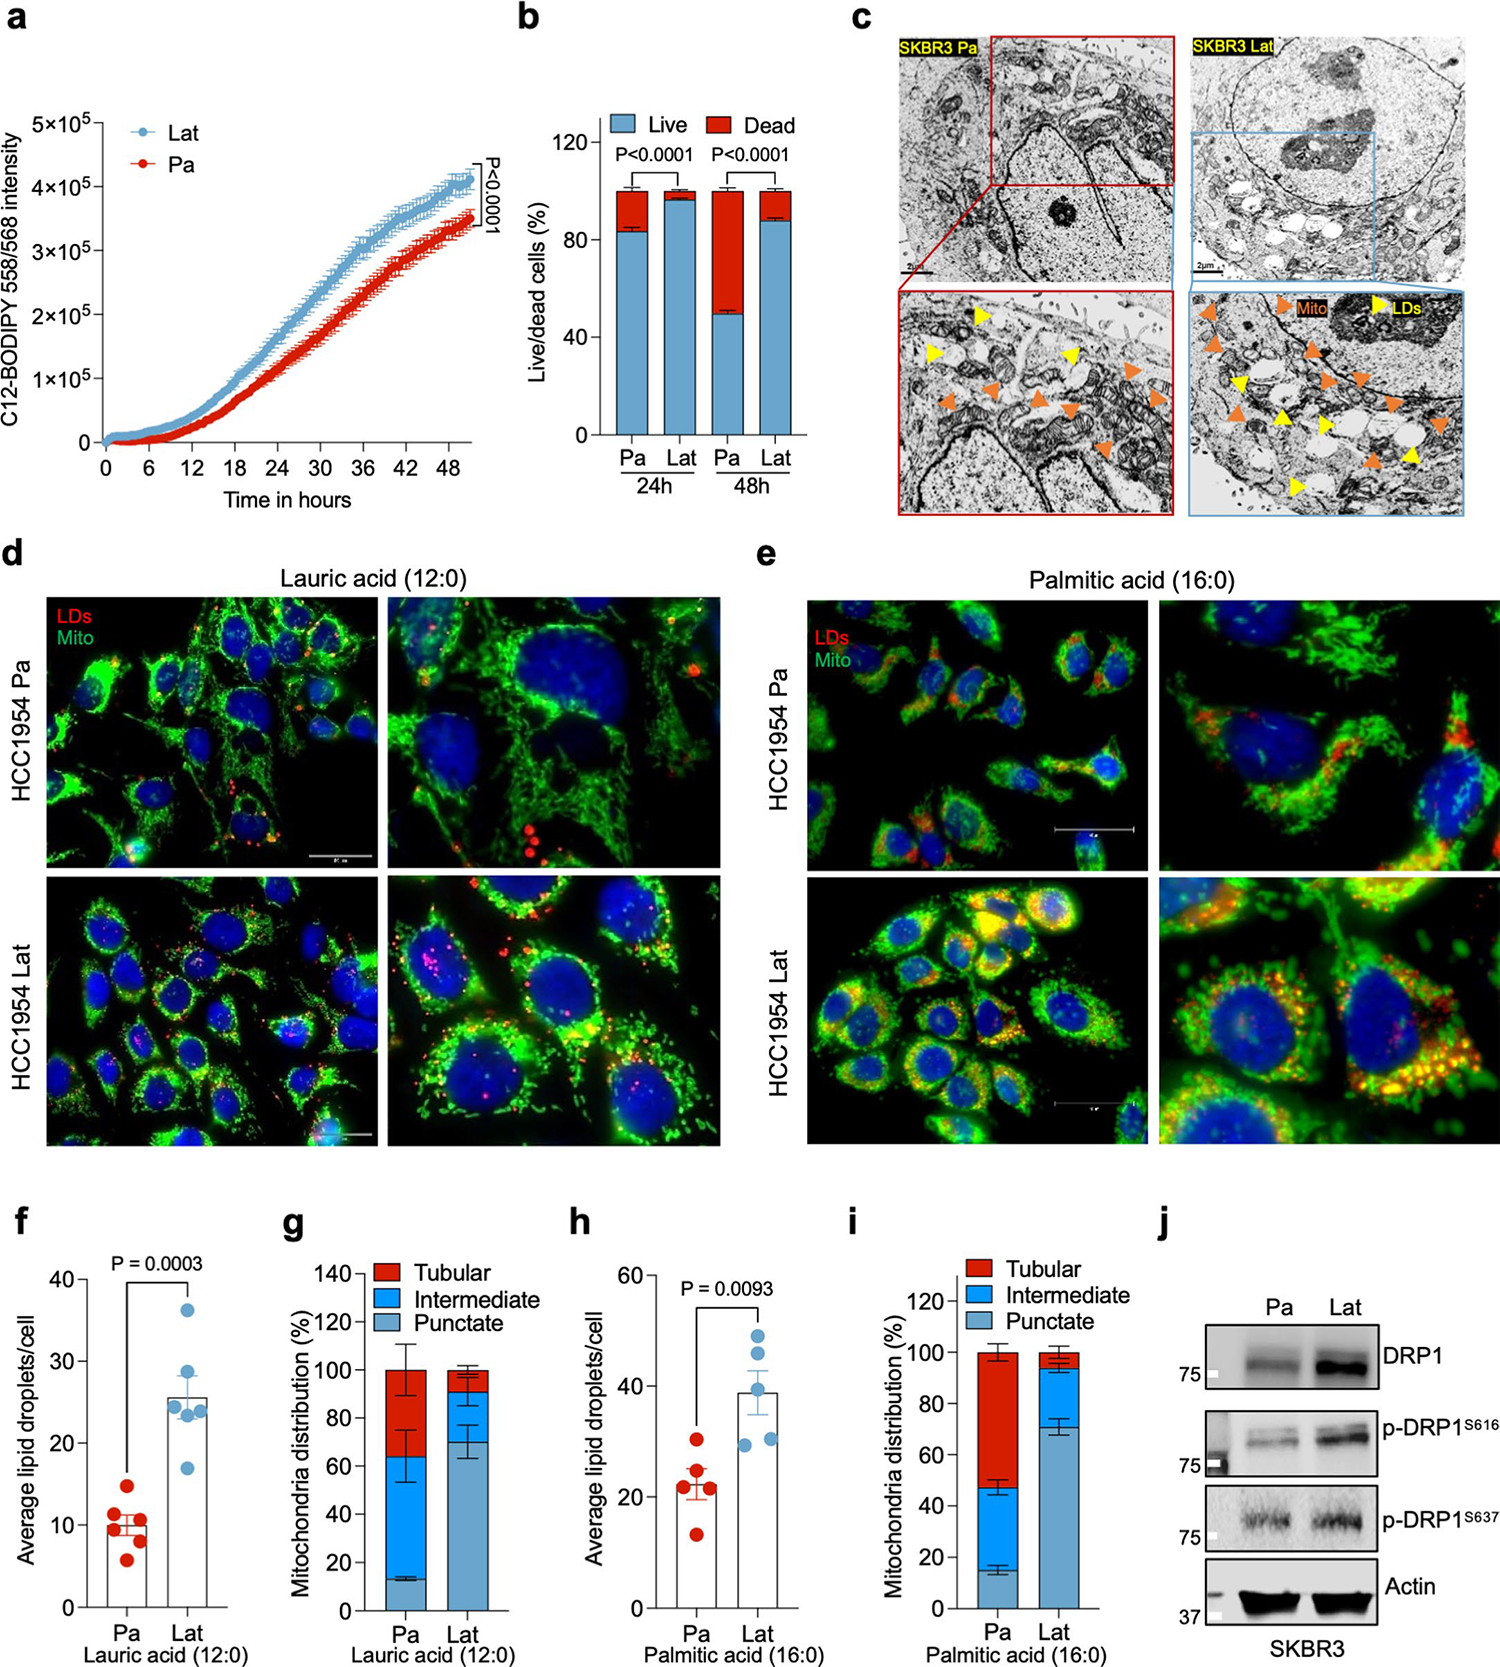
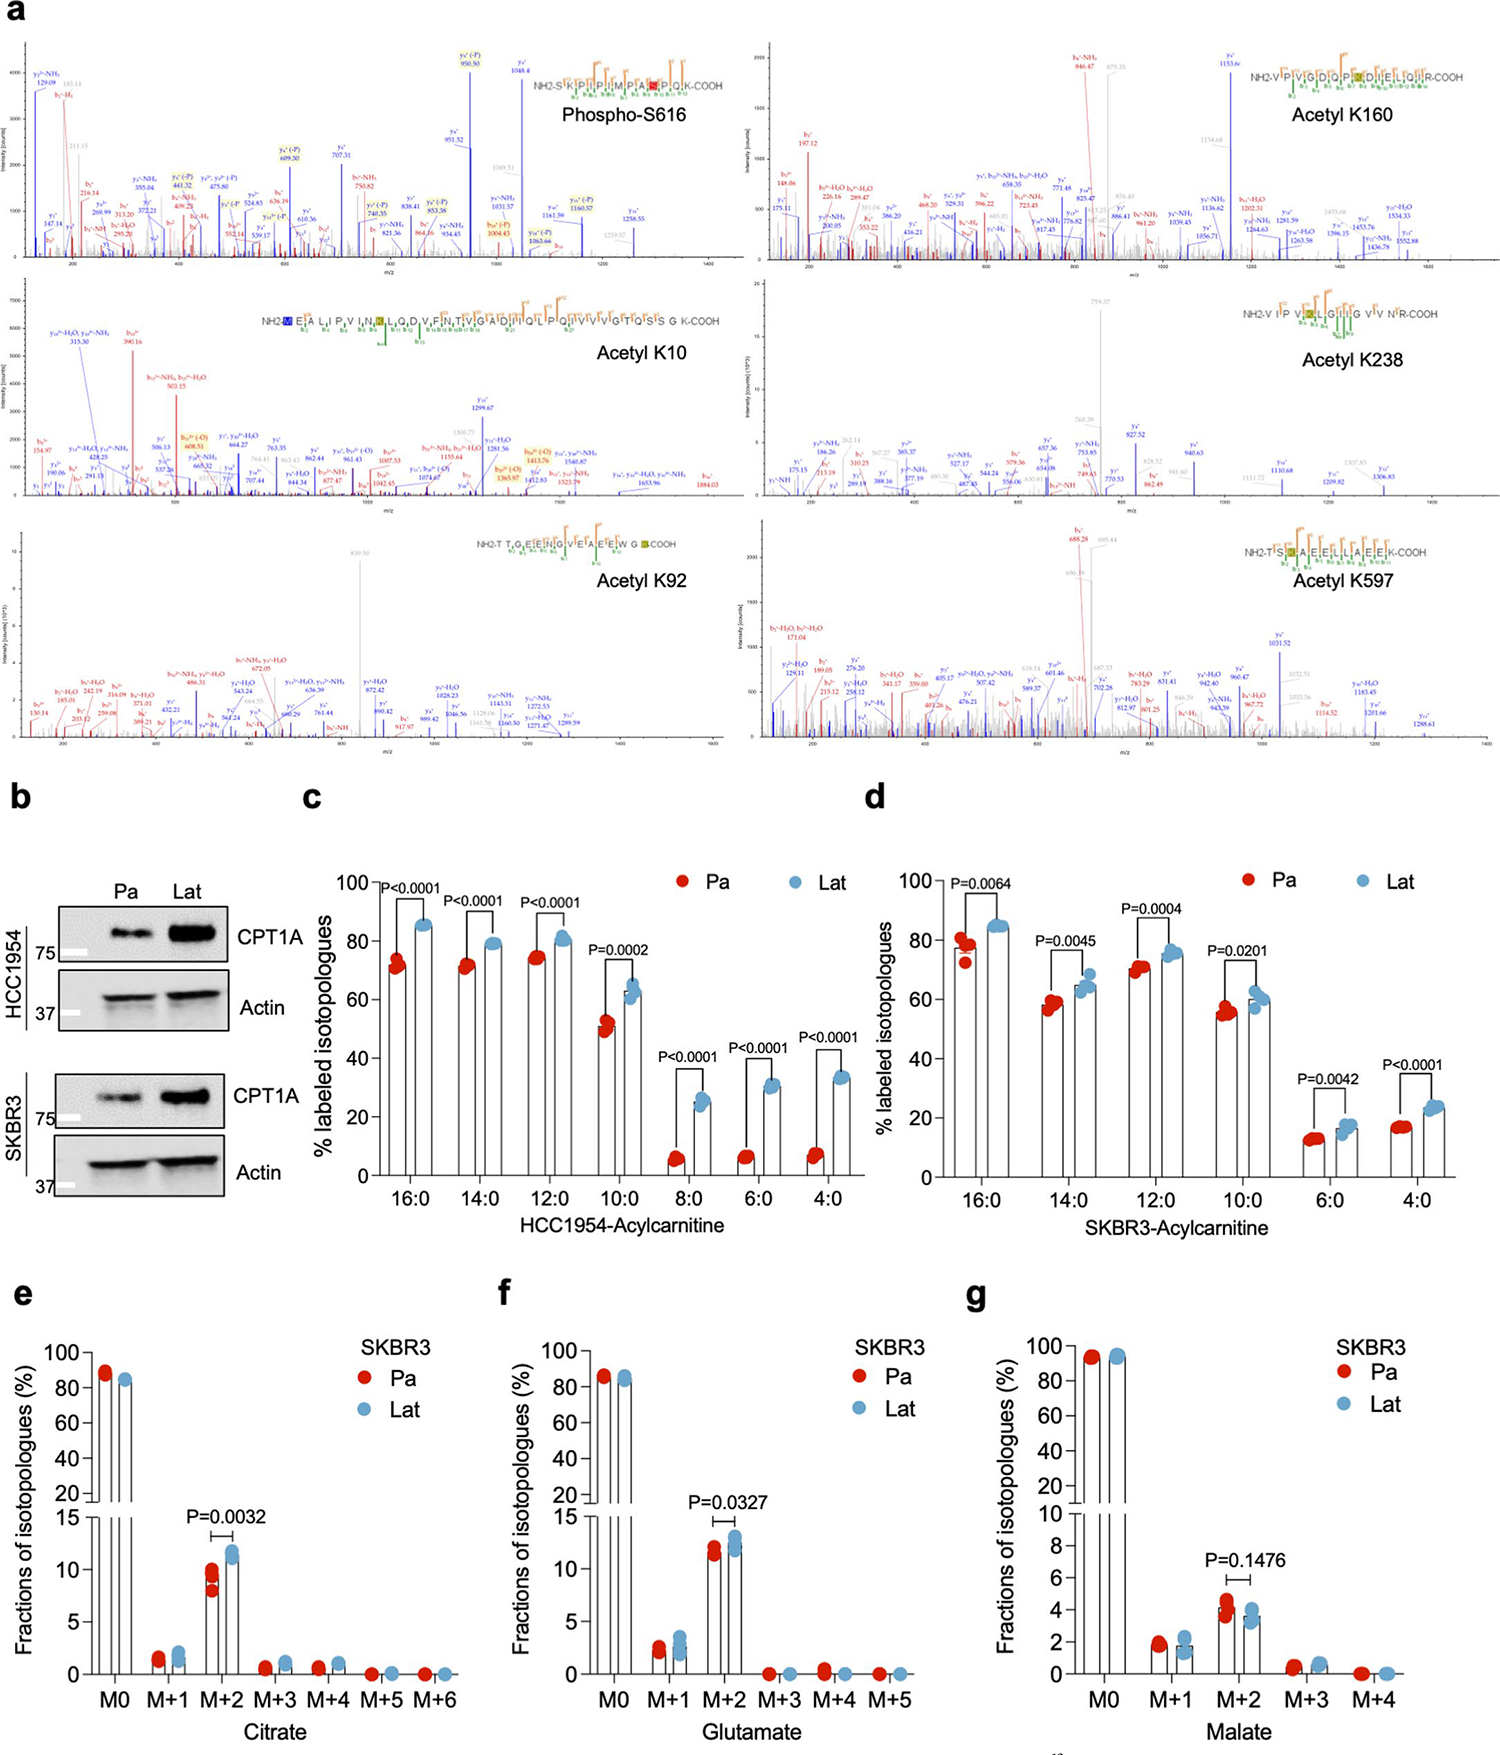
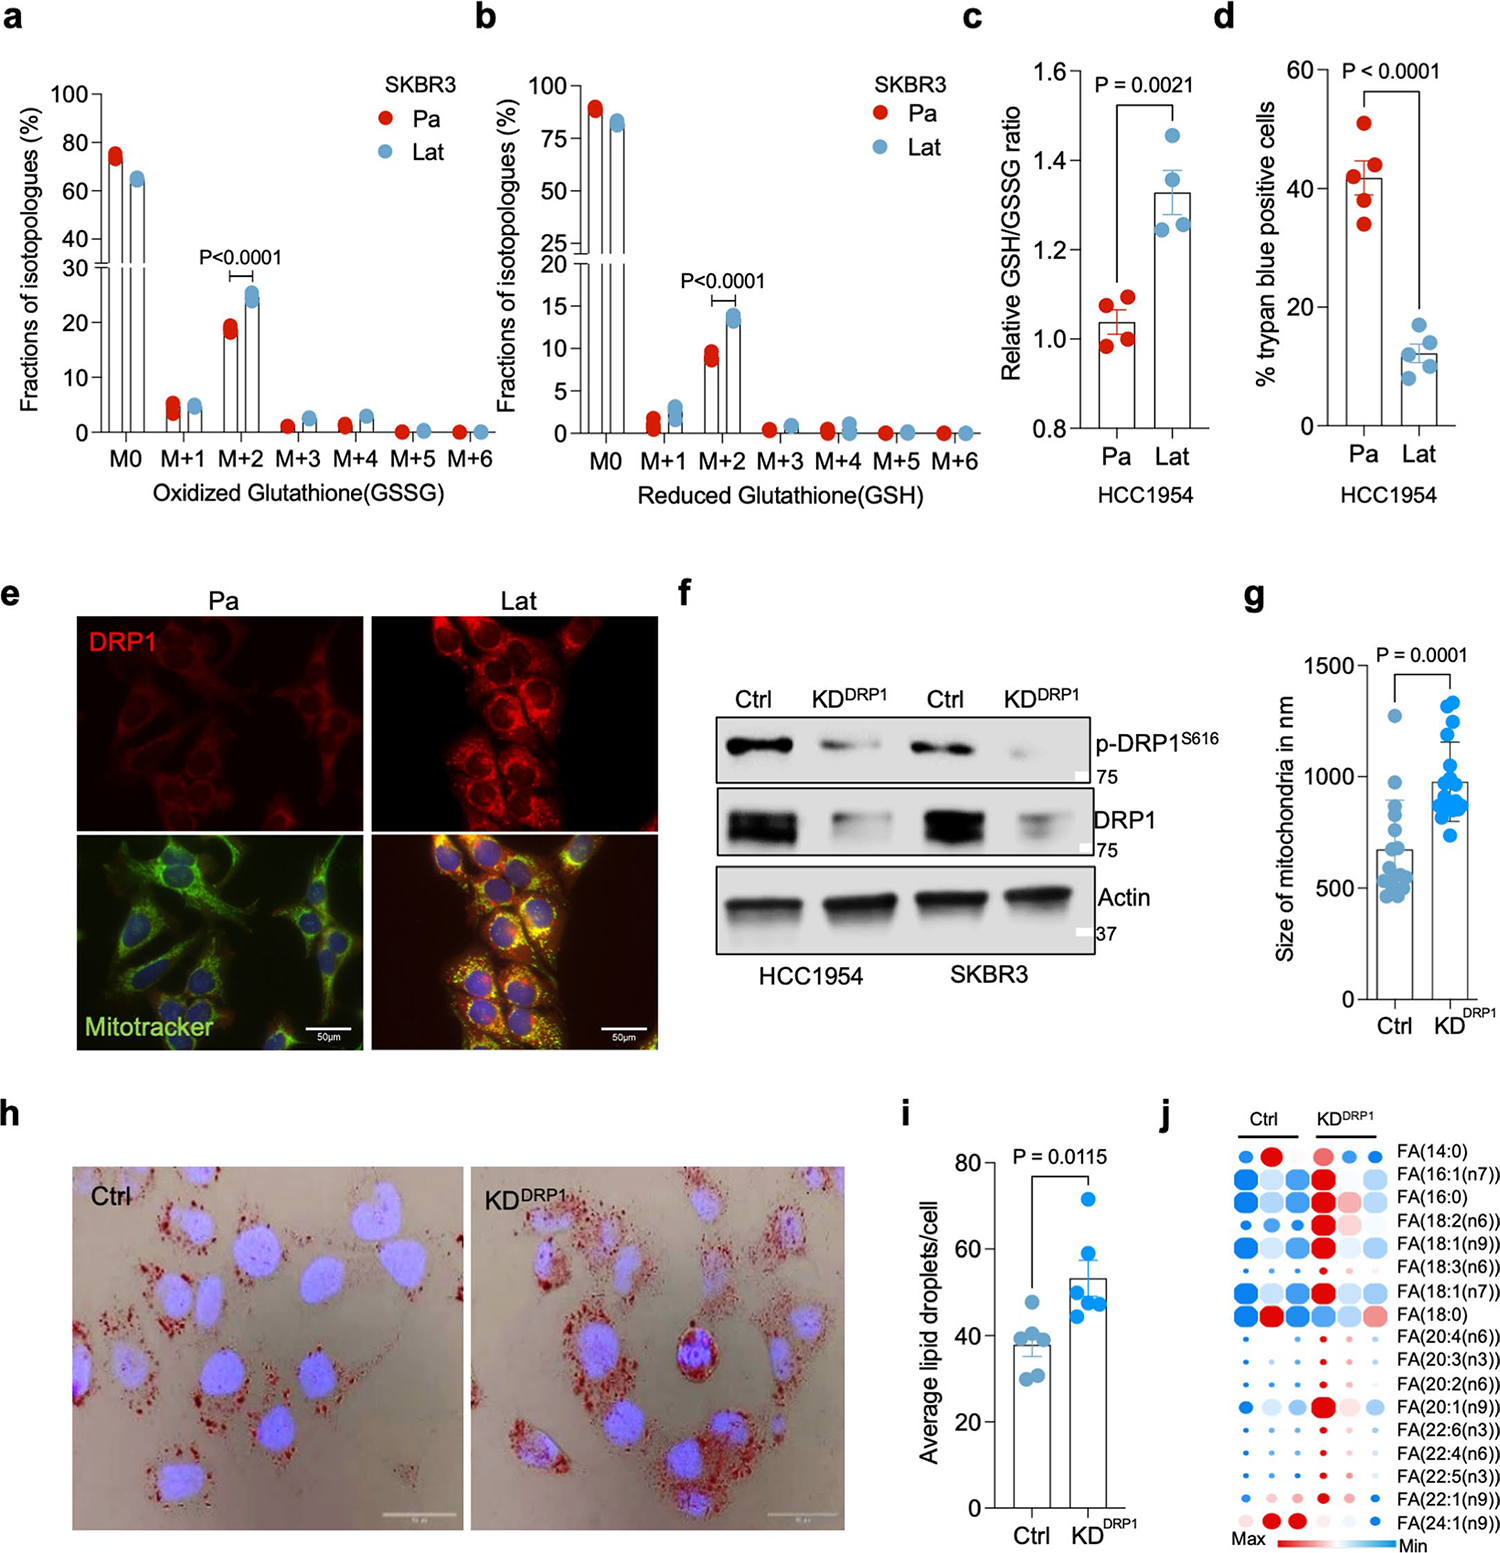
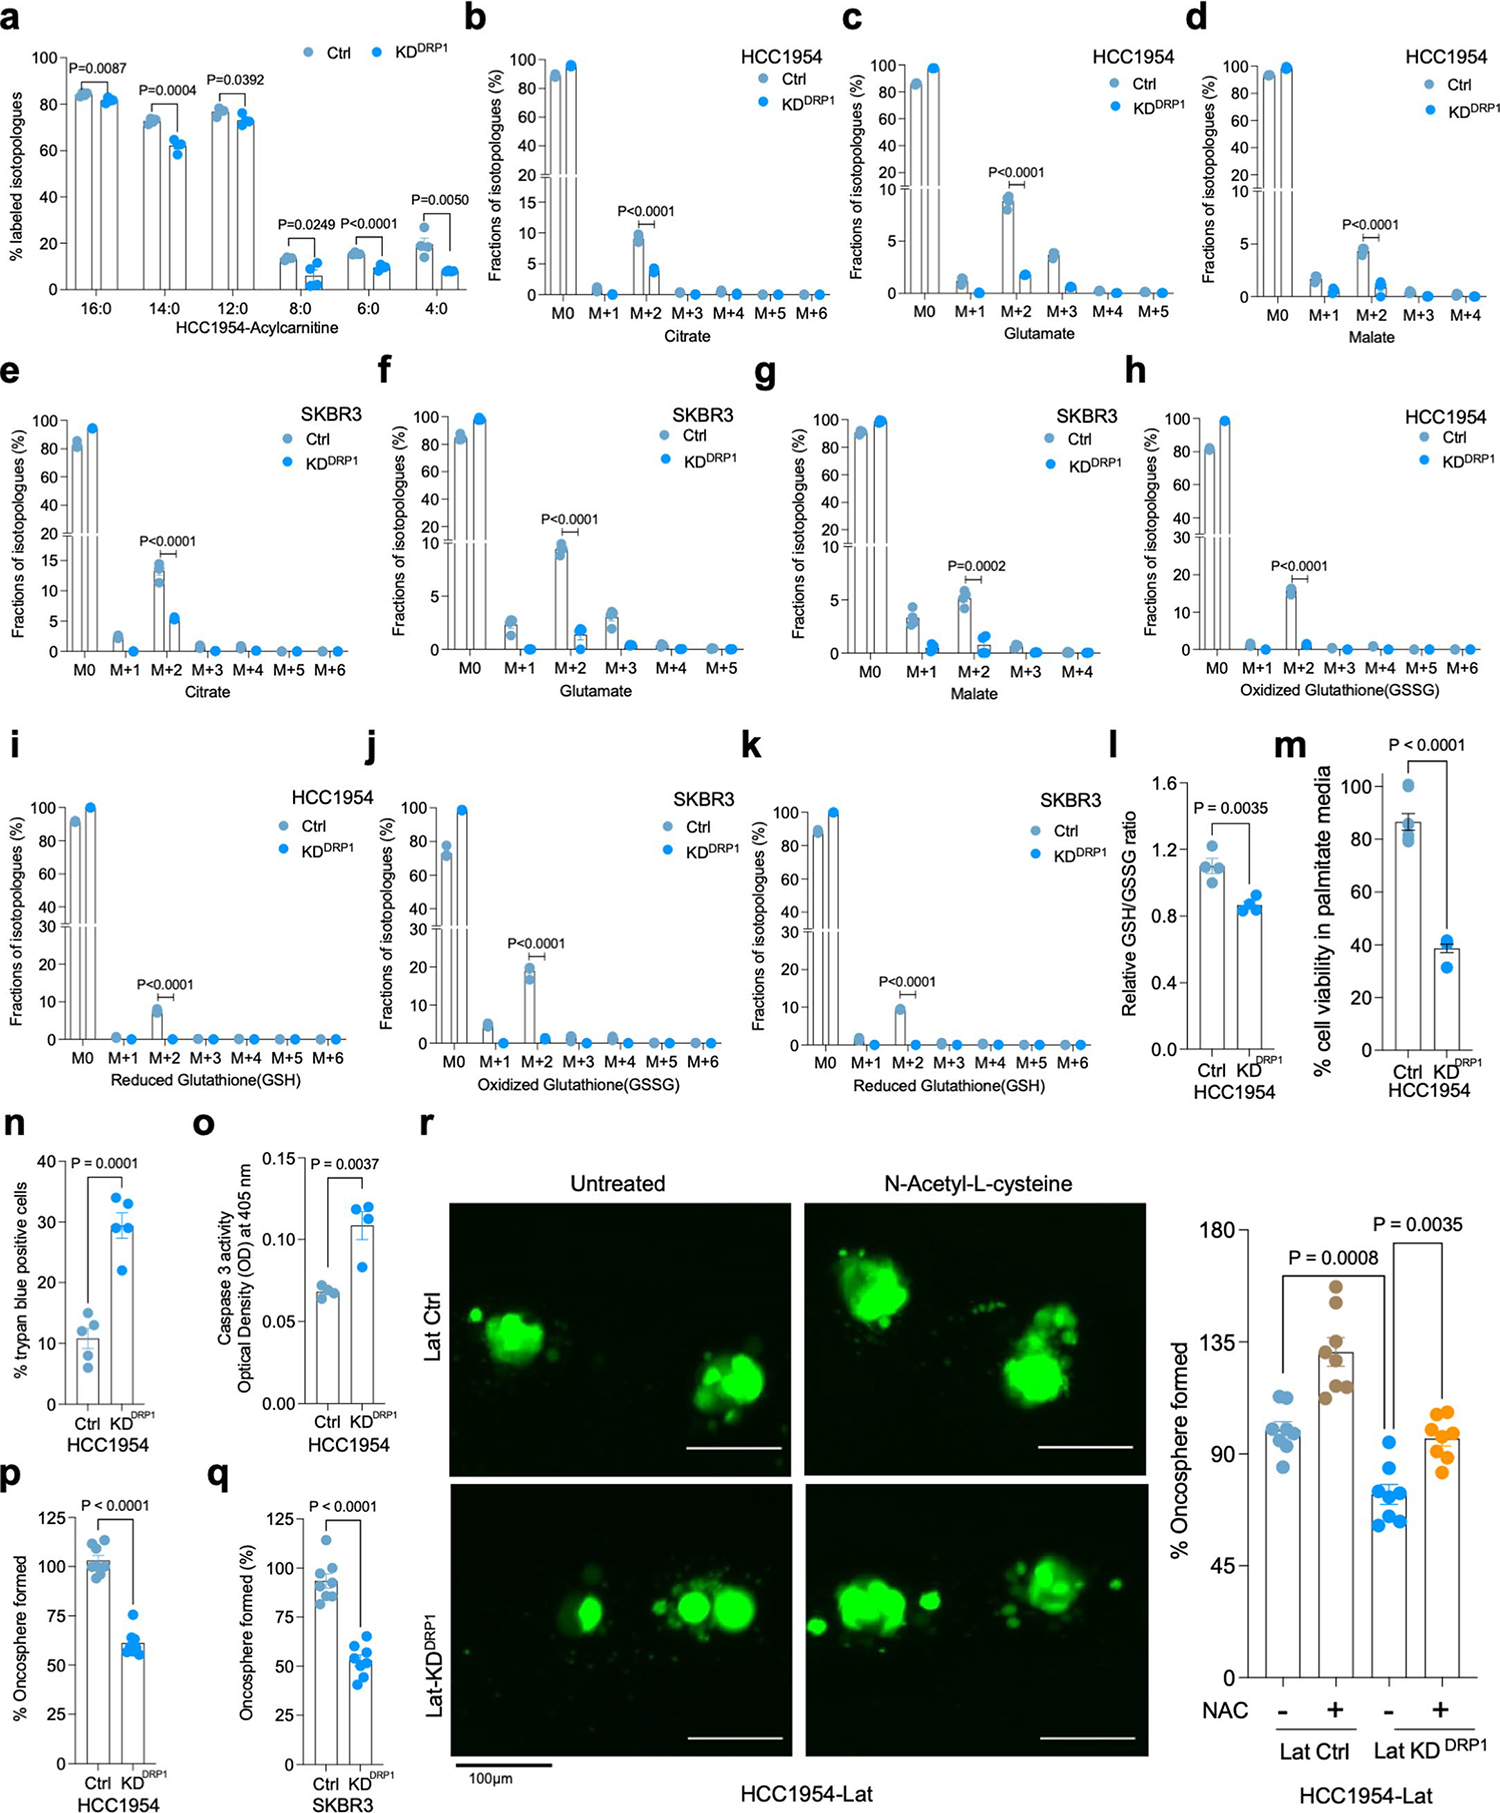
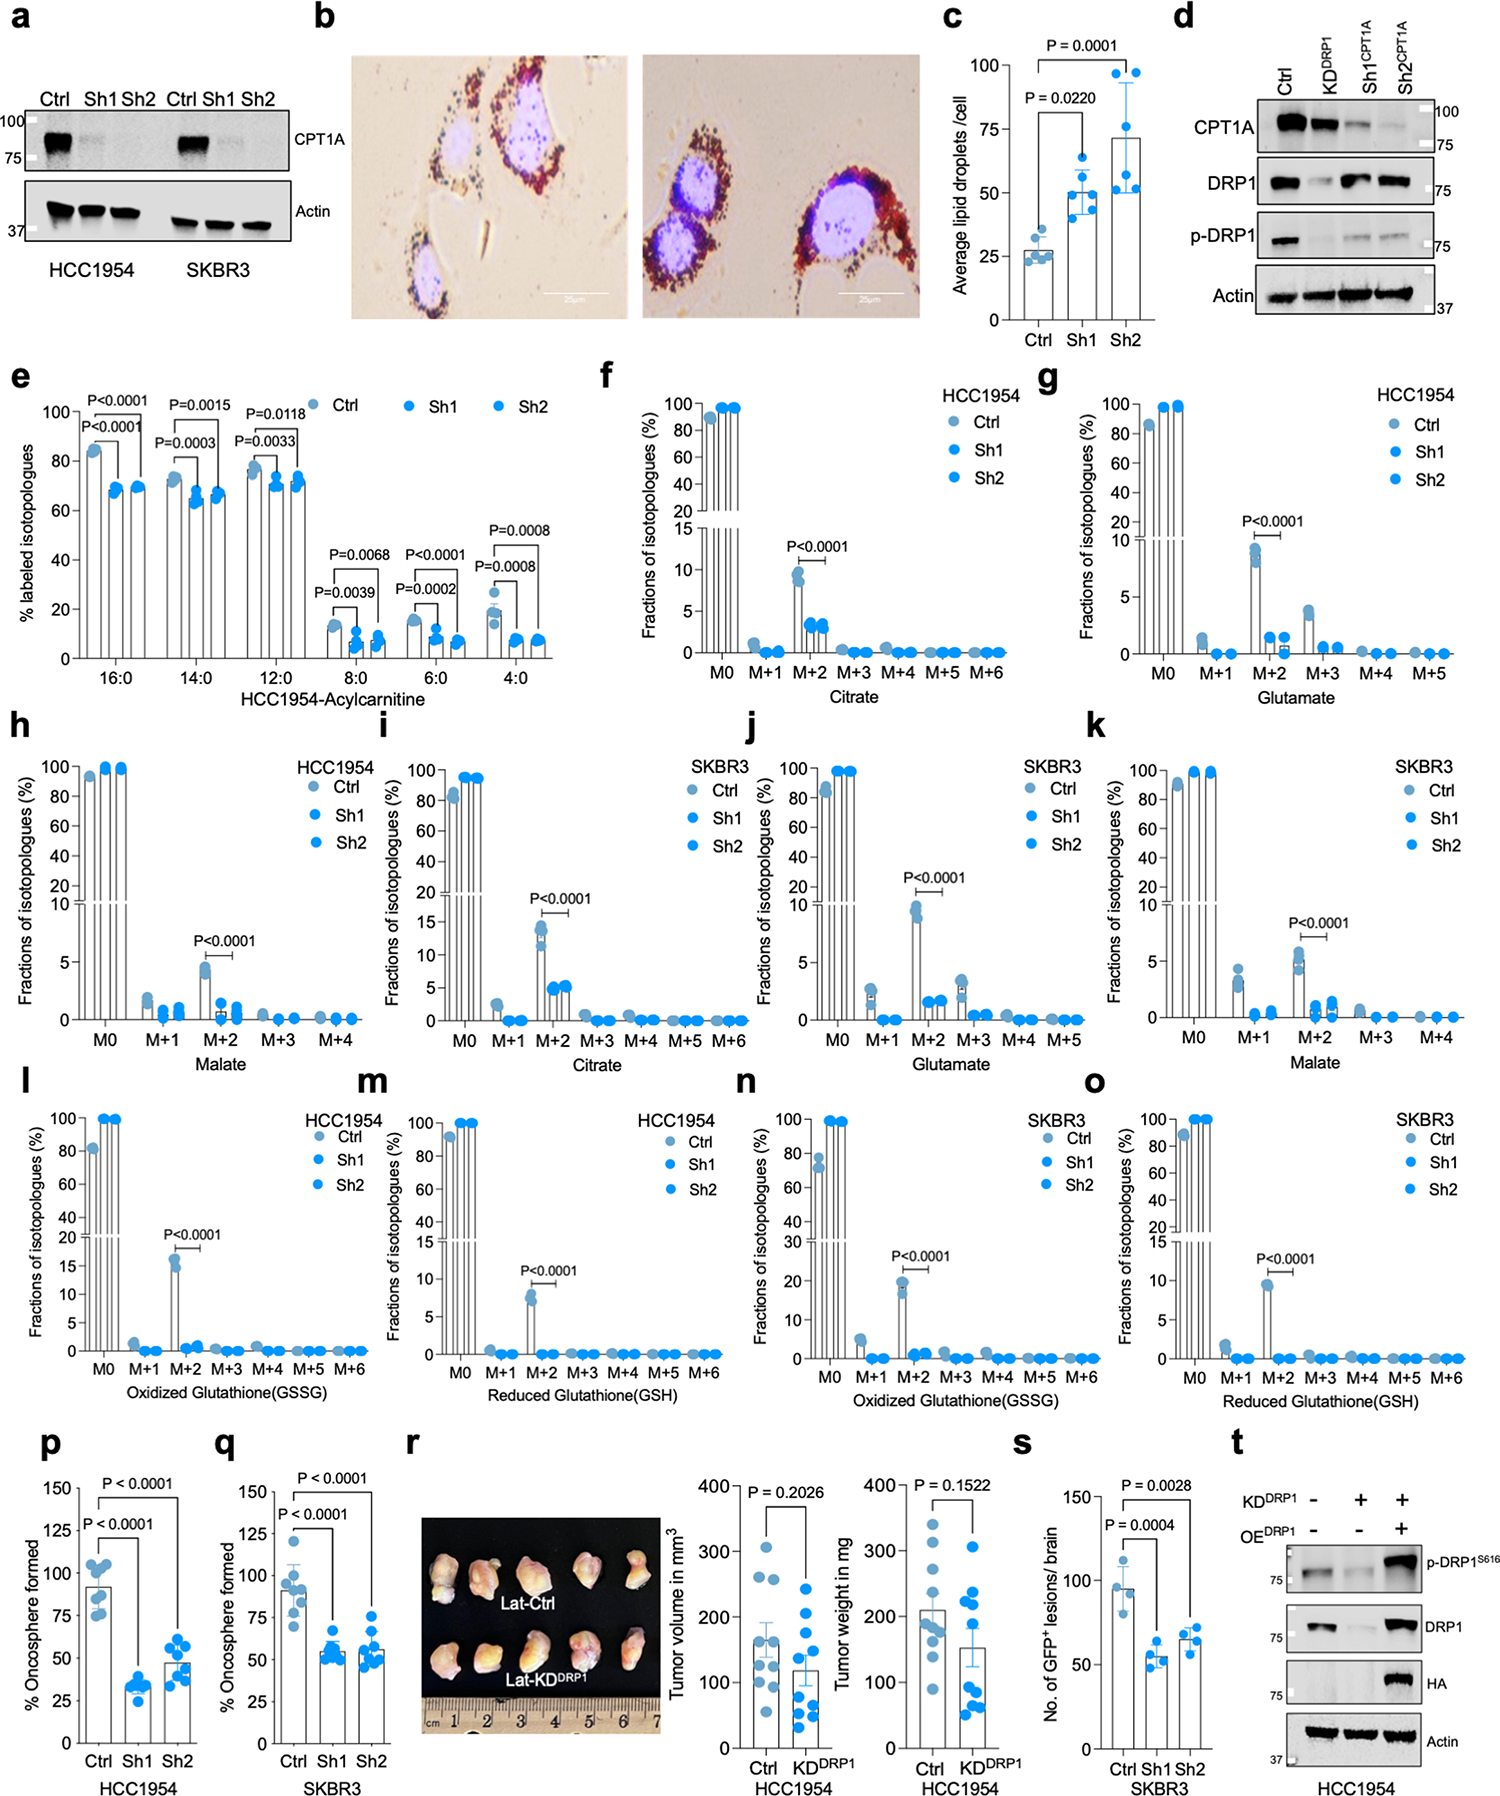
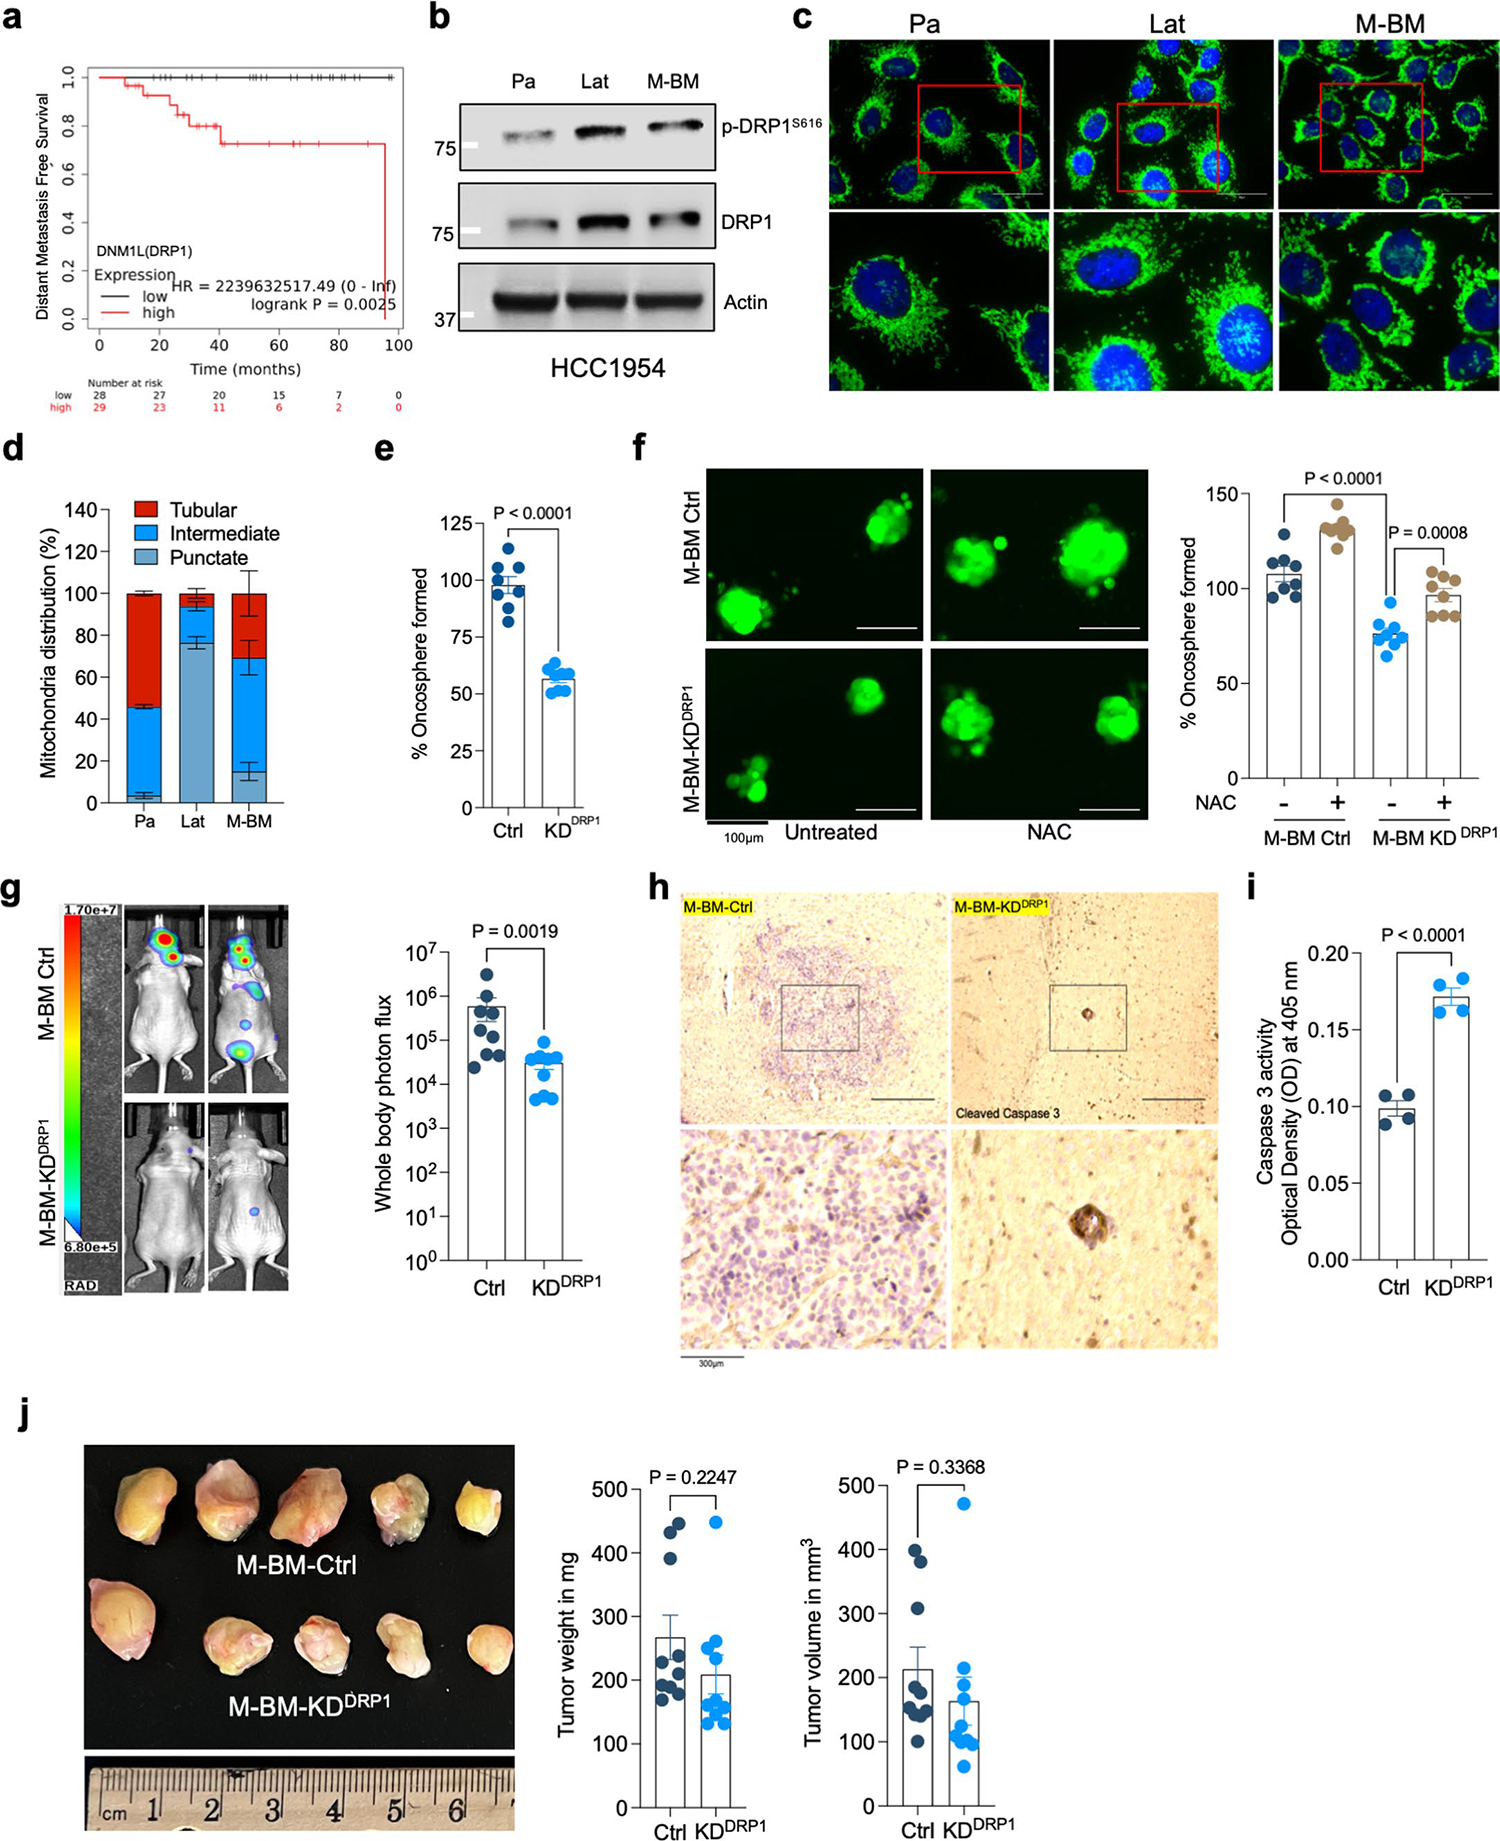
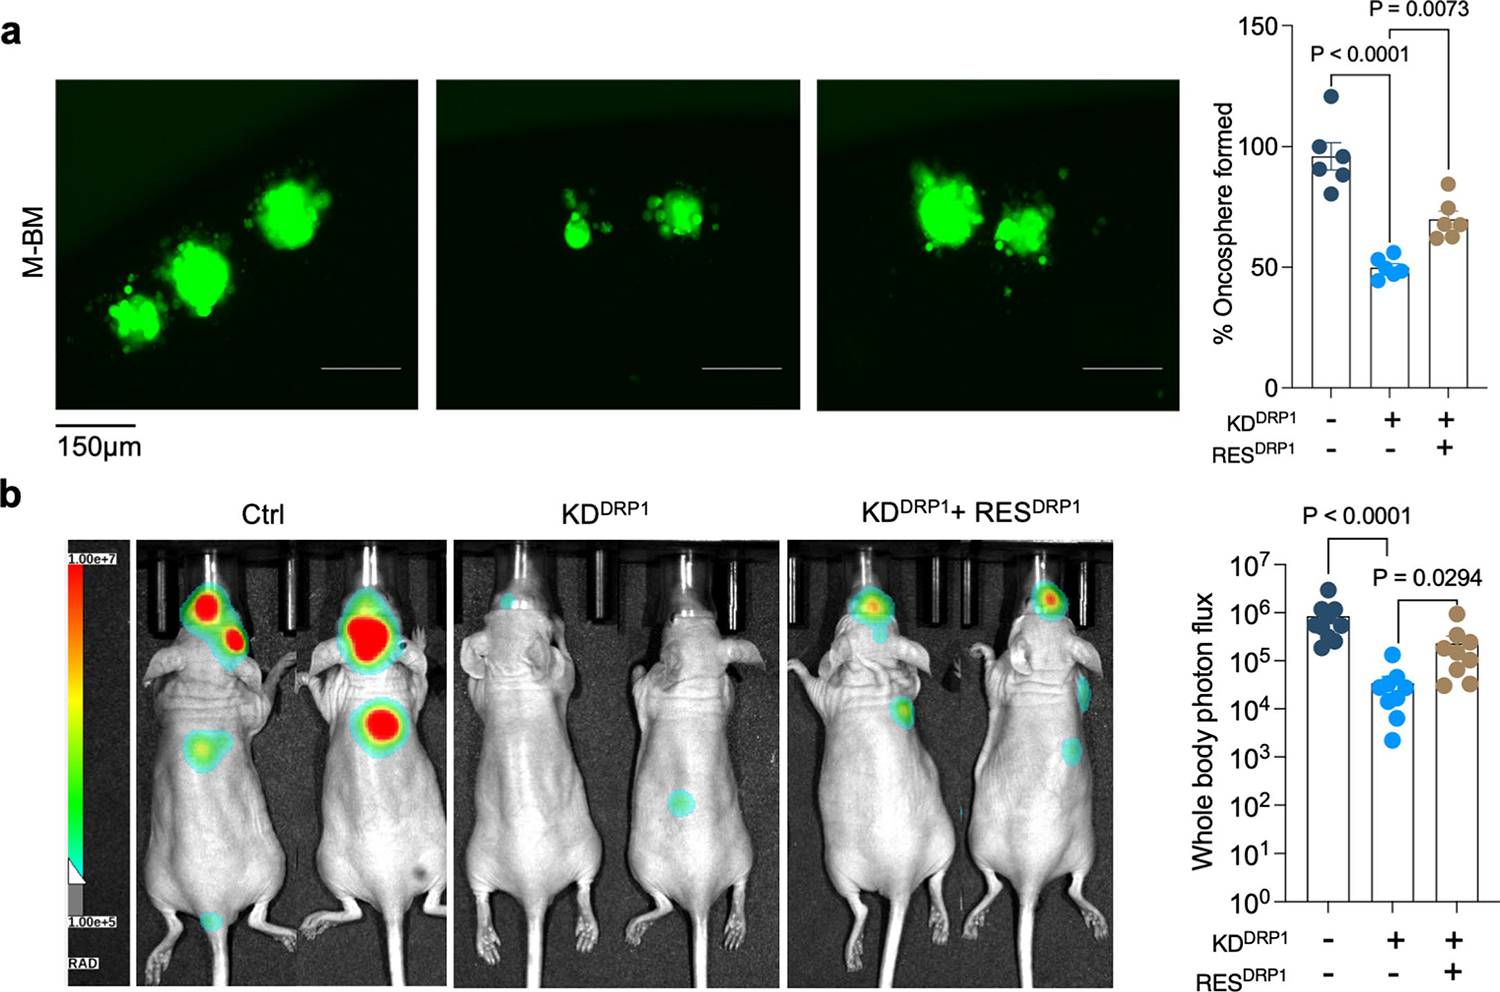
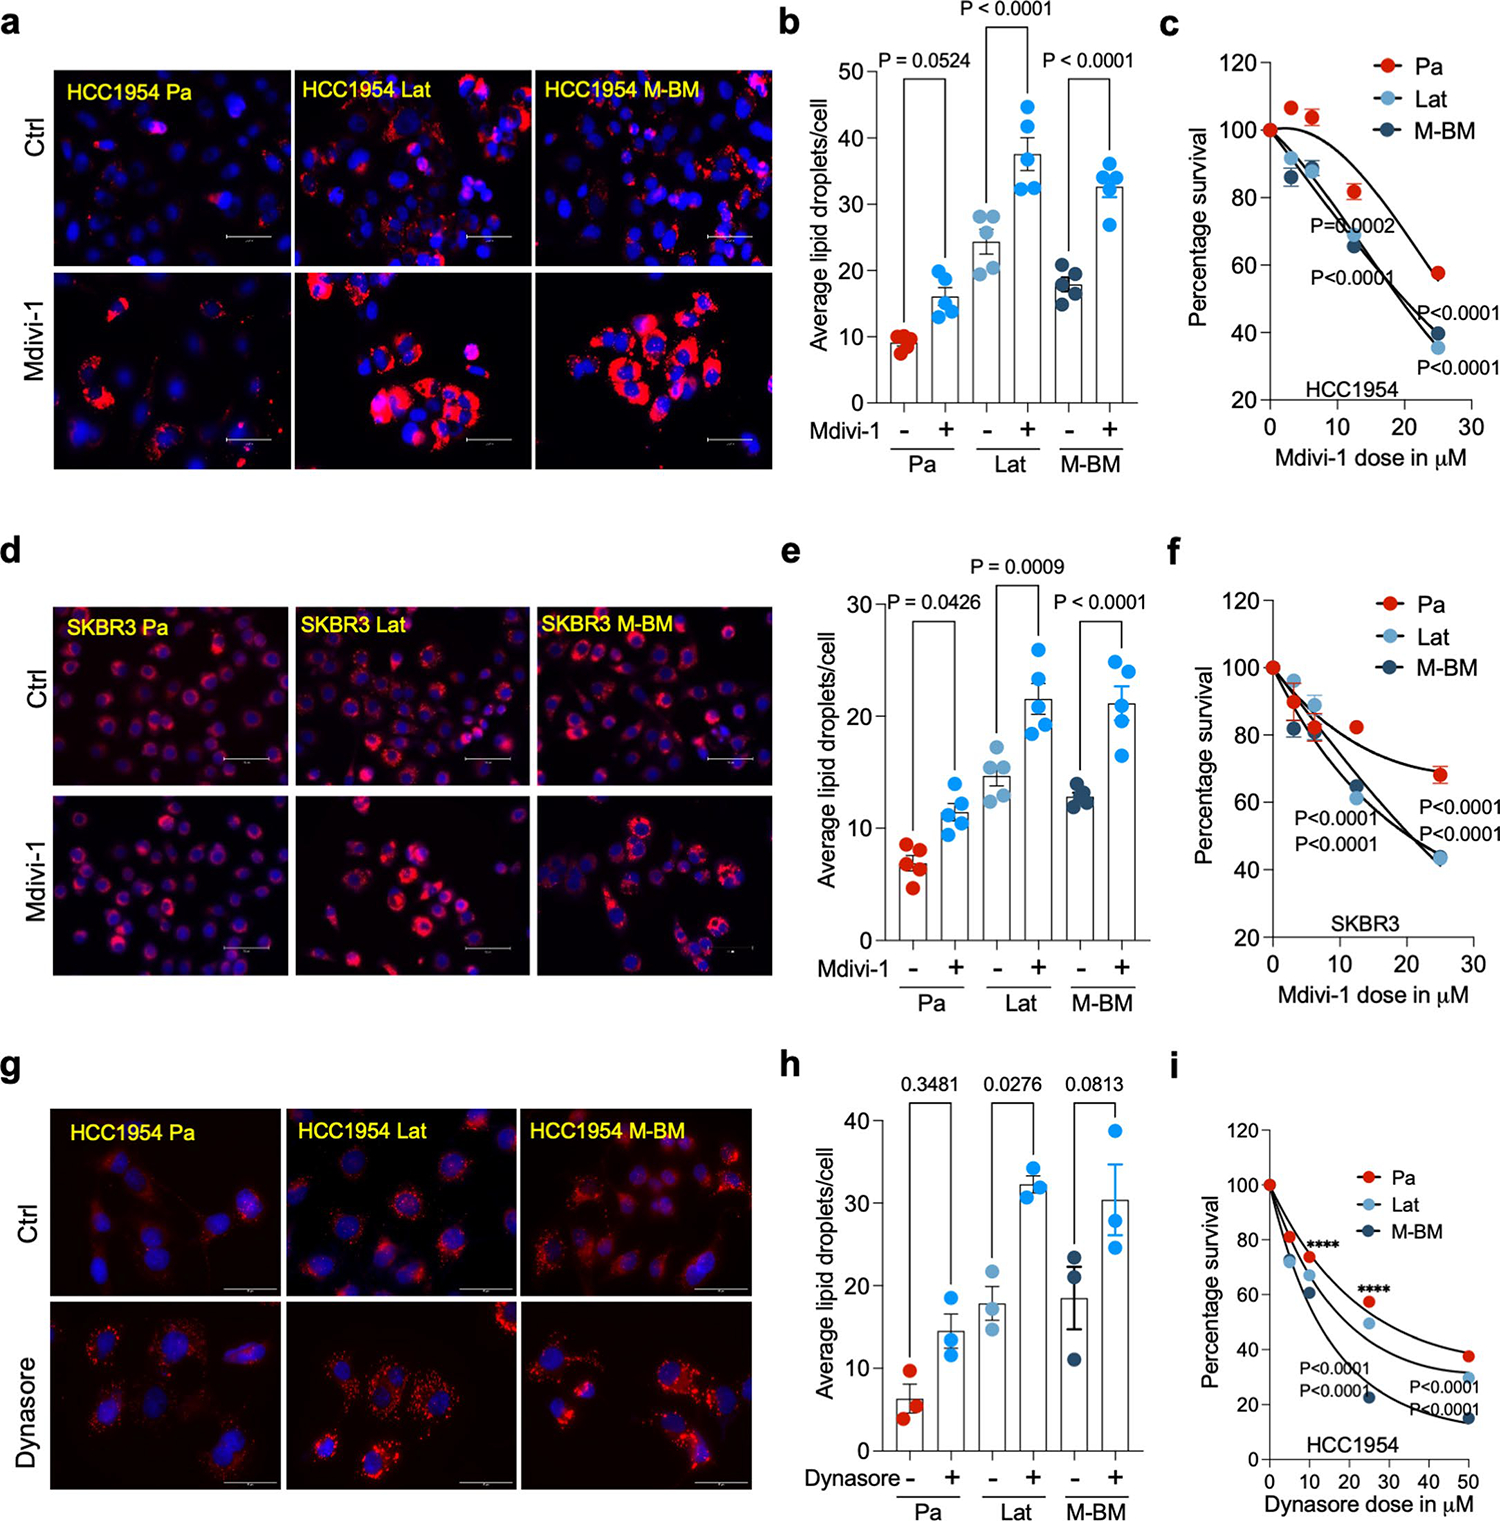
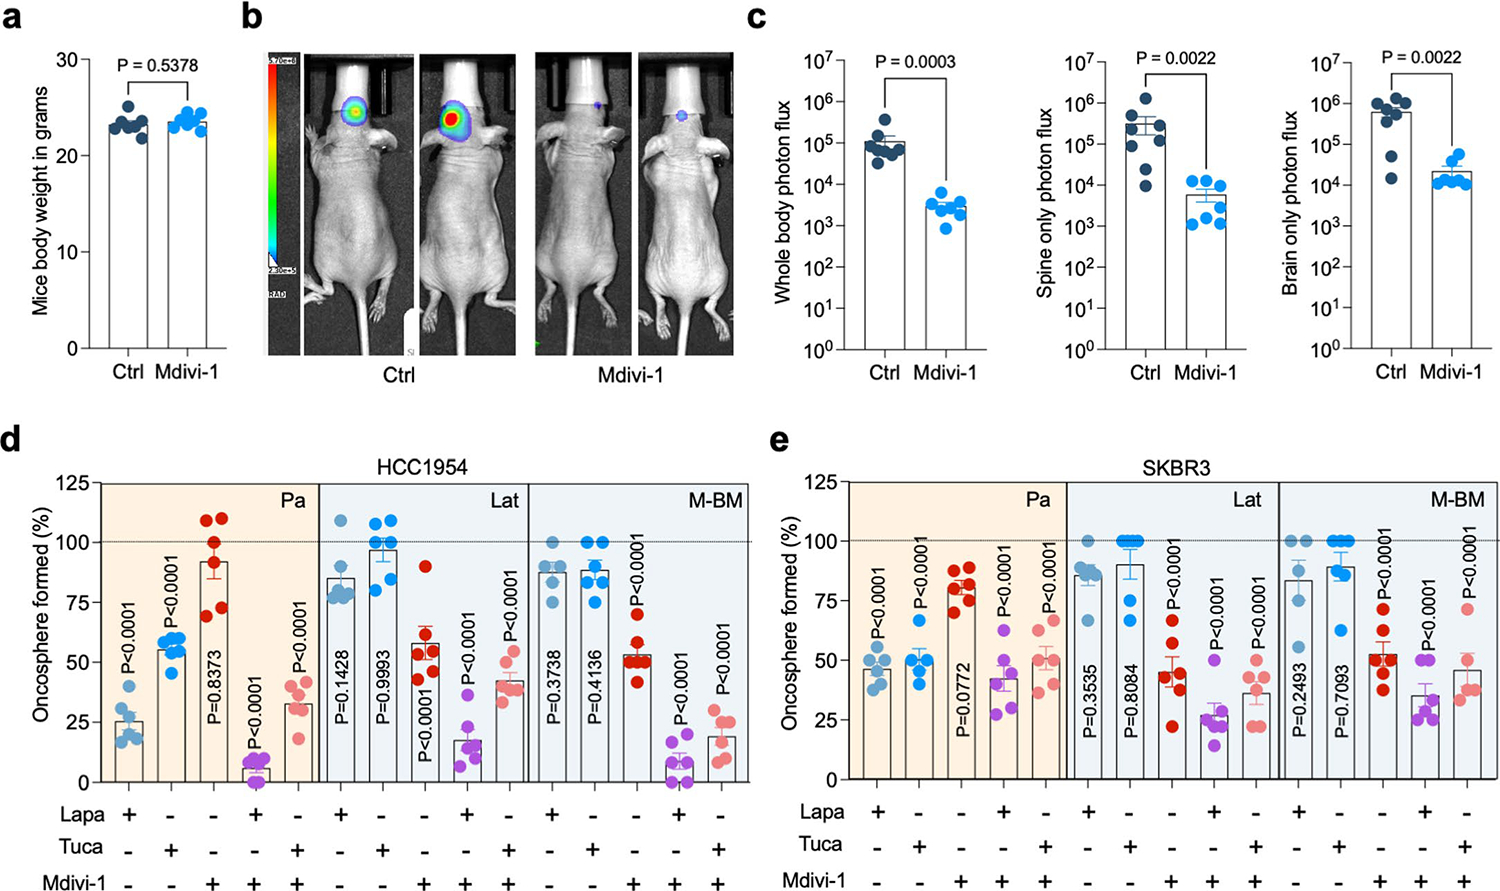
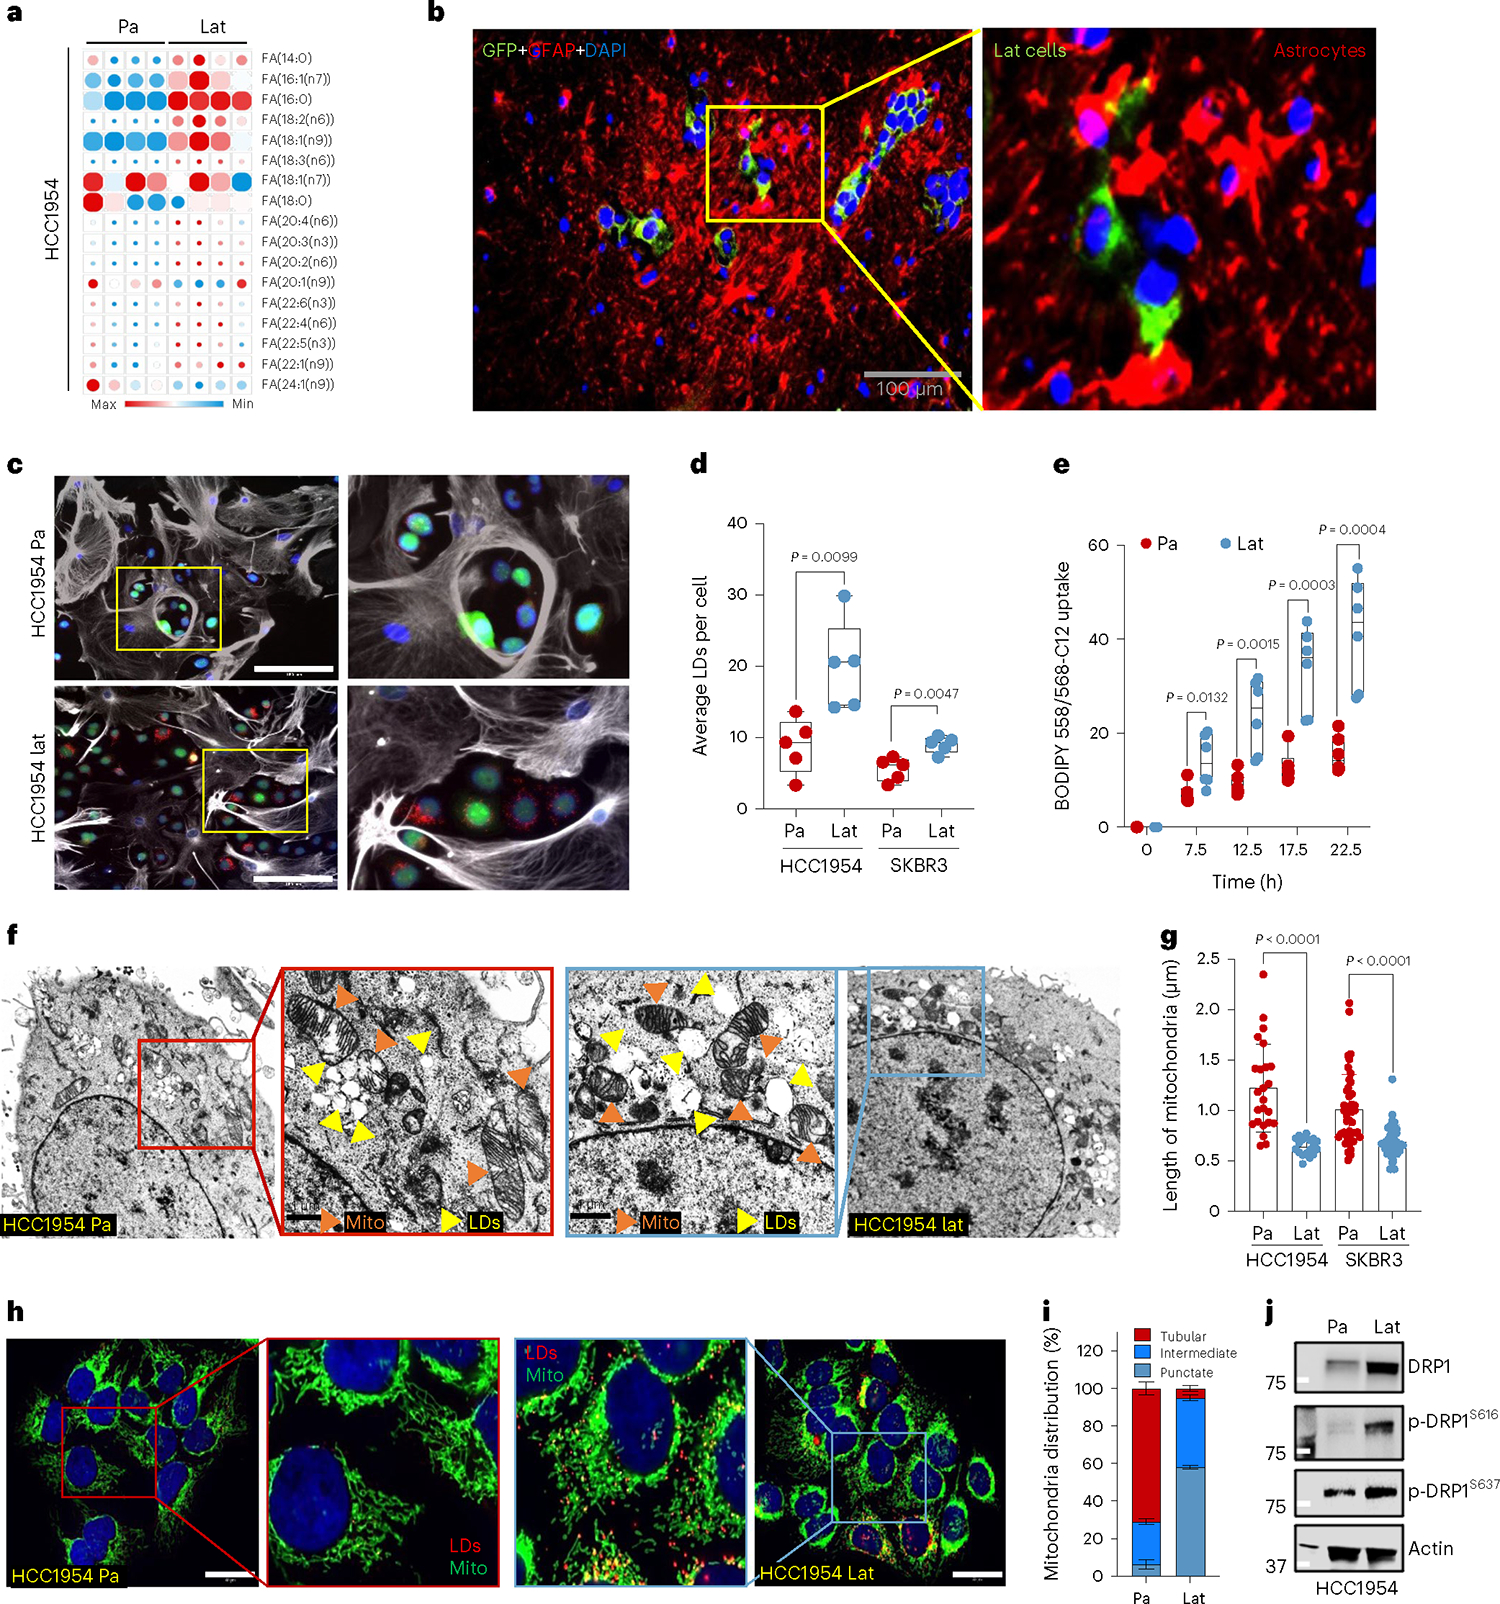
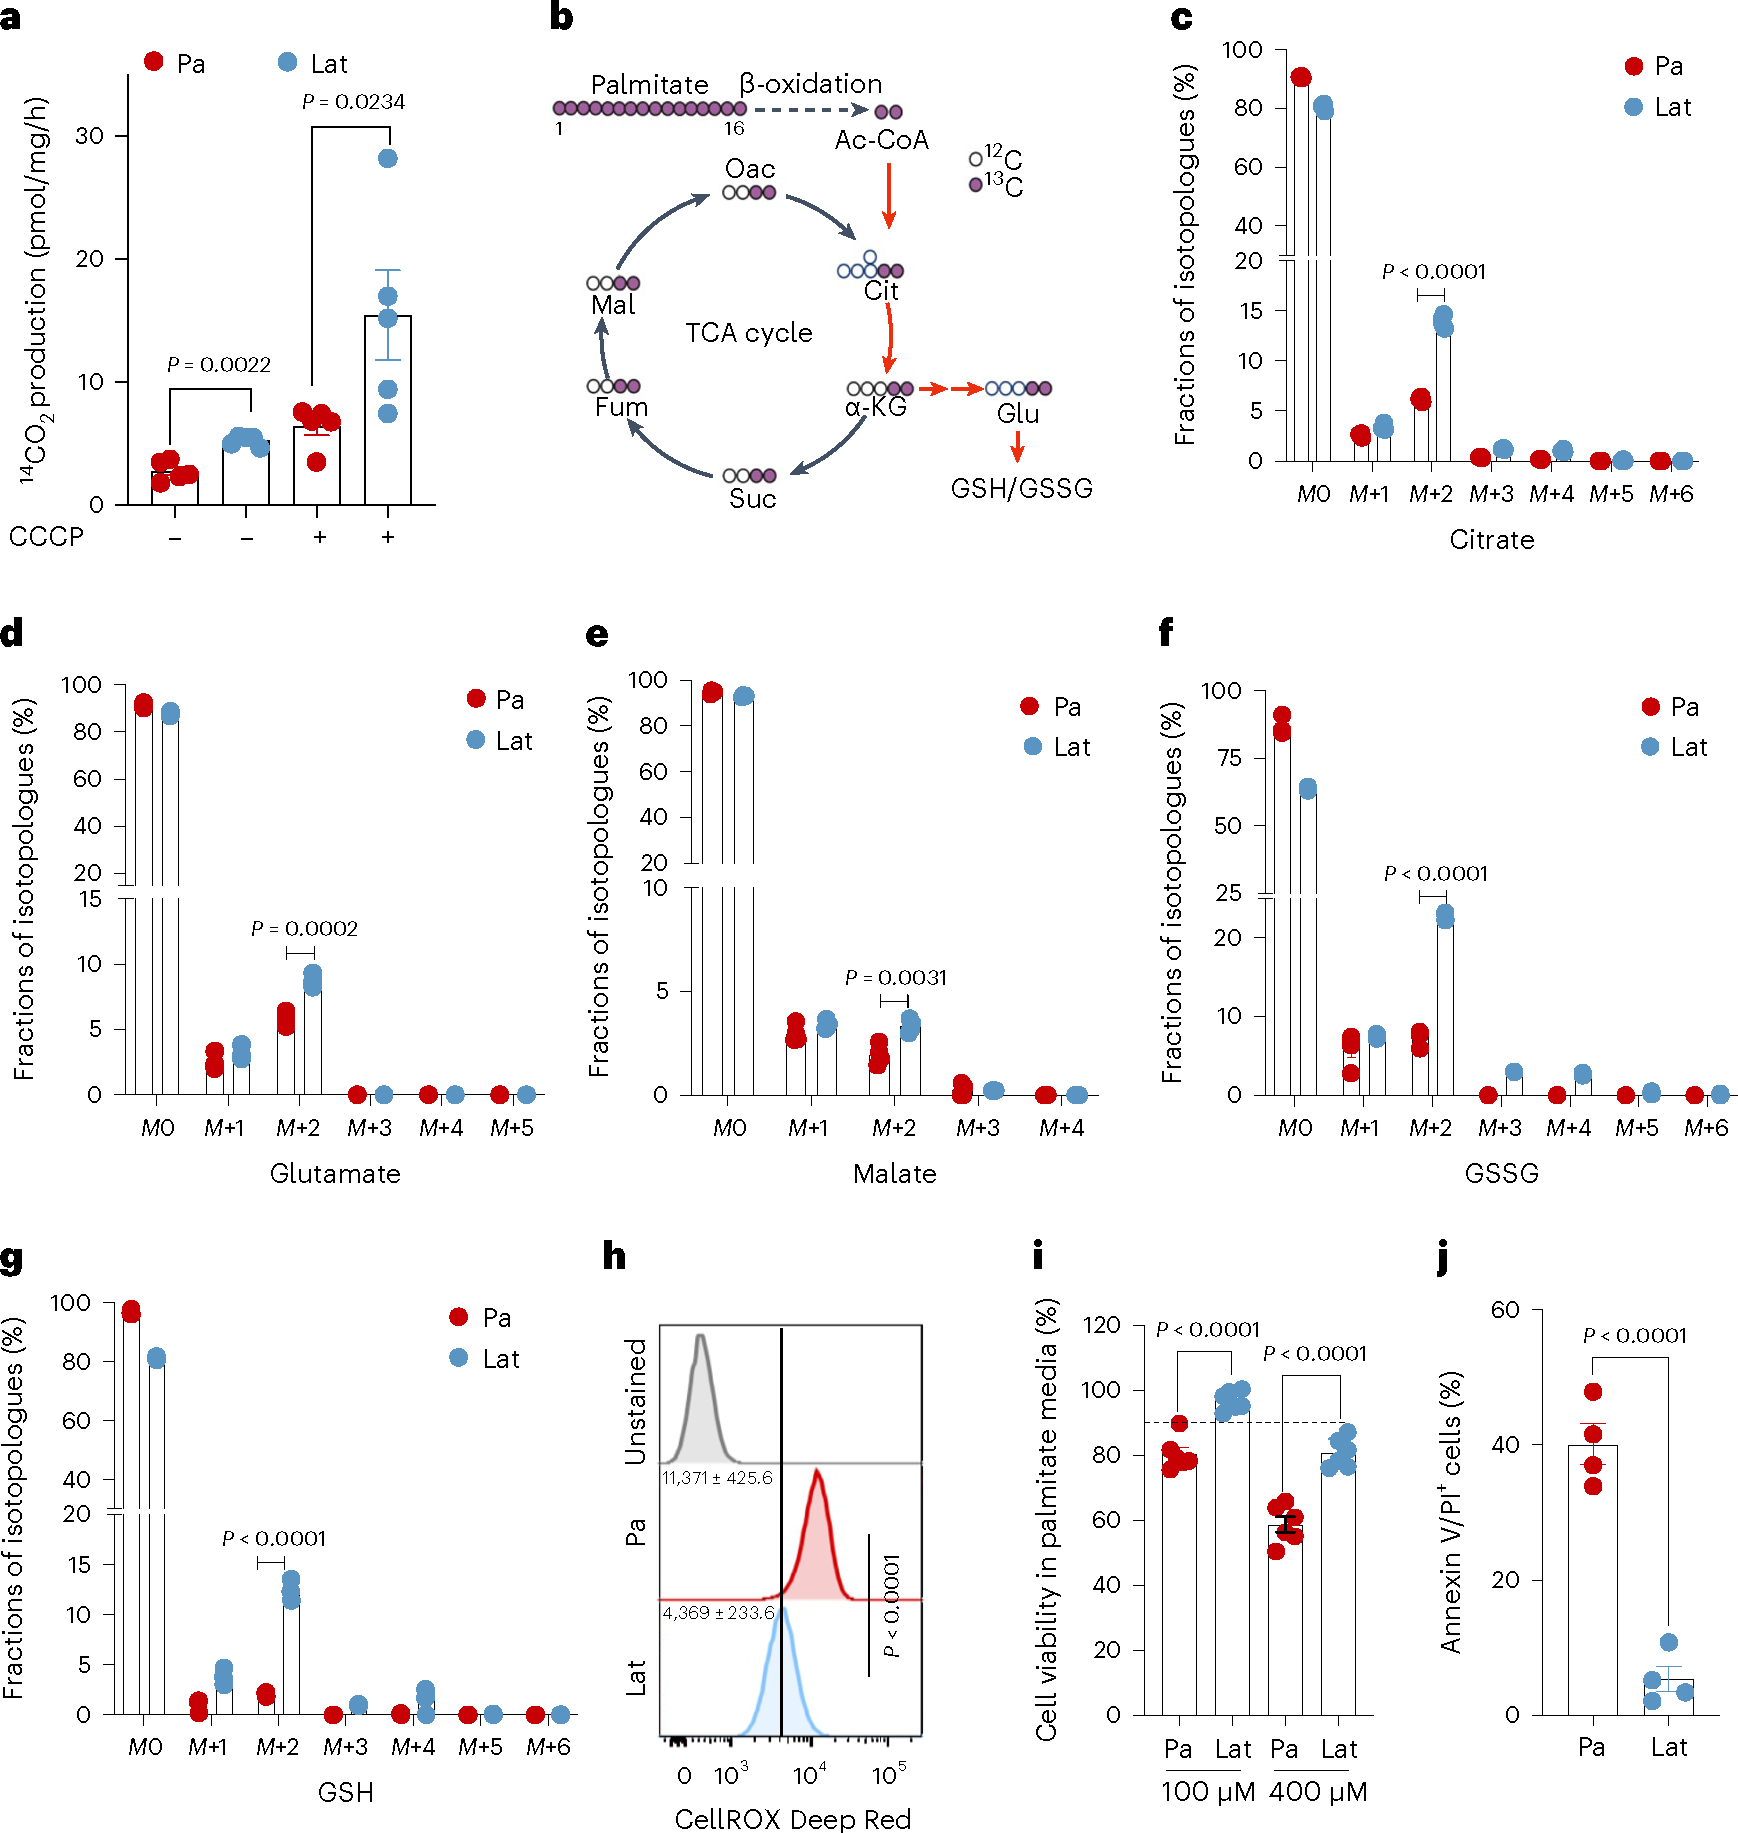
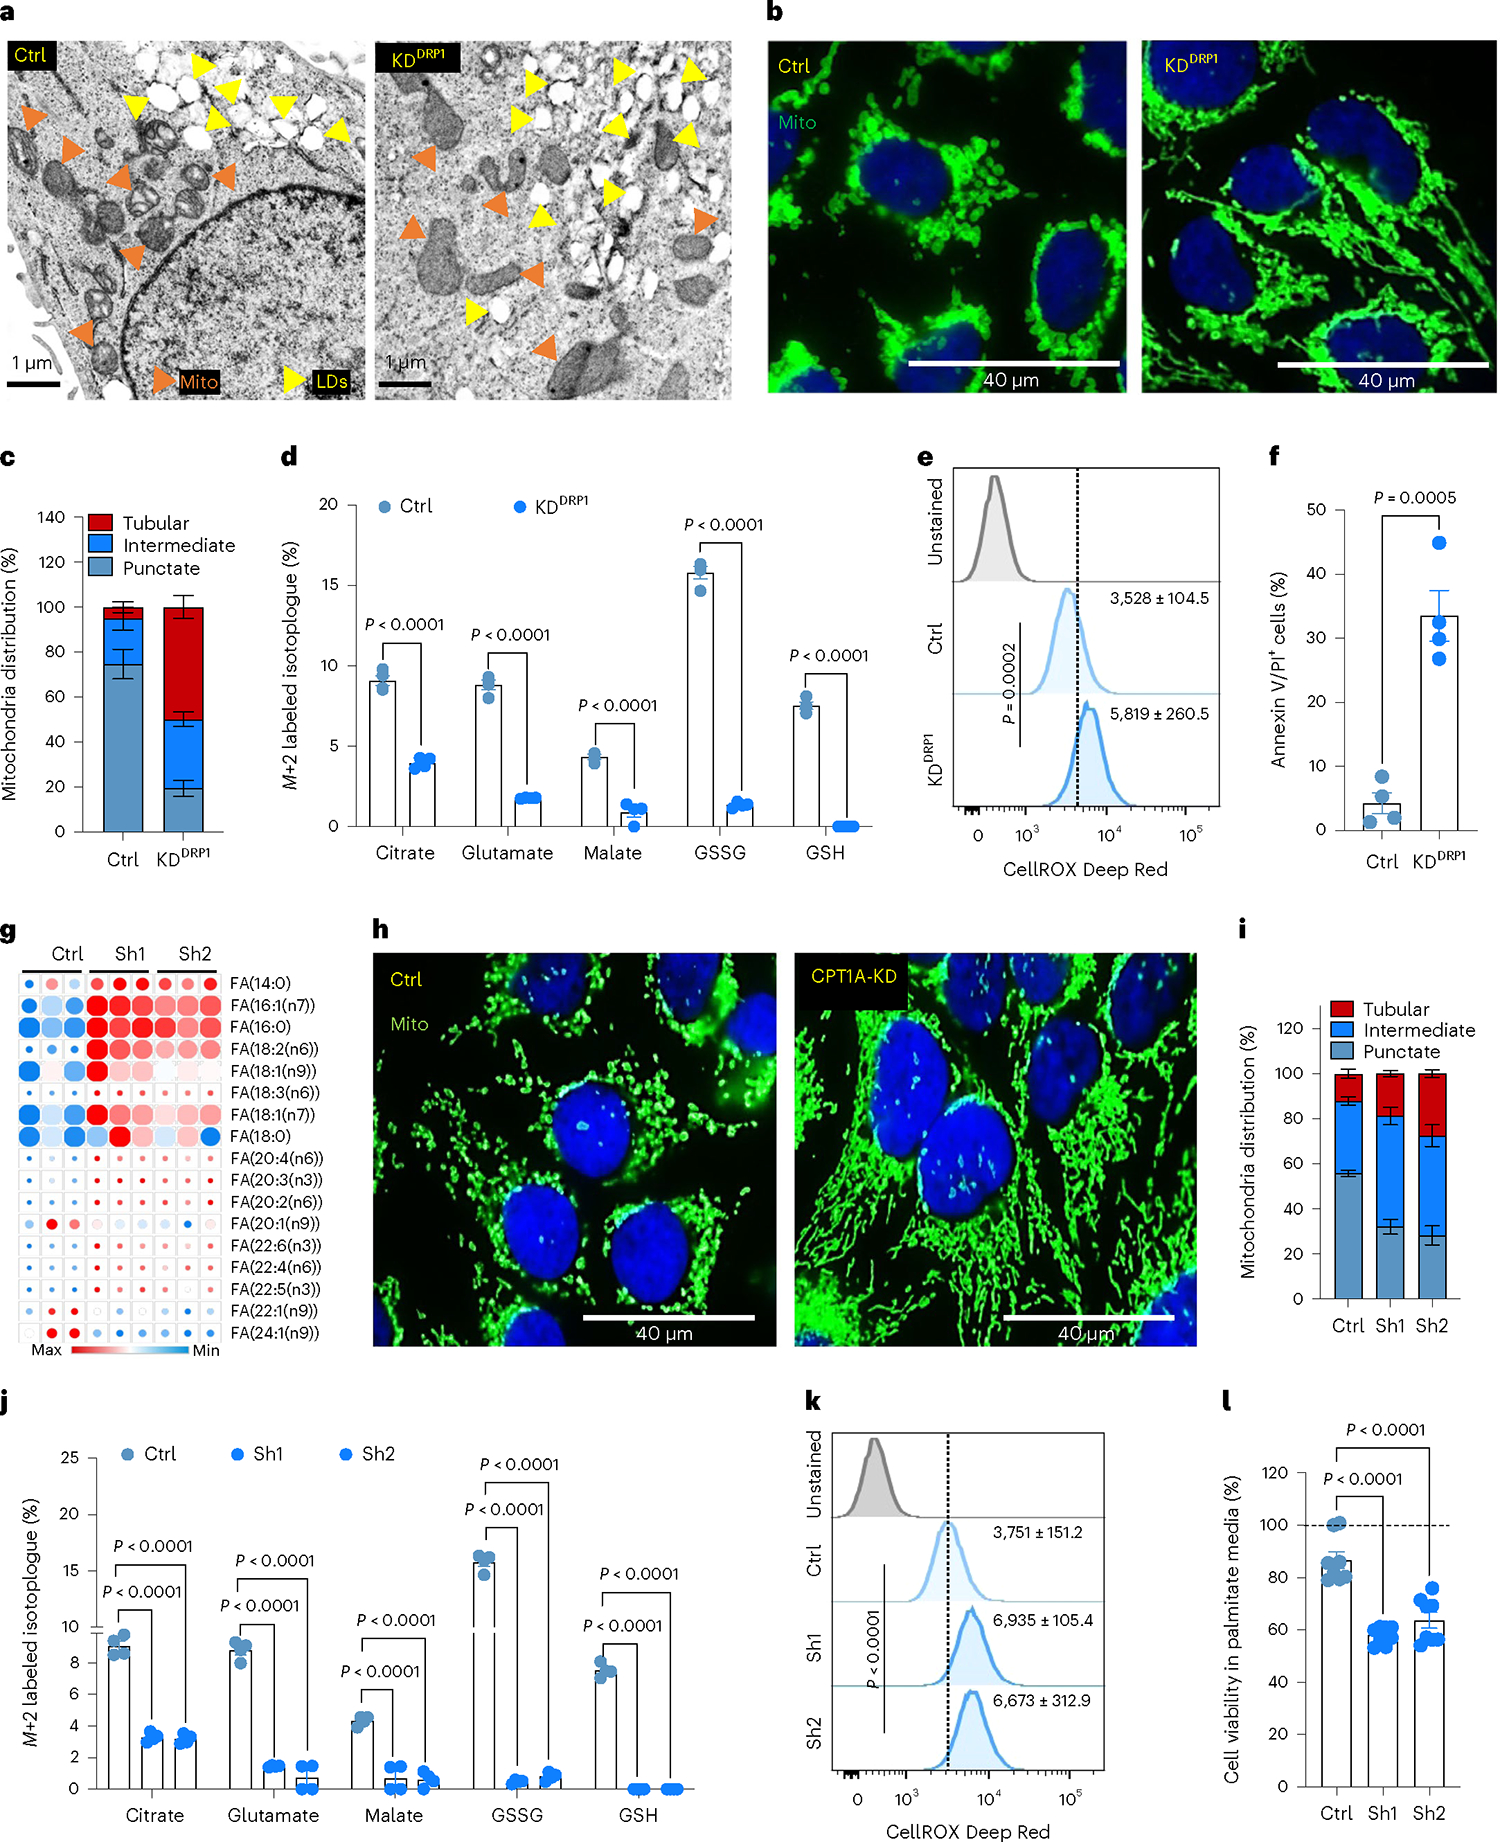
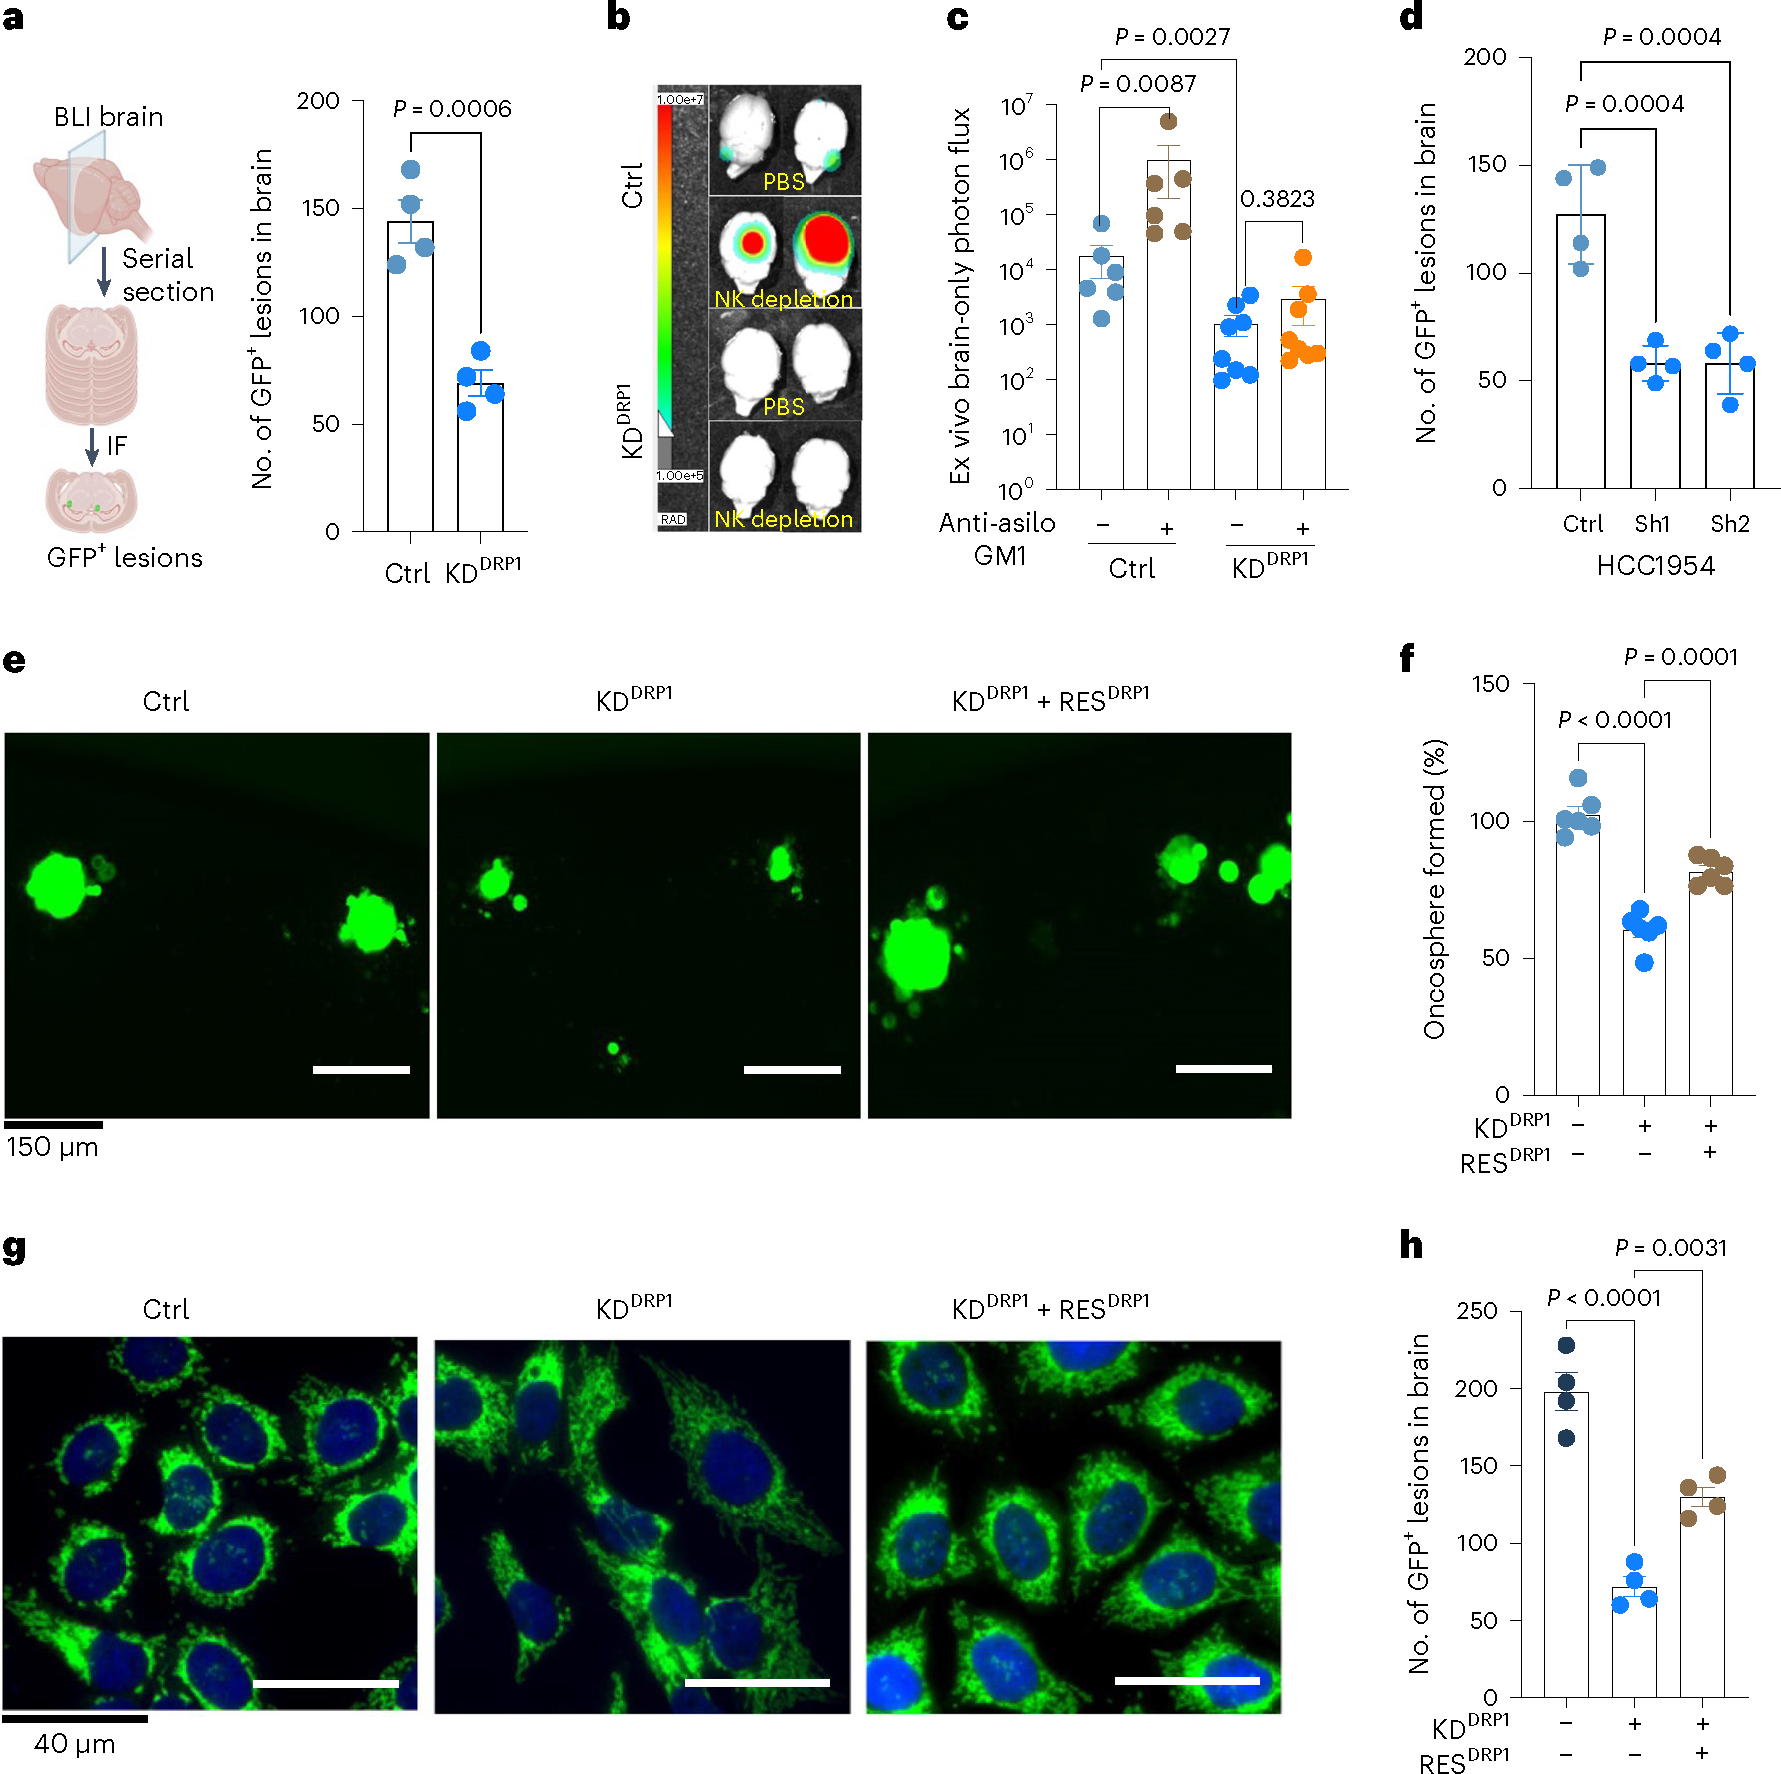
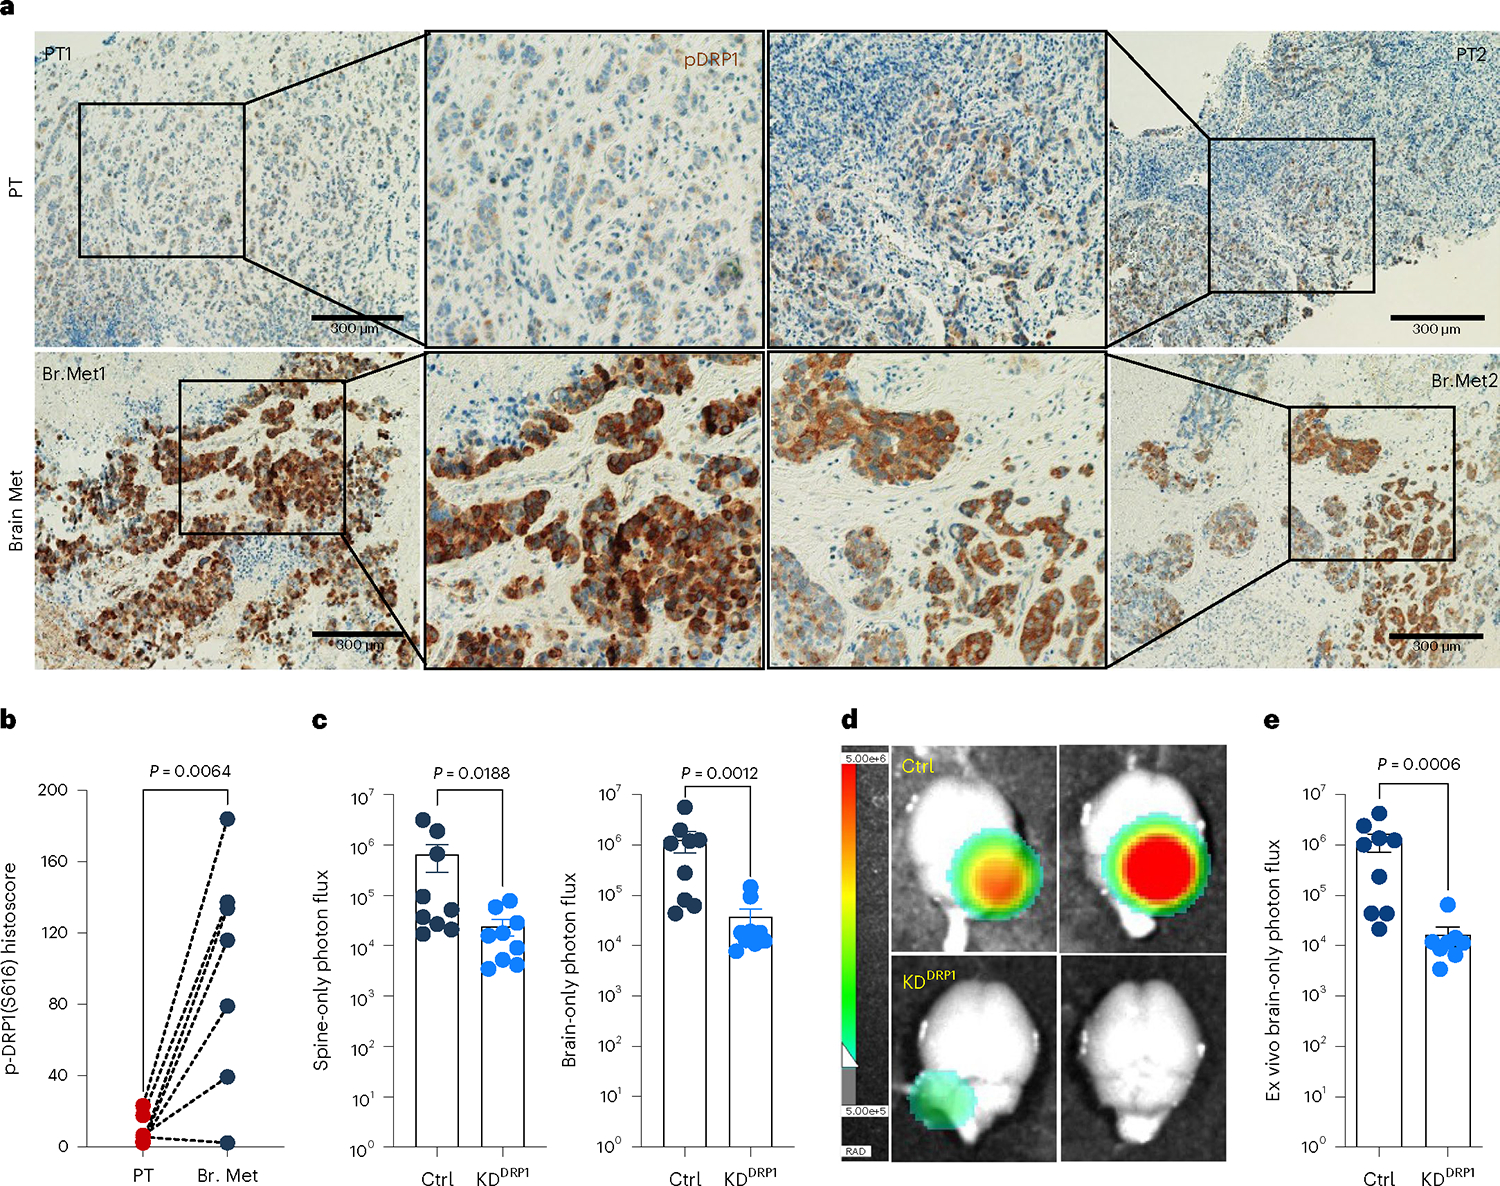
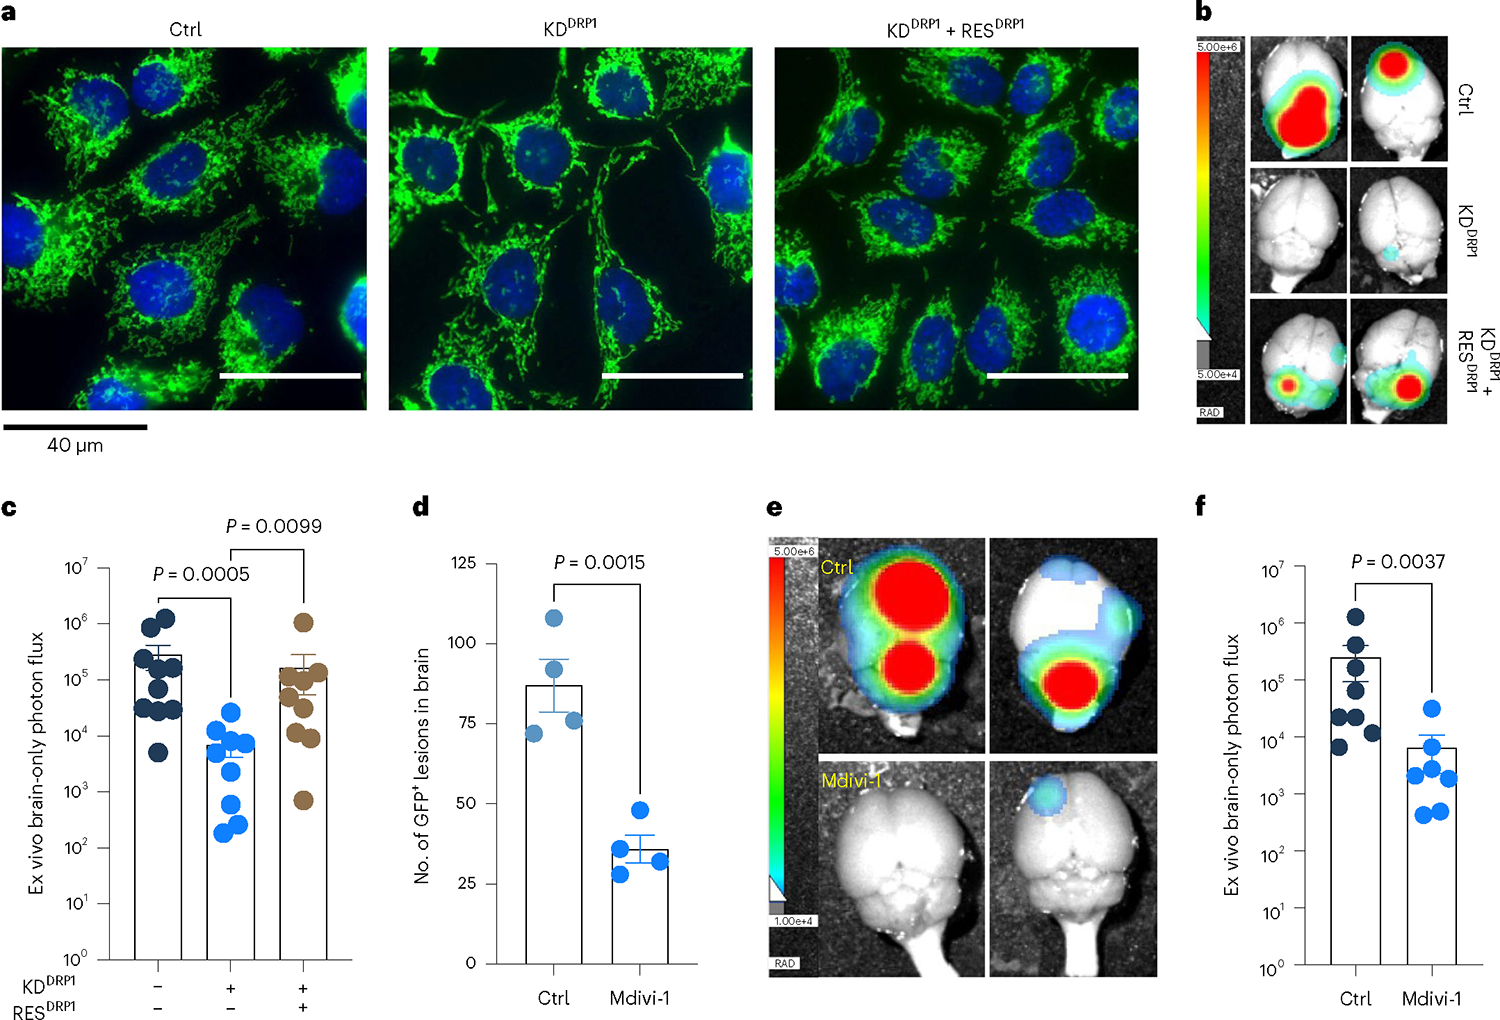
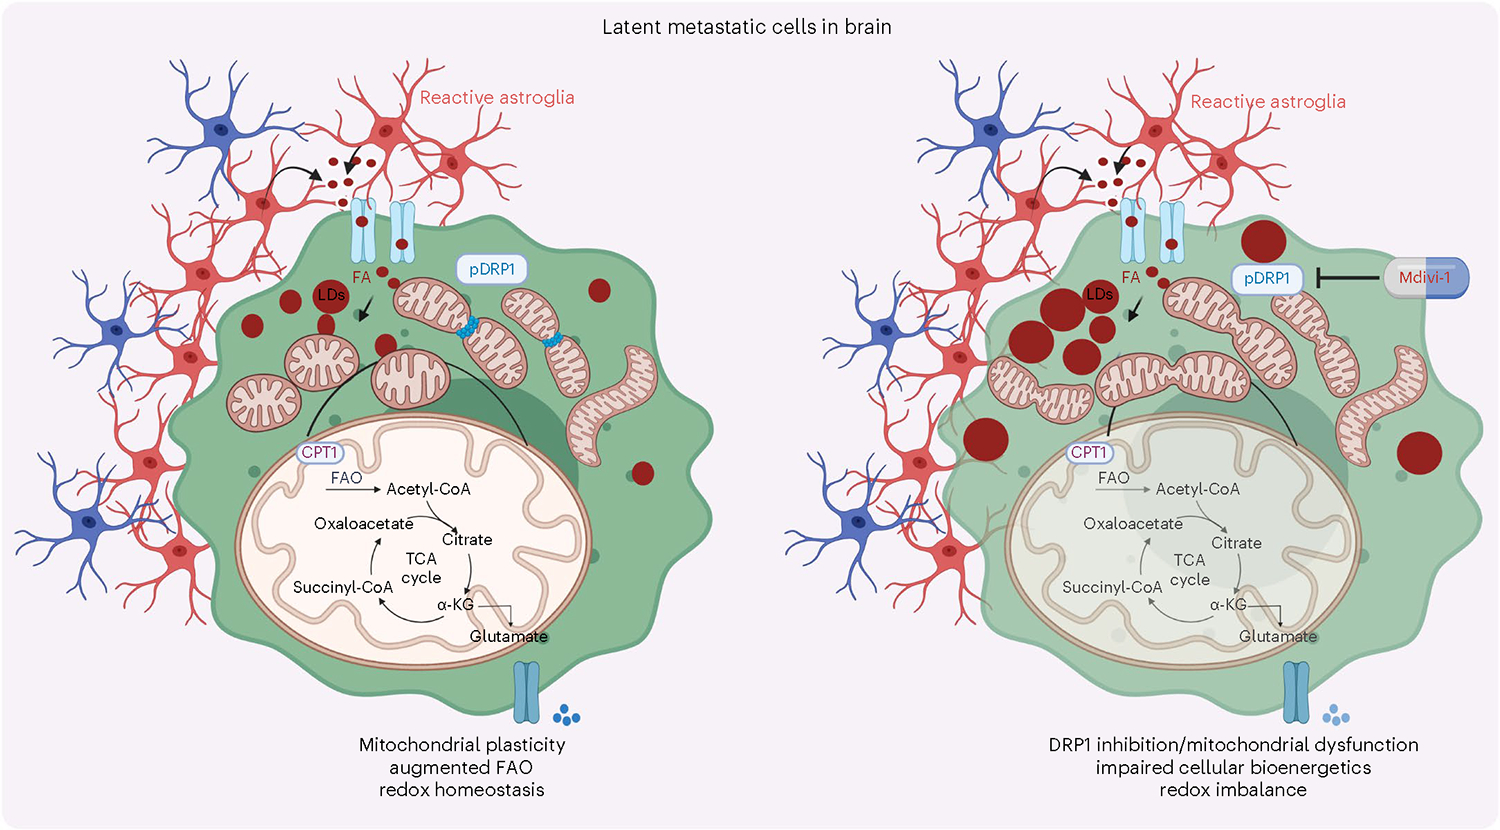
Disseminated tumor cells with metabolic flexibility to utilize available nutrients in distal organs persist, but the precise mechanisms that facilitate metabolic adaptations remain unclear. Here we show fragmented mitochondrial puncta in latent brain metastatic (Lat) cells enable fatty acid oxidation (FAO) to sustain cellular bioenergetics and maintain redox homeostasis. Depleting the enriched dynamin-related protein 1 (DRP1) and limiting mitochondrial plasticity in Lat cells results in increased lipid droplet accumulation, impaired FAO and attenuated metastasis. Likewise, pharmacological inhibition of DRP1 using a small-molecule brain-permeable inhibitor attenuated metastatic burden in preclinical models. In agreement with these findings, increased phospho-DRP1 expression was observed in metachronous brain metastasis compared with patient-matched primary tumors. Overall, our findings reveal the pivotal role of mitochondrial plasticity in supporting the survival of Lat cells and highlight the therapeutic potential of targeting cellular plasticity programs in combination with tumor-specific alterations to prevent metastatic recurrences.


Conflict of interest statement

Competing interests

A.B.H. has received research grant support from Takeda and travel support from Puma Biotechnology. C.L.A. receives or has received research grant support from Pfizer, Lilly and Takeda; holds stock options in Provista; and serves or has served in an advisory role to Novartis, Lilly, TAIHO Oncology, Daiichi Sankyo, Merck, AstraZeneca, OrigiMed, Immunomedics and Susan G. Komen Foundation. R.J.D. is a founder of Atavistik Biosciences and an advisor for Agios Pharmaceuticals, Nirogy Therapeutics and Vida Ventures. The other authors declare no competing interests.

Figures

Extended Data Fig. 1 |
Extended Data Fig. 1 |. Latent cells uptake fatty acids secreted by reactive astrocytes.
a. Showing relative difference in steady-state carnitine-conjugated fatty acids between Pa and Lat cells. n = 4, each group. Box and whiskers plot showing minima to maxima with all points. b. Heatmap showing differential expression of gene sets related to fatty acid metabolism in HCC1954 Pa and Lat cells. c. Western blots showing expression of fatty acid synthesis related enzymes FASN, ACC1 and p-ACC1S79 in HCC1954 Pa and Lat cells. d. 13C6-glucose tracing data showing the distribution of 13C-labeled even isotopologues of palmitate. n = 3, each group. e. Time-lapse confocal images showing BODIPY-558/568-C12 (Orange) transfer from astrocytes to cancer cells (green) in co-culture setting. f. Immunofluorescence images showing accumulation of LDs (red) in SKBR3 Pa and Lat cells (green) cultured with BODIPY-558/568-C12 labeled reactive astrocytes (Gray, GFAP staining). g. Bar graph showing survival of HCC1954 Pa and Lat cells cultured with astrocytes media. Percentage live/dead cells were quantified at 24 and 48 hours, n = 6, each group. h-j. Nile Red staining IF images showing lipid droplets (red) in HCC1954 and SKBR3 Pa and Lat cells treated with lauric acid, palmitic acid, and oleic acid respectively. Briefly, cells were incubated for 24 hours in R3F media and then treated with 100 μM of indicated FAs for 24 hours. Cells were fixed and stained with Nile red (2 μg/ml) for 10 min. k. IncuCyte3 time-lapse images (0,24 and 48 hours) showing lipid uptake and cell death in HCC1954 cells cultured with 2 μM of BODIPY-558/568-C12. In a, d, and g, ‘n’ represents biologically independent samples and data presented as mean + /−SEM. P value in a, d, and g were calculated by two-tailed Unpaired t-test. The experiments shown in c, e, f, and h-k were repeated independently at least two or three times with similar results.
Extended Data Fig. 2 |
Extended Data Fig. 2 |. Fragmented mitochondria puncta and LDs enriched in Latent cells.
a. IncuCyte3 data showing time dependent lipid uptake in HCC1954 Pa and Lat cells in BODIPY-558/568-C12 treated condition. Data were exported as Mean and SEM from n = 25 different fields. P value was calculated by two-tailed Paired t-test. b. Bar graph showing survival of HCC1954 Pa and Lat cells cultured with BODIPY-558/568-C12. Percentage live/dead cells were quantified at 24 and 48 hours, n = 6, each group. c. Transmission electron microscope (TEM) images showing LDs and mitochondria in SKBR3 Pa and Lat cells. SKBR3 Pa and Lat cells were cultured in MatTek dishes for 24 hours with R3F media followed by treatment of sodium palmitate(100 μM) for 24 hours before processed for TEM. d and e. IF images of HCC1954 Pa and Lat cells showing LDs (red) and mitochondria (green). Briefly, cells were treated with 100 μM lauric acid or palmitic acid for 24 hours. Cells were fixed and stained with Nile red followed by anti-TOMM20 antibody labeling was performed to visualize LDs and mitochondria respectively. f. Bar graph showing LDs, in HCC1954 Pa and Lat cells after lauric acid treatment, n = 6, each group. g. Percentage distribution of tubular, intermediate and punctate mitochondrial morphology in HCC1954 Pa and Lat cells treated with lauric acid (n = 4, each group). h. Quantification of LDs in palmitate treated HCC1954 Pa and Lat cells. n = 5, each group. i. Classification of cells based on percentage distribution of tubular, intermediate and punctate mitochondrial morphology in palmitate treated HCC1954 Pa (n = 5) and Lat (n = 6) cells. j. Western blot images showing expression of DRP1 along with p-DRP1S616and p-DRP1S637 in SKBR3 Pa and Lat cells respectively. In b and f-i, ‘n’ represents biologically independent samples and data presented as mean + /−SEM. P value in b, f, and h were calculated by two-tailed Unpaired t-test. The experiments shown in c, d, e, and j were repeated independently at least two or three times with similar results.
Extended Data Fig. 3 |
Extended Data Fig. 3 |. Latent cells oxidize internalized FAs and maintain redox homeostasis.
a. Mass spectrometry data showing DRP1 post-translational modifications including Serine phosphorylation (S616) and Lysine K10, K92, K160, K238 and K597 acetylation peaks in HCC1954 Lat cells. b. Western blots showing expression of carnitine palmitoyl-transferase 1 A (CPT1A) in HCC1954 (upper panel) and SKBR3 (lower panel) Pa and Lat cells. c and d. 13C16-Palmitic acid tracing showing enrichment of carnitine-conjugated fatty acids in HCC1954 and SKBR3 Pa and Lat cells. e-g. 13C16-Palmitic acid tracing showing labeled isotopologues of citrate, glutamate, and malate in SKBR3 Pa and Lat cells. In c-g, ‘n’ represents biologically independent samples and data presented as mean + /−SEM. P values in c-g were calculated by two-tailed Unpaired t-test. The experiments shown in b was repeated independently three times with similar results.
Extended Data Fig. 4 |
Extended Data Fig. 4 |. DRP1 promotes mitochondrial fragmentation in Latent cells.
a and b. 13C16-Palmitic acid tracing showing labeled isotopologues of GSSG and GSH in SKBR3 Pa and Lat cells. c. Measurement of steady-state GSH/GSSG ratio between Pa and Lat cells (HCC1954). a-c. n = 4, each group. d. Trypan blue exclusion assay showing viability of HCC1954 Pa and Lat cells when grown in palmitate (100 μM) for 48 hours. n = 5, each group. e. Immunofluorescence images showing localization of DRP1 to mitochondria in HCC1954 Pa and Lat cells. To visualize mitochondria Mitotracker Deep Red FM staining (500 nM, 30 min) was performed. f. Western blot images showing DRP1 and p-DRP1S616 in DRP1-depleted HCC1954 and SKBR3 Lat cells. g. Mitochondrial length quantification in Ctrl and DRP1-depleted HCC1954 Lat cells. n = 3, each group. h. Oil red O staining showing differential accumulation of LDs in Ctrl and DRP1-depleted HCC1954 Lat cells. i. Quantification of LDs in Ctrl vs DRP1 knockdown HCC1954 Lat cells upon palmitate treatment. n = 6, each group. j. Heatmap showing total fatty acid profiles of neutral lipid content generated by GC-MS in Ctrl and DRP1-KD Lat cells. Analysis was performed using 2.5×10⁵ cells in each sample and data were normalized to internal fatty acid standards. n = 3, each group (Fig. 3g and Extended Data Fig. 4j were performed in a single experiment, thus controls are same). In a-d, g, i and j, ‘n’ represents biologically independent samples, data presented as mean + /−SEM and P values were calculated by two-tailed Unpaired t-test. The experiments shown in e, f and h were repeated independently at least two or three times with similar results.
Extended Data Fig. 5 |
Extended Data Fig. 5 |. DRP1-driven mitochondrial dynamics enable FAO and redox homeostasis.
a. 13C16-Palmitic acid tracing showing enrichment of carnitine-conjugated fatty acids in DRP1-depleted HCC1954 Lat cells. b-g. LC-MS data showing enrichment of citrate, glutamate and malate isotopologues from 13C16-Palmitic acid in HCC1954 and SKBR3 Ctrl and DRP1-KD Lat cells respectively. h-k. Labeling of GSH and GSSG from 13C16-palmitate in HCC1954 and SKBR3 Lat cells (Ctrl and DRP1-KD). l. Measurement of relative steady-state GSH/GSSG ratio showing differences between Ctrl and DRP1-KD HCC1954 Lat cells (HCC1954). a-l. n = 4, each group. m. MTT assay showing cell viability of Ctrl (n = 8) and DRP1-KD (n = 8) HCC1954 Lat cells treated with palmitate(100 μM) for 48 hours (Fig. 3l and Extended Data Fig. 5m was performed in a single experiment with same control). n. Trypan blue exclusion assay showing viability of HCC1954 Pa and Lat cells grown in R3F + palmitic acid (100 μM) for 48 hours. n = 5, each group. o. Showing caspase-3 activity (Optical density at 405) in Ctrl and DRP1-depleted HCC1954 Lat cells. n = 4, each group. p and q. Oncosphere formation in Ctrl and DRP1-KD HCC1954 and SKBR3 Lat cells respectively. n = 8, each group. r. Showing the effect of treatment of N-acetyl-l-cysteine (NAC; 1 mM) on oncosphere forming ability of Ctrl and DRP1-depleted Lat cells. n = 8, each group. In a-r, ‘n’ represents biologically independent samples and data presented as mean + /−SEM. P values in a-q were calculated by two-tailed Unpaired t-test and r, was calculated by Ordinary one-way ANOVA.
Extended Data Fig. 6 |
Extended Data Fig. 6 |. CPT1A aids FAO and altered mitochondrial dynamics in Latent cells.
a. Western blots showing validation of CPT1A knockdown in HCC1954 and SKBR3 Lat cells. b. Oil red O staining images showing differential accumulation of LDs in Ctrl and CPT1A-depleted Lat cells. c. Quantification of LDs in Ctrl and CPT1A knockdown Lat cells treated with sodium palmitate (100 μM) for 24 hours, n = 6, each group. d. Western blot images showing CPT1A, DRP1 and p-DRP1S616 in CPT1A and DRP1-depleted HCC1954 Lat cells. e. 13C16-Palmitic acid tracing showing enrichment of carnitine-conjugated fatty acids in Ctrl and CPT1A-depleted (Sh1, Sh2) HCC1954 Lat cells. f-k. LC-MS data showing labeling of citrate, glutamate, and malate isotopologues from 13C16-Palmitic acid in Ctrl and CPT1A-depleted HCC1954 and SKBR3 Lat cells. (Palmitate tracing in DRP1 and CTP1A depleted cells were performed using same controls). l-o. Showing fractions of GSH and GSSG isotopologues labeled from 13C16-palmitate in Ctrl and CPT1A-depleted HCC1954 and SKBR3 Lat cells. e-o. n = 4, each group. p and q. Showing the ability of oncosphere formation in Ctrl and CPT1A-depleted HCC1954 and SKBR3 Lat cells (n = 8) respectively. r. Orthotopic tumor generated from Ctrl (n = 10) and DRP1-depleted (n = 10) Lat cells. Tumors were collected 4 weeks post injection; tumor volume and weight were measured. s. Quantification of GFP + brain metastatic lesions in SKBR3 Lat cells (Ctrl and CPT1A-depleted knockdown; n = 4, each group). t. Western blot data showing rescue of DRP1 with doxycycline inducible overexpression of HA-tagged full-length DRP1 in DRP1-depleted cells Lat cells. In c, and e-q, ‘n’ represents biologically independent samples. r and s ‘n’ represent number of tumor and number of mice respectively. c, and e-s, data presented as mean + /−SEM. P values in c, e-q and s were calculated by Ordinary one-way ANOVA and r, two-tailed Unpaired t-test was used. The experiments shown in a, b, d, and t were repeated independently at least two or three times with similar results.
Extended Data Fig. 7 |
Extended Data Fig. 7 |. DRP1 is essential for metachronous brain metastases.
a. Representative Kaplan-Meier plotter showing distant metastasis free survival for breast cancer patients with high or low expression of DNM1L (DRP1) gene. b. Western blot images showing expression of DRP1 and p-DRP1S616 in HCC1954 Pa, Lat and M-BM cells. c. Anti-TOMM20 antibody immunofluorescence images showing mitochondrial morphology of HCC1954 Pa, Lat, and M-BM cells. d. Classification of cells based on percentage distribution of tubular, intermediate and punctate mitochondrial morphology in HCC1954 Pa, Lat, and M-BM cells (n = 4, each group). e. Oncosphere formation in Ctrl and DRP1-KD HCC1954 M-BM cells. n = 8, each group. f. Showing the effect of treatment of N-acetyl-l-cysteine (NAC; 1 mM) on oncosphere forming ability of DRP1-depleted HCC1954 M-BM cells (n = 8, each group). g. Mice image with whole body photon flux showing metastatic burden in mice bearing HCC1954 Ctrl (n = 9) and DRP1(n = 9) depleted M-BM cells. h. Immunohistochemical (IHC) staining for cleaved caspase-3 (1:150, DAB, 10X) in Ctrl and DRP1-depleted M-BM cells injected mice brain section. i. Graph showing caspase-3 activity in Ctrl and DRP1-depleted HCC1954 M-BM cells. n = 4, each group. j. Orthotopic tumor generated from Ctrl and DRP1-depleted M-BM cells (n = 10, each group), post 4 weeks of cell injection. In d-f, and i, ‘n’ represents biologically independent samples, however g, and j ‘n’ represents number of mice and number of tumors respectively. In d-g, I, and j data presented as mean + /−SEM. P values in e, and j were calculated by two-tailed Unpaired t-test, f and g were calculated using Ordinary one-way ANOVA and two-tailed Mann–Whitney test respectively. The experiments shown in b, c, and h were repeated independently at least two to three times with similar results.
Extended Data Fig. 8 |
Extended Data Fig. 8 |. Ectopic expression of DRP1 rescues DRP1-depleted phenotype.
a. Showing oncosphere image and quantification in Ctrl, DRP1 knockdown and DRP1-rescued HCC1954 Lat cells (n = 6, each group). Data presented as mean + /−SEM. P values were calculated using Ordinary one-way ANOVA. b. Whole body image and photon flux showing metastatic burden in mice bearing Ctrl (n = 10), DRP1-depleted (n = 9) and DRP1-rescued (n = 9) M-BM cells. Data presented as mean + /−SEM. P value was calculated by Kruskal–Wallis test. In a ‘n’ represents biologically independent samples and b ‘n’ represents number of mice.
Extended Data Fig. 9 |
Extended Data Fig. 9 |. DRP1 inhibitors increases LDs and decreases survival of Latent and M-BM cells.
a. IF images of HCC1954 Pa, Lat, and M-BM cells with or without Mdivi-1 treatment (12.5 μM, 48 hours). b. Quantification of number of LDs between Ctrl and Mdivi-1 treated HCC1954 Pa, Lat, and M-BM (n = 5, each group) cells. c. Showing viability of HCC1954 Pa, Lat, and M-BM (n = 8, each group) cells upon Mdivi-1 treatment (0, 3.125, 6.25,12.5 and 25 μM) for 48 hours. d. IF images of SKBR3 Pa, Lat, and M-BM cells with or without Mdivi-1 treatment (12.5 μM, 48 hours). e. Quantification of number of LDs in SKBR3 Pa, Lat, and M-BM (n = 5, each group) cells after Mdivi-1 treatment. f. Showing viability of HCC1954 Pa, Lat, and M-BM (n = 8, each group) cells upon Mdivi-1 treatment (0, 3.125, 6.25,12.5 and 25 μM) for 48 hours. g. IF images of Ctrl and Dynasore treated HCC1954 Pa, Lat, and M-BM cells. h. Quantification of number of LDs in Ctrl and Dynasore treated (25 μM) HCC1954 Pa, Lat, and M-BM (n = 3, each group) cells. i. Showing viability of HCC1954 Pa, Lat, and M-BM (n = 8, each group) cells upon treatment of Dynasore (0, 5, 10,25 and 50 μM) for 48 hours. In b, c, e, f, h and i, ‘n’ represents biologically independent samples and data presented as mean + /−SEM and P values were calculated by Ordinary one-way ANOVA. The experiments shown in a, d, and g were repeated independently two times with similar results.
Extended Data Fig. 10 |
Extended Data Fig. 10 |. Pharmacologic inhibition of DRP1 attenuates brain metastasis.
a. Mice body weight comparison after treatment with vehicle (10% DMSO in corn oil, n = 7) and Mdivi-1(40 mg/kg, n = 7) for 4 weeks. Data presented as mean + /−SEM, Unpaired t-test. b and c. Mice image with whole body, spine and brain-only photon flux showing metastatic burden in mice bearing HCC1954 M-BM cells treated with vehicle (10% DMSO in corn oil, n = 8) and Mdivi-1(40 mg/kg, n = 7). Data presented as mean + /−SEM. P value was calculated by Mann–Whitney test. d and e. Bar graph showing ability of HCC1954 and SKBR3 Pa, Lat, and M-BM to form oncospheres in the presence of HER2 TKIs (lapatinib (2 μM) and tucatinib (3 μM)) and DRP1 inhibitor Mdivi-1 (5 μM) alone or in combination. ‘n’ of individual group has been provided in source data file. ‘n’ in a and c represents number of mice however in d and e it represents biologically independent samples. Dotted line indicates control. Data presented as mean + /−SEM. P values were calculated by One-way ANOVA by comparing all groups to control.
Fig. 1 |
Fig. 1 |. Latent cells uptake FAs secreted by reactive astrocytes.
a, Heatmap showing total FA profiles of neutral lipid content generated by GC–MS in HCC1954 Pa and Lat cells (n = 4, each group). b, IF image showing reactive astrocytes (GFAP+, magenta) surrounding Lat cells (GFP+, green) in mouse brain 5 weeks after intracardiac injection. c, IF image showing accumulation of LDs (red) in HCC1954 Pa and Lat cells (green) cultured with BODIPY-558/568-C12 labeled GFAP+ reactive astrocytes (gray). Scale bar, 100 μm. d, Quantification showing average LDs in Pa and Lat cells (HCC1954 and SKBR3) cultured with BODIPY-558/568-C12 labeled astrocytes for 24 h, n = 5 each group. e, Quantification showing time-dependent increase in lipid transfer from astrocytes to HCC1954 Pa and Lat cells, n = 6, each group. Isolated astrocytes from mice pups were labeled with C12-BODIPY(2 μM) for overnight and then washed three times. Next, HCC1954 Pa and Lat cells cultured in R3F were transferred to the astrocytes cultured plates and live cell imaging was performed using confocal microscope. d,e, Box and whiskers plot showing minima to maxima. with all points. f, TEM images showing LDs and mitochondria in HCC1954 Pa and Lat cells. g, Quantification of TEM image showing mitochondrial length in HCC1954 (Pa, n = 6; Lat, n = 6) and SKBR3 (Pa, n = 6; Lat, n = 5) model. h, Anti-TOMM20 antibody IF images showing mitochondrial morphology of HCC1954 Pa and Lat cells. Scale bar, 50 μm. i, Classification of cells based on percentage distribution of tubular, intermediate and punctate mitochondrial morphology in HCC1954 Lat and Pa cells. n = 8, each group. j, Western blot showing expression of DRP1 along with phosphorylated p-DRP1S616(activated form) and p-DRP1S637 (inactivated form) in HCC1954 Pa and Lat cells. In a, d, e, g and i, ‘n’ represents biologically independent samples. Data are presented in d, e, g and i as mean ± s.e.m., and P values in d, e and g were calculated by two-tailed unpaired t-test. The experiments shown in b, c, f, h and j were repeated independently at least two or three times with similar results.
Fig. 2 |
Fig. 2 |. Lat cells oxidize internalized FAs and maintain redox homeostasis.
a, Bar graph showing oxidation of 14C-palmitic acid (1μCi ml−1 and production of 14CO2 in presence of palmitic acid (100 μM), L-carnitine (1 mM) and glucose (10 mM) in Pa and Lat cells. n = 5, each group. b, Schematic illustration showing distribution of palmitate-derived carbon in TCA cycle intermediates and glutathione. Empty circles represent 12C and violet circles represent 13C (illustration was made using BioRender.com). c–g, 13C16 palmitic acid tracing showing enrichment of isotopologues of citrate (c), glutamate (d) and malate (e), GSSG (f) and GSH (g) in HCC1954 Pa and Lat cells, respectively. Briefly, cells were grown in R3F for 24 h and then treated with bovine serum albumin (BSA)-conjugated 13C16 palmitic acid (100 μM) for 24 h. Samples were collected in 80% methanol in water, and enrichment of metabolites was analyzed by LC–MS. n = 4, each group. h, Flow cytometry analysis of cellular ROS (CellROX Deep Red staining) in Pa and Lat cells (n = 8, each group). i, MTT cell viability assay showing survival of HCC1954 Pa and Lat cells (n = 6, each group) grown in palmitic acid (100 μM and 400 μM) for 48 h. j, Showing APC Annexin V/propidium iodide (PI)+ cells in HCC1954 Pa and Lat cells (n = 4, each group) treated with palmitic acid for 48 h. In a and cj, ‘n’ represents biologically independent samples. Data are presented in a and cj, as mean ± s.e.m., and P values in a and cj were calculated by two-tailed unpaired t-test.
Fig. 3 |
Fig. 3 |. DRP1-driven mitochondrial dynamics enable FAO and redox homeostasis.
a, TEM images showing LD and mitochondria in Ctrl and DRP1-depleted HCC1954 Lat cells. b, IF images highlighting altered mitochondrial dynamics in Ctrl and DRP1-KD Lat cells. c, Classification of cells based on percentage distribution of tubular, intermediate and punctate mitochondrial morphology in Ctrl (n = 5) and DRP1-KD (n = 4) HCC1954 Lat cells. d, LC–MS data showing enrichment of M+2 isotopologue of citrate, glutamate, malate, GSSG and GSH from 13C16-palmitic acid in Ctrl and DRP1-KD HCC1954 Lat cells. n = 4, each group. e, Flow cytometry analysis of cellular ROS (CellROX Deep Red staining) in Ctrl and DRP1-depleted Lat cells (n = 4, each group). f. Flow cytometry analysis showing APC Annexin V/PI+ cells in HCC1954 Ctrl and DRP1-depleted Lat cells (n = 4, each group) treated with 100 μM palmitic acid for 48 h. g, Heatmap of neutral lipids in Lat cells showing differential FA content upon CPT1A depletion in HCC1954 Lat cells (n = 3). Morpheus, Broad Institute software was used for generating heatmap. h, IF images showing mitochondrial morphology in Ctrl and CPT1A knockdown HCC1954 Lat cells. i, Quantification of mitochondrial morphology (percentage distribution of tubular, intermediate and punctate mitochondria) in Ctrl and CPT1A-depleted Lat cells, n = 5, each group. j, Labeling of M+2 isotopologue of citrate, glutamate, malate, GSSG and GSH from 13C16-palmitate in Ctrl and CPT1A-depleted HCC1954 Lat cells (13C16-palmitate tracing in DRP1 and CPT1A-depleted cells was performed in a single experimental set up with same control). n = 4, each group. k, CellROX Deep Red staining showing ROS in Ctrl and CPT1A-depleted HCC1954 Lat cells, n = 4, each group. l, MTT cell viability assay showing survival of Ctrl and CPT1A-depleted HCC954 Lat cells grown in palmitic acid (100 μM) for 48 h. n = 8, each group. In cg and il, ‘n’ represents biologically independent samples, and data are presented as mean ± s.e.m. P values were calculated by two-tailed unpaired t-test (df) or ordinary one-way ANOVA (jl). The experiments shown in a, b and h were repeated independently at least two or three times with similar results.
Fig. 4 |
Fig. 4 |. DRP1-driven mitochondrial plasticity promotes metastatic latency.
a, Brain serial section and quantification of GFP+ brain tropic latent metastatic cells/lesions in Ctrl and DRP1-depleted HCC1954 Lat cells, n = 4, each group. Illustration was made using BioRender.com. BLI, bioluminescence imaging. b,c, Ex vivo brain images and bioluminescence signal showing brain-only photon flux in Ctrl (n = 6), Ctrl+ anti-asialo-GM1(n = 6), KDDRP1 (n = 8), and KDDRP1 + anti asialo-GM1 (n = 8). Here, mice were injected with Ctrl and DRP1-depleted Lat cells, followed by vehicle or anti asialo-GM1 treatment. d, Brain serial section and quantification of GFP+ brain tropic latent metastatic cells/lesions in Ctrl and CPT1A knockdown HCC1954 Lat cells, n = 4, each group. e,f, Showing oncosphere image and quantification in Ctrl, DRP1-depleted and DRP1-rescued HCC1954 Lat cells. n = 6, each group. g, IF images showing mitochondrial morphology in Ctrl, DRP1-depleted and DRP1-rescued HCC1954 Lat cells. h, Brain serial section and quantification of GFP+ brain tropic latent metastatic cells/lesions in HCC1954 Ctrl, DRP1-depleted and DRP1-rescued Lat cells, n = 4, each group. In a, c, d, and h, ‘n’ represents the number of mice, and in f represents biologically independent samples, with data presented as mean ± s.e.m. P values were calculated by two-tailed unpaired t-test (a), two-tailed Mann–Whitney U-test (c) or ordinary one-way ANOVA (d, f, h). The experiment shown in g was repeated independently two times with similar results.
Fig. 5 |
Fig. 5 |. Phospho-DRP1 is elevated in human metachronous brain metastases.
a, IHC staining for p-DRP1S616 (1:200, DAB, 10×) in matched human HER2+ PT and metachronous brain metastases (Br. Met). b, Representative graph showing histoscore of p-DRP1S616 in HER2+ PT and matched brain metastatic samples (n = 7, each group). c, Bar graph showing spine and brain-only photon flux in mice bearing Ctrl (n = 9) and DRP1-depleted (n = 9) M-BM cells. d,e, Ex vivo brain images (d) and brain-only photon flux (e) showing metastatic burden in mice bearing Ctrl (n = 9) and DRP1-depleted (n = 8) M-BM cells. In b, ‘n’ represents number of human patients, and in c and d, ‘n’ represents number of mice. Data are presented as mean ± s.e.m. P value in b was calculated by two-tailed paired t-test, and in c and d, P values were calculated by two-tailed Mann–Whitney U-test.
Fig. 6 |
Fig. 6 |. Genetic depletion or pharmacologic inhibition of DRP1 attenuates brain metastasis.
a, IF images showing mitochondrial morphology of HCC1954 Ctrl, DRP1-depleted and DRP1-rescued M-BM cells. b,c, Ex vivo brain images (b) and brain-only photon flux (c) showing metastatic burden in mice bearing Ctrl (n = 10), DRP1-depleted (n = 9) and DRP1-rescued (n = 9) M-BM cells. d, Quantification of GFP+ brain tropic latent metastatic cells/lesions in mice bearing HCC1954 Lat cells treated with vehicle (10% DMSO in corn oil) and Mdivi-1 (40 mg kg−1) for 4 weeks (once daily). n = 4, each group. e,f, Ex vivo brain images (e) and brain-only photon flux (f) showing metastatic burden in mice bearing M-BM cells. After injection of M-BM cells, mice were treated with either vehicle (10% DMSO in corn oil, n = 8), or Mdivi-1 (40 mg kg−1, n = 7) for 4 weeks (once daily). In c, d and f, ‘n’ represents number of mice, and data are presented as mean ± s.e.m. P values in c, d and f were calculated by Kruskal–Wallis test, two-tailed unpaired t-test and two-tailed Mann–Whitney U-test, respectively. The experiment shown in a was repeated independently two times with similar results.
Fig. 7 |
Fig. 7 |. Schematic presentation highlighting the role of DRP1-driven mitochondrial plasticity and metabolic reprogramming in HER2+ breast cancer brain metastasis.
Illustration was made using BioRender.com.

Comment in

  • Feeding latent brain metastasis.
    Senft D. Senft D. Nat Rev Cancer. 2023 Aug;23(8):510. doi: 10.1038/s41568-023-00601-6. Nat Rev Cancer. 2023. PMID: 37369834 No abstract available.

References

    1. Massague J & Ganesh K Metastasis-initiating cells and ecosystems. Cancer Discov. 11, 971–994 (2021). - PMC - PubMed
    1. Kim K, Marquez-Palencia M & Malladi S Metastatic latency, a veiled threat. Front. Immunol. 10, 1836 (2019). - PMC - PubMed
    1. Faubert B et al. Metabolic reprogramming and cancer progression. Science 368, eaaw5473 (2020). - PMC - PubMed
    1. Ciminera AK, Jandial R & Termini J Metabolic advantages and vulnerabilities in brain metastases. Clin. Exp. Metastasis 34, 401–410 (2017). - PMC - PubMed
    1. Schild T, Low V, Blenis J & Gomes AP Unique metabolic adaptations dictate distal organ-specific metastatic colonization. Cancer Cell 33, 347–354 (2018). - PMC - PubMed

Publication types