. 2023 Jul;4(7):968-983.
doi: 10.1038/s43018-023-00570-7. Epub 2023 May 29.

Tumor-intrinsic sensitivity to the pro-apoptotic effects of IFN-γ is a major determinant of CD4+ CAR T-cell antitumor activity

Affiliations

Tumor-intrinsic sensitivity to the pro-apoptotic effects of IFN-γ is a major determinant of CD4+ CAR T-cell antitumor activity

Morgane Boulch et al. Nat Cancer. 2023 Jul.

Abstract

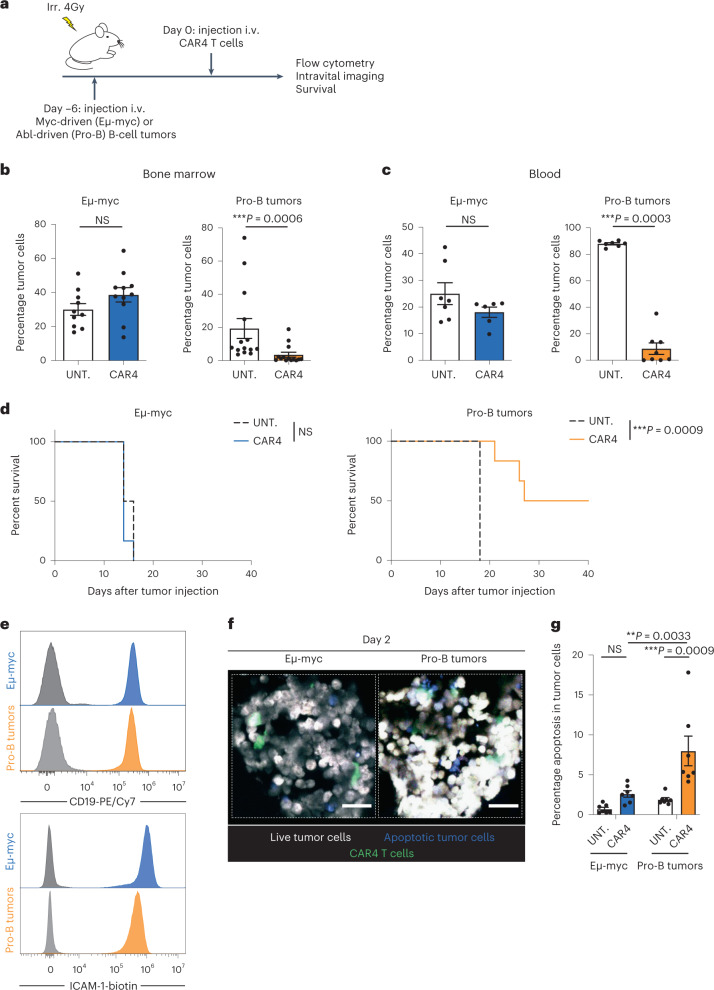
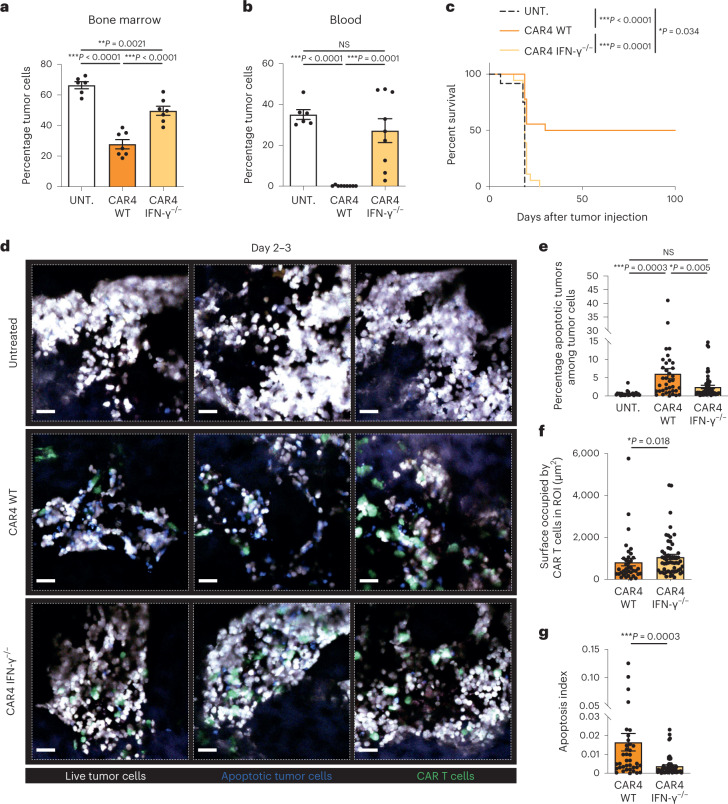
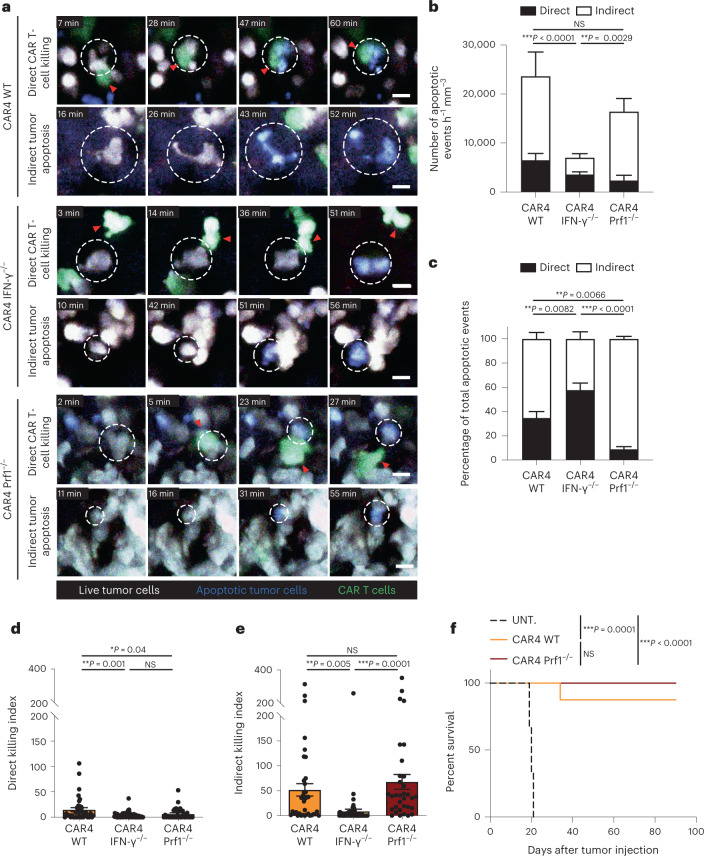
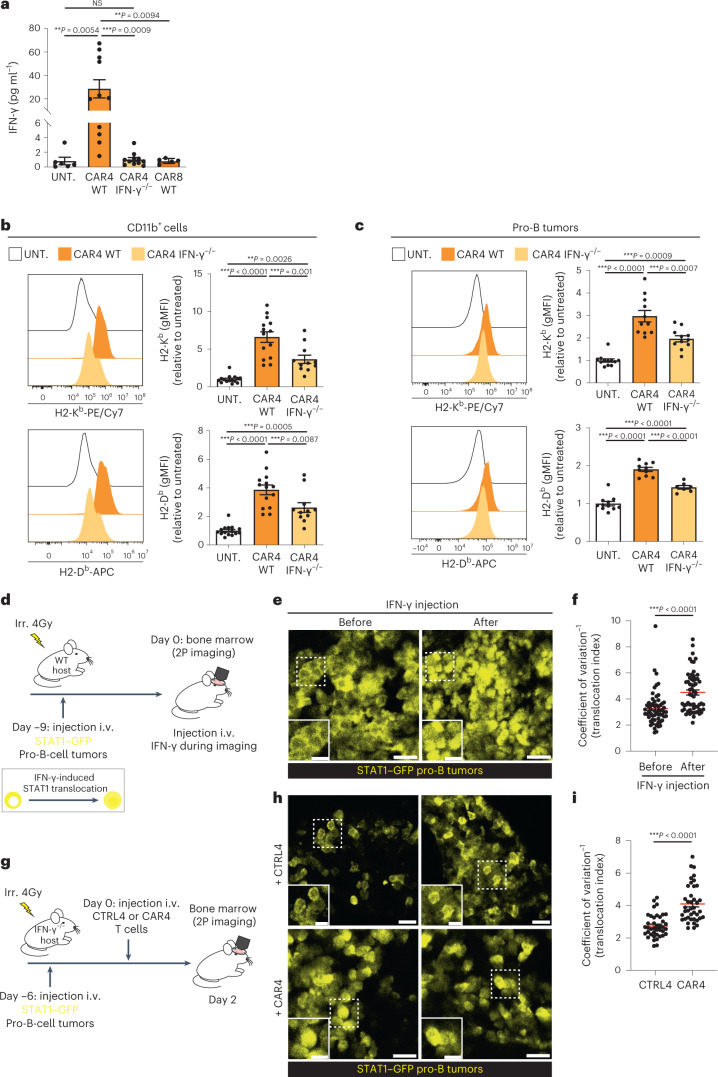
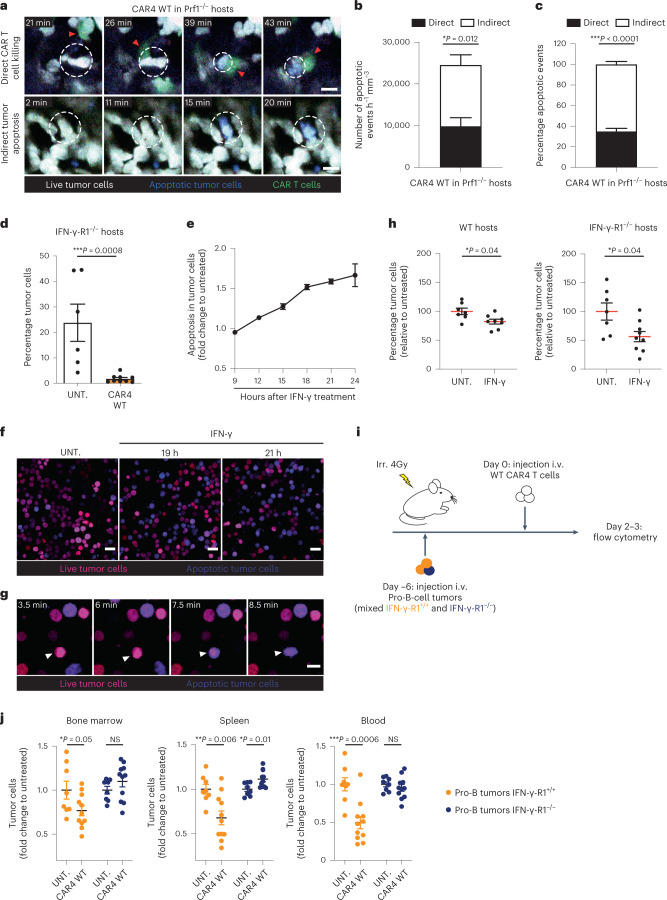
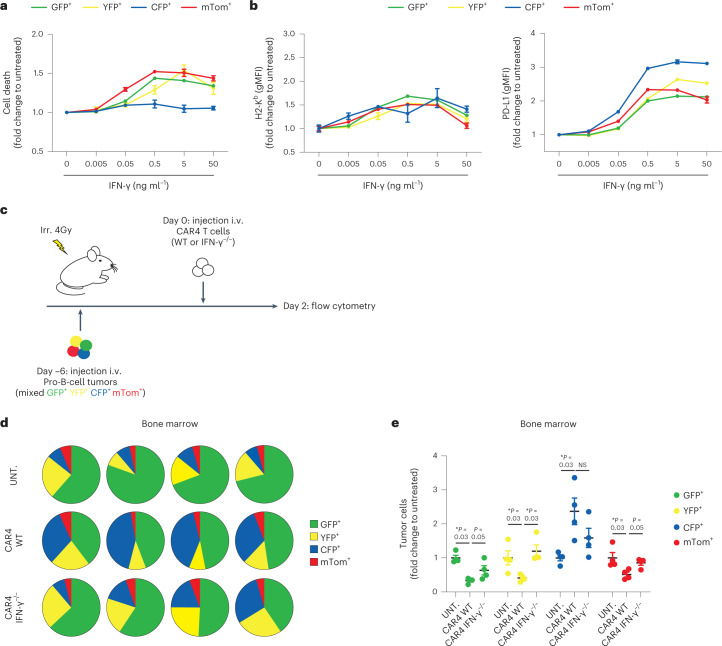
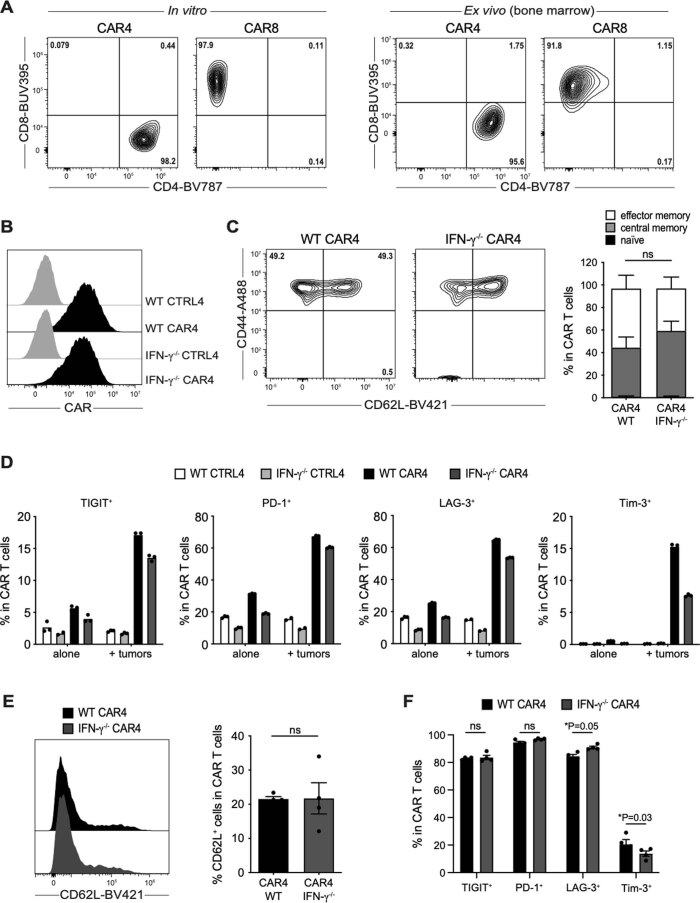
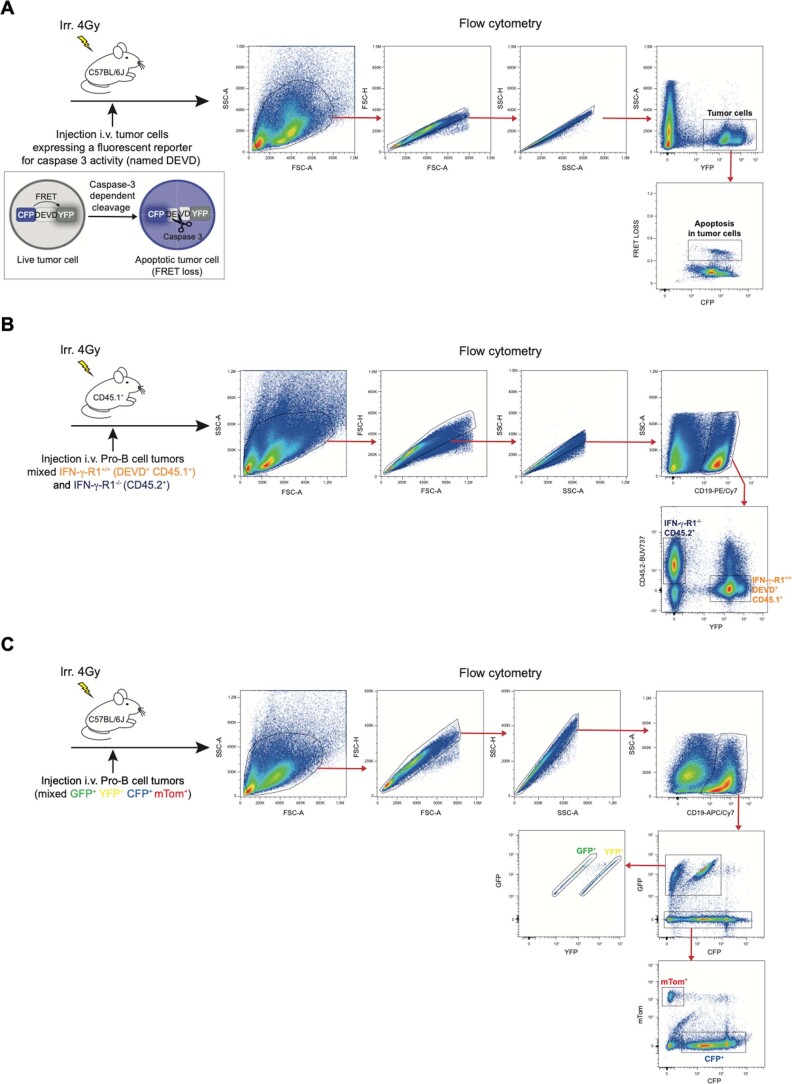
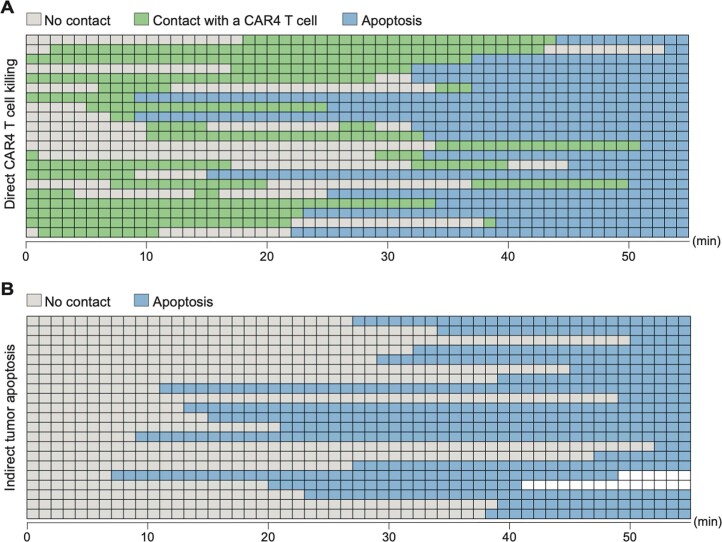
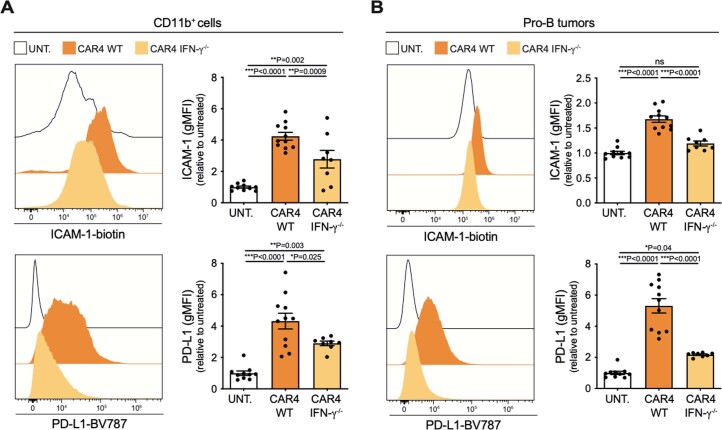
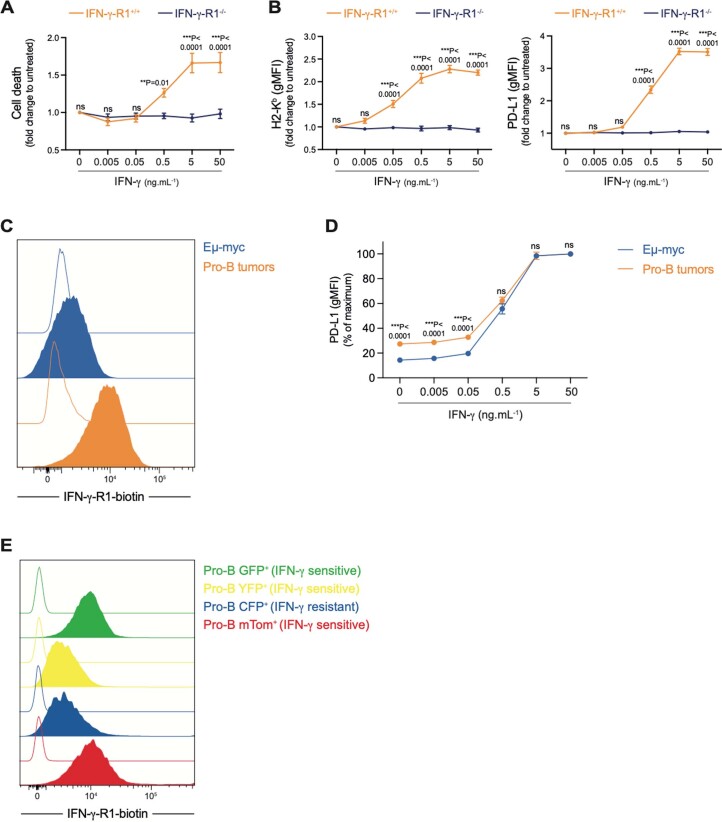
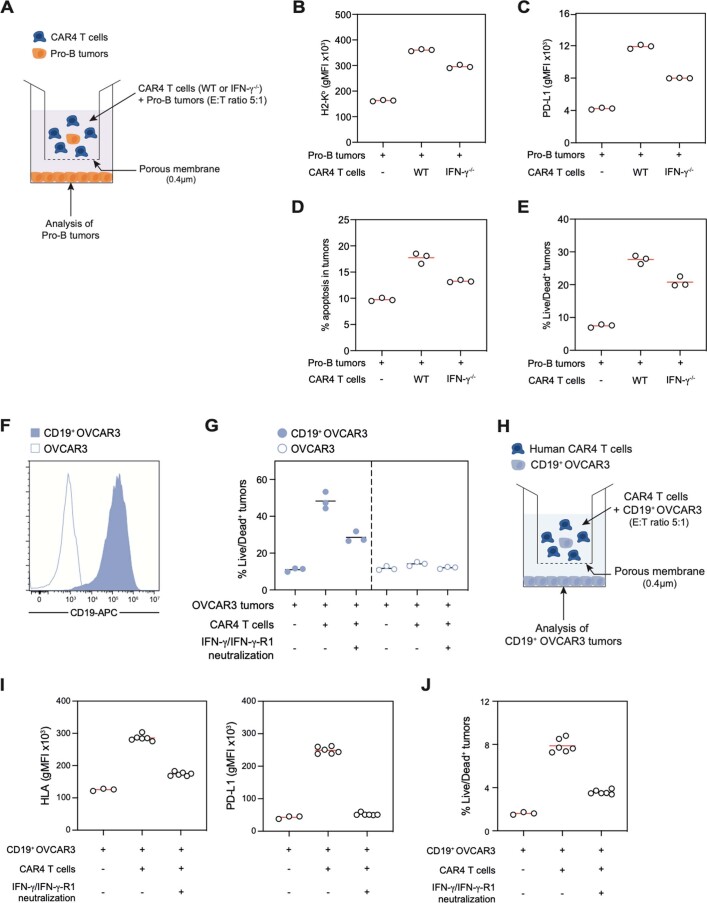
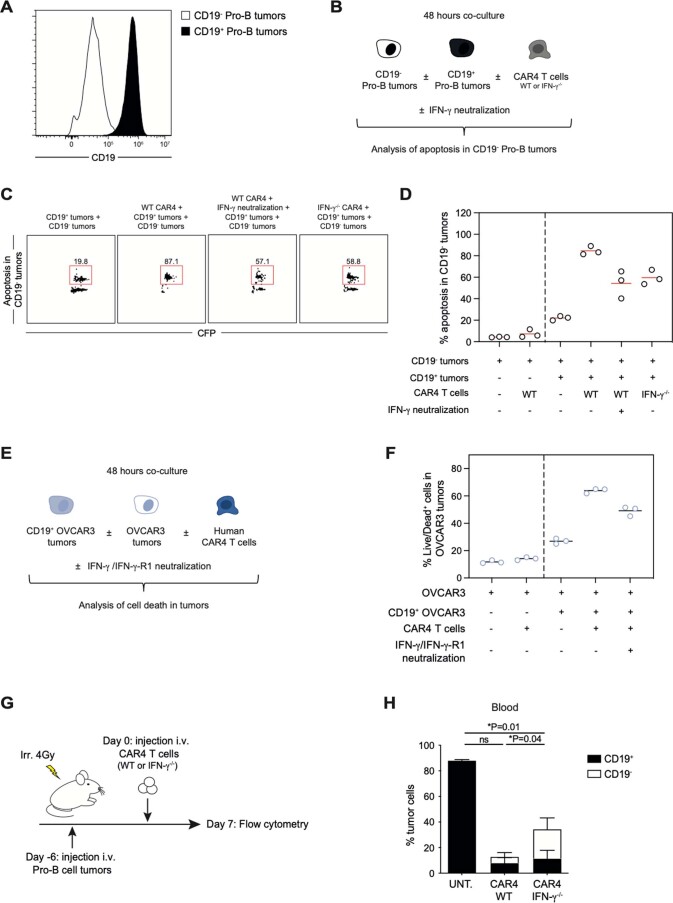
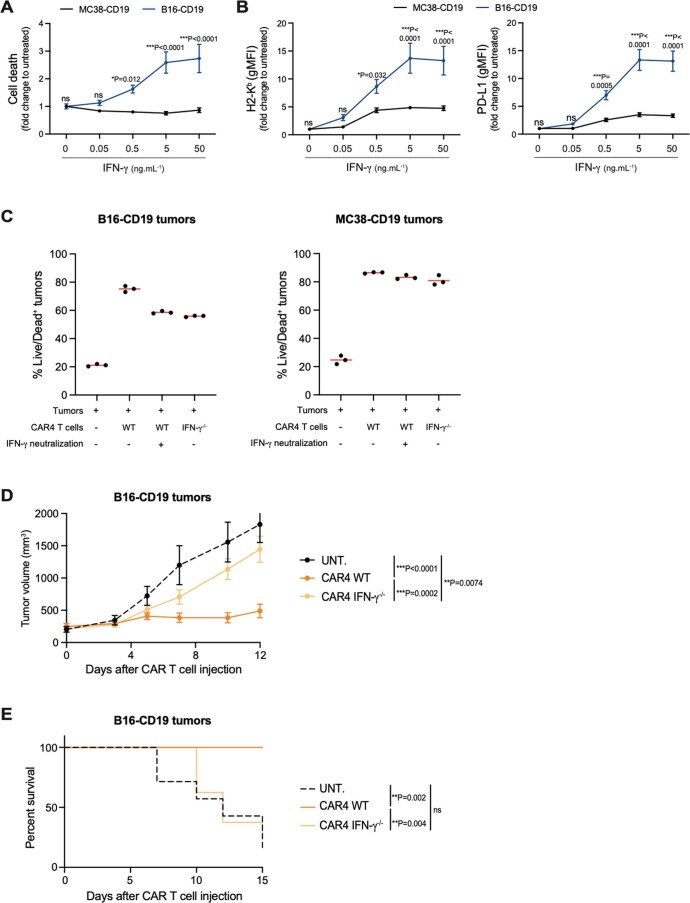
CD4+ T cells and CD4+ chimeric antigen receptor (CAR) T cells display highly variable antitumor activity in preclinical models and in patients; however, the mechanisms dictating how and when CD4+ T cells promote tumor regression are incompletely understood. With the help of functional intravital imaging, we report that interferon (IFN)-γ production but not perforin-mediated cytotoxicity was the dominant mechanism for tumor elimination by anti-CD19 CD4+ CAR T cells. Mechanistically, mouse or human CD4+ CAR T-cell-derived IFN-γ diffused extensively to act on tumor cells at distance selectively killing tumors sensitive to cytokine-induced apoptosis, including antigen-negative variants. In anti-CD19 CAR T-cell-treated patients exhibiting elevated CAR CD4:CD8 ratios, strong induction of serum IFN-γ was associated with increased survival. We propose that the sensitivity of tumor cells to the pro-apoptotic activity of IFN-γ is a major determinant of CD4+ CAR T-cell efficacy and may be considered to guide the use of CD4+ T cells during immunotherapy.


Conflict of interest statement

The authors declare no competing interests.

Figures

Fig. 1
Fig. 1. Distinct B-cell tumors exhibit differential sensitivities to CAR4 T-cell therapy.
a, In vivo experimental setup. B-cell tumors were established by intravenous (i.v.) injection of 0.5 × 106 Eμ-myc or pro-B-cell tumors expressing the FRET-based caspase 3 reporter in C57BL/6 mice after sublethal irradiation. Six days later, mice were injected intravenously with CAR4 T cells. b, Percentage of tumor cells recovered from the bone marrow 3 d after CAR4 T-cell transfer. Data are compiled from n = 3 (Eµ-myc, n = 10 untreated and n = 11 CAR4 T-cell-treated mice) or n = 4 (pro-B tumors, n = 14 untreated and n = 14 CAR4 T-cell-treated mice) independent experiments. Each dot represents one mouse. Two-tailed Mann–Whitney U-tests were used for statistical analysis. c, Percentage of tumor cells detected in the blood 7 d after CAR4 T-cell transfer. Representative of n = 2 independent experiments (for Eµ-myc, n = 7 untreated and n = 6 CAR4 T-cell-treated mice; for pro-B tumors, n = 7 untreated and n = 8 CAR4 T-cell-treated mice). Each dot represents one mouse. Two-tailed Mann–Whitney U-tests were used for statistical analysis. d, CAR4 T-cell therapy prolonged the survival of pro-B tumor- but not Eµ-myc tumor-bearing mice. Log-rank test was used for statistical analysis (n = 6 mice per group). Representative of n = 2 (Eµ-myc) or n = 4 (pro-B tumors) independent experiments. e, CD19 and ICAM-1 (CD54) expression on Eµ-myc and pro-B-cell tumors. Gray histograms represent the unstained control. f, Representative two-photon images of the bone marrow of tumor-bearing mice treated with CAR4 T cells 2 d earlier. CAR4 T cells are shown in green, live tumor cells in white, and apoptotic tumor cells in blue. Scale bars, 30 µm. Representative of n = 2 independent experiments. g, Bone marrow composition was analyzed ex vivo by flow cytometry 3 d after CAR4 T-cell transfer. Summary graphs showing the percentage of apoptotic tumor cells. Data are compiled from n = 2 independent experiments (n = 7 mice per group). Each dot represents one mouse. Two-way analysis of variance (ANOVA) and Tukey’s multiple comparisons were used for statistical analysis. Data are expressed as mean ± s.e.m. ***P < 0.001; **P < 0.01; NS, not significant. Source data
Fig. 2
Fig. 2. CAR4 T cells rely on IFN-γ to control pro-B-cell tumors.
Pro-B-cell tumors were established by intravenous injection of 0.5 × 106 Pro-B-DEVD cells in C57BL/6 mice after sublethal irradiation. Six days later, mice were injected intravenously with WT or IFN-γ−/− CAR4 T cells or left untreated. a, Percentage of tumor cells recovered from the bone marrow 3 d after the transfer of WT or IFN-γ−/− CAR4 T cells. Each dot represents one mouse (n = 6 untreated, n = 7 WT CAR4 T-cell-treated and n = 7 IFN-γ−/− CAR4 T-cell-treated mice from two independent experiments). One-way ANOVA was used for statistical analysis. b, Percentage of tumor cells detected in the blood 7 d after the transfer of WT or IFN-γ−/− CAR4 T cells. Each dot represents one mouse (n = 6 untreated, n = 9 WT CAR4 T-cell-treated and n = 9 IFN-γ−/− CAR4 T-cell-treated mice). One-way ANOVA was used for statistical analysis. c, WT CAR4 but not IFN-γ−/− CAR4 T-cell therapy prolonged mouse survival. Log-rank test was used for statistical analysis. Data are compiled from two independent experiments (n = 12 untreated, n = 18 WT CAR4 T-cell-treated and n = 18 IFN-γ−/− CAR4 T-cell-treated mice). dg, Killing activity of WT or IFN-γ-deficient CAR4 T cells was assessed by intravital imaging of the bone marrow on days 2 and 3 after CAR T-cell transfer. Representative two-photon images of the bone marrow of pro-B tumor-bearing mice treated with WT or IFN-γ−/− CAR4 T cells (d). CAR T cells are shown in green, live tumor cells in white and apoptotic tumor cells in blue. Scale bars, 30 µm. Quantification of the percentage of apoptotic tumors (ratio of the surface occupied by apoptotic tumors to the total surface occupied by tumor cells) (e) and the surface occupied by CAR T cells in the ROI (f). An apoptosis index was calculated for WT and IFN-γ−/− CAR4 T cells by normalizing the percentage of apoptotic tumors as calculated in e to the surface occupied by CAR T cells as calculated in f (g). Data shown in dg are compiled from n = 2 independent experiments. Each dot represents an individual tumor region (n = 25 tumor regions from n = 3 untreated mice, n = 37 tumor regions from n = 3 WT CAR4 T-cell-treated mice and n = 57 tumor regions from n = 4 IFN-γ−/− CAR4 T-cell-treated mice). One-way ANOVA (e) and two-tailed Mann–Whitney U-tests (f,g) were used for statistical analysis. Data are expressed as mean ± s.e.m. ***P < 0.001; **P < 0.01; *P < 0.05; NS, not significant. Source data
Fig. 3
Fig. 3. CAR4 T cells eliminate B-cell tumors using both IFN-γ-dependent and perforin-dependent mechanisms.
Pro-B-cell tumors were established in C57BL/6 mice after sublethal irradiation. Six days later, mice were injected with WT, IFN-γ−/− or Prf1−/− CAR4 T cells. a, Two-photon timelapse images showing direct and indirect tumor apoptotic events mediated by CAR4 T cells. Apoptotic events (detected by the FRET-based reporter for caspase 3 activity) were classified as direct killing when a CAR T cell contacted the target cell before FRET loss detection. Indirect events corresponded to tumor cells showing FRET loss without detectable interactions with CAR T cells. Red arrowheads show CAR T cells associated with killing. White dashed circles illustrate tumor cells undergoing apoptosis. CAR T cells are shown in green, live tumor cells in white, and apoptotic tumor cells in blue. Scale bars, 10 µm. b,c, Quantification (normalized per hour and per surface area) (b) and proportion (c) of tumor apoptotic events. A total of n = 216, n = 126 and n = 259 apoptotic events were recorded for WT, IFN-γ−/− and Prf1−/− CAR4 T cells, respectively. Two-way ANOVA and Sidak’s multiple comparisons were used for statistical analysis. d, A direct killing index was calculated as the ratio of normalized direct apoptotic events to the surface occupied by CAR T cells in each image. Each dot represents one tumor region (n = 37, n = 57, n = 33 for WT, IFN-γ−/− and Prf1−/− CAR4 T cells, respectively). One-way ANOVA and Tukey’s multiple comparisons were used for statistical analysis. e, An indirect killing index was calculated as the ratio of normalized indirect apoptotic events to the surface occupied by CAR T cells in each image. Each dot represents one tumor region. One-way ANOVA and Tukey’s multiple comparisons were used for statistical analysis. Compiled from multiple regions imaged after the transfer of WT CAR4 T cells (n = 3 mice, n = 26 h of video analyzed), IFN-γ−/− CAR4 T cells (n = 4 mice, n = 42 h of video analyzed) and Prf1−/− CAR4 T cells (n = 3 mice, n = 46 h of video analyzed) from n = 2 independent experiments. f, WT and Prf1−/− CAR4 T cells similarly prolong mouse survival. Log-rank test was used for statistical analysis (n = 6 untreated, n = 8 WT CAR4 T-cell-treated and n = 9 Prf1−/− CAR4 T-cell-treated mice). Data are expressed as mean ± s.e.m. ***P < 0.001; **P < 0.01; *P < 0.05; NS, not significant. Source data
Fig. 4
Fig. 4. CAR4 T-cell-derived IFN-γ diffuses extensively in the tumor microenvironment.
ac, Pro-B-cell tumors were established in C57BL/6 mice after sublethal irradiation. Six days later, mice were injected with the indicated population of CAR T cells. CAR4 T cells represent the major source of IFN-γ (a). Serum IFN-γ was measured 3 d after CAR T-cell transfer. Each dot represents one mouse (n = 6 untreated, n = 11 WT CAR4 T-cell-treated and n = 11 IFN-γ−/− CAR4 T-cell-treated mice from n = 3 independent experiments and n = 5 WT CAR8 T-cell-treated mice from n = 2 independent experiments). One-way ANOVA and Tukey’s multiple comparisons were used for statistical analysis. MHC class I molecule upregulation was assessed on CD11b+ myeloid cells (b) and tumor cells (c) 3 d after cell transfer. Pooled from n = 4 (n = 15 untreated, n = 14 WT CAR4 T-cell-treated and n = 11 IFN-γ−/− CAR4 T-cell-treated mice) (b) and n = 3 (n = 11 untreated, n = 10 WT CAR4 T-cell-treated and n = 7 IFN-γ−/− CAR4 T-cell-treated mice) (c) independent experiments. Each dot represents one mouse. One-way ANOVA and Tukey’s multiple comparisons were used for statistical analysis. d, Tumors were established by injection of pro-B cells expressing a STAT1–GFP reporter into C57BL/6 mice after sublethal irradiation. Nine days later, mice were subjected to intravital imaging of the bone marrow before and after the i.v. injection of IFN-γ (10 µg). 2P, two-photon. e, Two-photon images showing the nuclear translocation of STAT1 after the injection of IFN-γ. Scale bars, 20 µm. f, A translocation score was computed for tumor cells before or after IFN-γ injection. Each dot represents one cell (n = 60 cells). Two-tailed Mann–Whitney U-test was used for statistical analysis. g, Pro-B-cell tumors were established by injection of pro-B cells expressing STAT1–GFP reporter into IFN-γ−/− mice after sublethal irradiation. Mice were injected with CAR4 T cells or untransduced CD4+ T cells (CTRL4) and subjected to intravital imaging of the bone marrow 2 d later. h, Two-photon images showing the nuclear translocation of STAT1 in tumor cells upon the treatment with CAR4 T cells but not CTRL4 T cells. Scale bars, 20 µm. i, The translocation score was computed from mice treated with CTRL4 (n = 40 cells, representative of n = 5 videos) or CAR4 (n = 40 cells, representative of n = 10 videos) T cells. Each dot represents one cell. Two-tailed Mann–Whitney U-test was used for statistical analysis. Data are expressed as mean ± s.e.m. ***P < 0.001; **P < 0.01; *P < 0.05; NS, not significant. Source data
Fig. 5
Fig. 5. CAR4 T-cell-derived IFN-γ directly acts on tumor cells to promote tumor apoptosis.
ac, Pro-B-cell tumors were established in Prf1−/− mice and treated with CAR4 T cells. Two-photon timelapse images illustrating direct and indirect tumor apoptotic events (a). Scale bars, 10 µm. Quantification (normalized per hour per imaged surface) (b) and proportion (c) of direct and indirect tumor apoptotic events (n = 540 apoptotic events, n = 4 mice, n = 51.8 h of video analyzed) from n = 3 independent experiments. Two-tailed Mann–Whitney U-tests were used for statistical analysis. d, Tumor-bearing IFN-γ-R1−/− hosts were treated with CAR4 T cells or left untreated. Percentage of tumor cells recovered from the bone marrow 3 d after cell transfer. Data were compiled from n = 2 independent experiments (n = 6 untreated and n = 9 CAR4 WT-treated mice). Two-tailed Mann–Whitney U-test was used for statistical analysis. e, Pro-B-DEVD cell tumors were incubated with 50 ng ml−1 IFN-γ and cell apoptosis was assessed by flow cytometry and expressed as a fold change relative to untreated cells. Each dot represents the mean of three technical replicates (from n = 2 independent experiments). f, Pro-B-cell tumors were incubated with IFN-γ (50 ng ml−1) or left untreated and subjected to live imaging. Images showing live tumor cells (magenta) and apoptotic tumor cells (blue). Scale bars, 20 μm. g, Images highlighting a pro-B-cell tumor undergoing apoptosis after 19 h of incubation with IFN-γ. Scale bar, 10 μm. Images are representative of n = 2 independent experiments. h, Tumor-bearing WT (left) and IFN-γ-R1−/− (right) recipients were injected twice with 10 µg IFN-γ 24 h apart. Percentage of tumor cells (relative to untreated mice) in the bone marrow 2 d after the first IFN-γ injection. Data were compiled from n = 2 independent experiments (WT hosts, n = 7 untreated and n = 8 IFN-γ treated mice; IFN-γ-R1−/− hosts, n = 7 untreated and n = 9 IFN-γ treated mice). Two-tailed Mann–Whitney U-tests were used for statistical analysis. i, Tumors were established in CD45.1+ mice by injection of a mixture of CD45.1+ IFN-γ-R1+/+ and CD45.2+ IFN-γ-R1−/− pro-B cells. Six days later, mice were injected with CAR4 T cells. j, Tumor load (relative to untreated mice) was analyzed in the bone marrow (left), spleen (middle) and blood (right) 2–3 d after injection of CAR4 T cells. Data were compiled from n = 3 independent experiments. Each dot represents one mouse (n = 8 untreated and n = 11 CAR4 WT-treated mice). Two-tailed unpaired t-tests were used for statistical analysis. Data are expressed as mean ± s.e.m. ***P < 0.001; **P < 0.01; *P < 0.05; NS, not significant. Source data
Fig. 6
Fig. 6. CAR4 T cells selectively eliminate IFN-γ-sensitive tumor cells.
a,b, Impact of IFN-γ on different pro-B-cell tumors in vitro. Distinct, independently generated, pro-B-cell tumors were incubated with the indicated IFN-γ concentrations in vitro for 24 h. Cell death was assessed using Fixable Viability Dye (Zombie NIR) and expressed as a fold change relative to untreated cells (a). Each dot represents the mean of three technical replicates. IFN-γ induces phenotypic changes in all pro-B-cell tumors in vitro (b). Pro-B-cell tumors were incubated with the indicated IFN-γ concentrations in vitro for 24 h. H2-Kb (left) and PD-L1 (right) surface expression was then analyzed by flow cytometry. Each dot represents the mean of three technical replicates. gMFI, geometric mean fluorescence intensity. c, In vivo experimental setup. Pro-B-cell tumors were established by intravenous injection of 0.8 × 106 of color-coded pro-B cells (1:1:1:1 ratio of a mix of CFP+GFP+YFP+mTom+ pro-B cells) in C57BL/6 mice after sublethal irradiation. Six days later, mice were injected intravenously with WT or IFN-γ−/− CAR4 T cells. Two days after CAR T-cell transfer, bone marrow cells were processed using flow cytometry. d, Pie charts showing the distribution of individual colored pro-B tumors in the bone marrow two days after injection of CAR4 T cells. Each pie chart represents one mouse. e, Tumor cellular composition (fold change relative to untreated mice) was analyzed in the bone marrow 2 d after injection of CAR4 T cells. Each dot represents one mouse. Two-tailed Mann–Whitney U-tests were used for statistical analysis. Data shown in ae are representative of n = 2 independent experiments (n = 4 mice per group). Data are expressed as mean ± s.e.m. *P < 0.05; NS, not significant. Source data
Fig. 7
Fig. 7. High IFN-γ induction is associated with improved survival in patients with DLBCL exhibiting high CAR4:CAR8 T-cell ratios.
A cohort of patients with DLBCL (n = 63) treated with anti-CD19 CAR T cells at Saint-Louis Hospital (Paris) was analyzed for CAR4:CAR8 T-cell ratio in the blood (day 7 after CAR T-cell transfer) and for IFN-γ concentration in the serum (day 0 and day 7 after CAR T-cell transfer). a, Distribution of the CAR4:CAR8 T-cell ratios in the blood of treated patients. Each dot represents one patient (n = 63). Red dashed bar represents the median (1.31). b, Stronger IFN-γ induction in patients with high CAR4:CAR8 ratios. Scatter-plot showing the serum concentration of IFN-γ (expressed as a fold change relative to the baseline concentration measured at day 0) as a function of the ratio of CD4+ and CD8+ CAR T cells. Each dot represents one patient (n = 63). Red bars represent the median. Two-tailed Mann–Whitney U-test was used for statistical analysis and associated P value is shown. c, Induction of IFN-γ correlates with improved clinical outcome in patients with high CAR4:CAR8 ratios. Kaplan–Meier curves showing 1-year estimates of PFS (top) and OS (bottom) for patients displaying high (above the median) CAR4:CAR8 ratios (left) or low (below the median) CAR4:CAR8 ratios (right) as a function of IFN-γ induction. The median of IFN-γ induction (7.72 for patients with high CAR4:CAR8 ratios and 2.16 for patients with low CAR4:CAR8 ratios) was used to discriminate patients with low IFN-γ or high IFN-γ. Log-rank tests were used for statistical analysis and P values are shown. Source data
Extended Data Fig. 1
Extended Data Fig. 1. In vitro and ex vivo phenotyping of CAR T cells.
(a) CD4 and CD8 surface expression by CAR4 and CAR8 T cells (representative of n = 6 independent experiments). (b) CAR expression by WT and IFN-γ−/− CD4+ T cells (representative of n = 8 independent experiments). CTRL4, untransduced control CD4+ T cells. (c) Representative FACS plot (left) and bar graphs (right) showing the percentage of effector/effector memory (CD44+ CD62L), central memory (CD44+ CD62L+) and naive T cells (CD44 CD62L+) in WT and IFN-γ−/− CAR4 T cells (pooled from n = 3 independent experiments). Two-way ANOVA and Sidak’s multiple comparisons were used for statistical analysis. (d) Percentage of TIGIT, PD-1, LAG-3 and Tim-3 positive cells in WT and IFN-γ−/− CAR4 T cells and their untransduced counterparts (CTRL4) after co-culture (or not) with pro-B-DEVD tumors at 1:1 effector-to-target ratio for 24 hours. Each dot represents one technical replicate (n = 1 experiment). (e, f) Ex vivo analysis of CAR4 T cells recovered from the bone marrow of pro-B-cell tumor-bearing mice 3 days after the treatment with WT or IFN-γ−/− CAR4 T cells (10 × 106). (e) Representative histograms (left) and bar graphs (right) showing the percentage of CD62L expressing cells in WT and IFN-γ−/− CAR4 T cells. Each dot represents one mouse (n = 4 mice per group). Two-tailed Mann-Whitney U-test was used for statistical analysis. (f) Percentage of TIGIT, PD-1, LAG-3 and Tim-3 positive cells in WT and IFN-γ−/− CAR4 T cells recovered from the bone marrow 3 days after their transfer. Each dot represents one mouse (n = 4 mice per group). Two-way ANOVA and Sidak’s multiple comparisons were used for statistical analysis. Data are expressed as mean ± SEM. *P<0.05; ns, not significant. Source data
Extended Data Fig. 2
Extended Data Fig. 2. Gating strategies for flow cytometry identification of pro-B-cell tumors.
(a) Gating strategy for identifying pro-B-cell tumors expressing the FRET-based caspase 3 reporter (named DEVD) and tumor apoptosis in the bone marrow of tumor-bearing mice. CFP and YFP are linked by the target peptide DEVD, which is cleaved upon caspase 3 activation, resulting in loss of FRET in apoptotic cells. (b) Gating strategy for identifying CD45.1+ IFN-γ-R1+/+ and CD45.2+ IFN-γ-R1−/− pro-B-cell tumors in the bone marrow of tumor-bearing mice. (c) Gating strategy for identifying CFP+, GFP+, YFP+ and mTom+ pro-B-cell tumors in the bone marrow of tumor-bearing mice.
Extended Data Fig. 3
Extended Data Fig. 3. Kinetics of tumor apoptotic events mediated by CAR4 T cells.
Pro-B-cell tumors were established by intravenous injection of 0.5 × 10⁶ pro-B-DEVD tumor cells in C57BL/6 mice after sublethal irradiation. Six days later, mice were injected intravenously with WT CAR4 T cells and subjected to intravital two-photon imaging of the bone marrow. Apoptotic events (detected by the genetically-encoded FRET-based reporter for caspase 3 activity) were classified as direct killing when a CAR T cell engaged the target cell before FRET loss detection. Indirect events corresponded to tumor cells undergoing FRET loss without any apparent interactions with a CAR T cell. (a) Kinetics of direct CAR4 T cell-mediated killing events. (b) Kinetics of indirect tumor apoptotic events. Each line (n = 21) represents an individual tumor cell undergoing apoptosis during the imaging period. Gray squares represent periods without contact, green squares represent periods during which tumor cells are contacting a CAR4 T cell and blue squares represent periods during which tumor cells appear apoptotic. Data are representative of n = 26 hours of movie analyzed, from n = 3 mice from n = 3 independent experiments.
Extended Data Fig. 4
Extended Data Fig. 4. Role of IFN-γ production for the activity of CAR4 and CAR8 T cells.
(a-f) In vitro quantification of CAR4 T cell cytotoxic activity. (a) Pro-B-DEVD tumors were co-cultured with WT CAR4 T cells at 1:1 effector-to-target ratio or left untreated for 24 hours. When indicated, TRAIL and FasL were neutralized using a blocking antibody. Tumor cell death was assessed using fixable viability dye (Zombie NIR). Each dot represents one technical replicate. Data are representative of n = 2 independent experiments. (b, c) Pro-B-DEVD tumors were co-cultured with WT, IFN-γ−/− or Prf1−/− CAR4 T cells at 1:1 effector-to-target ratio or left untreated for 24 hours. (b) Tumor cell apoptosis was assessed using the FRET-based caspase 3 reporter. (c) Tumor cell death was assessed using fixable viability dye (Zombie NIR) and normalized to untreated tumor cells. (b–c) Each dot represents one technical replicate from n = 2 independent experiments for Prf1−/− CAR4 T cells and n = 3 independent experiments for WT and IFN-γ−/− CAR4 T cells. One-way ANOVA and Holm-Sidak’s multiple comparisons were used for statistical analysis. (d) Representative histograms of IFN-γ-R1 expression by WT (white) and CRISPR/Cas9 edited pro-B-cell tumors (black). (e) Functional validation of CRISPR/Cas9-mediated deletion of IFN-γ-R1 on pro-B-cell tumors. Pro-B-cell tumors were incubated with the indicated IFN-γ concentrations in vitro for 24 hours. H2-Kb surface expression analyzed by flow cytometry and expressed as a fold change relative to untreated cells. Each dot represents the mean of 3 technical replicates (n = 1 experiment). gMFI, geometric mean fluorescence intensity. (f) IFN-γ-R1−/− pro-B-cell tumors were co-cultured with WT or IFN-γ−/− CAR4 T cells at 1:1 effector-to-target ratio. Tumor cell death was assessed using fixable viability dye (Zombie NIR) and normalized to untreated tumor cells. Each dot represents one technical replicate (n = 1 experiment). (g) In vivo experimental setup. Pro-B-cell tumors were established by intravenous injection of 0.5 × 10⁶ of pro-B cells expressing the FRET-based caspase 3 reporter in IFN-γ−/− mice after sublethal irradiation. Six days later, mice were injected intravenously with WT or IFN-γ−/− CAR4 T cells. Three days after CAR T cell transfer, bone marrow cells were processed using flow cytometry. (h, i) CAR4 T cell-derived IFN-γ increases H2-Kb and PD-L1 levels in tumor and tumor-infiltrating immune cells. Surface expression of H2-Kb (left) and PD-L1 (right) was assessed on CD11b+ myeloid cells (H) and tumor cells (I). gMFI, geometric mean fluorescence intensity. Each dot represents one mouse (n = 4 mice per group from n = 1 experiment). One-way ANOVA, Tukey’s and Holm-Sidak’s multiple comparisons were used for statistical analysis. (j) Percentage of tumor cells recovered from the bone marrow. Each dot represents one mouse (n = 4 mice per group from n = 1 experiment). One-way ANOVA and Holm-Sidak’s multiple comparisons were used for statistical analysis. (k) In vitro quantification of CAR8 T cell cytotoxic activity. Pro-B-DEVD tumors were co-cultured with WT, IFN-γ−/− or Prf1−/− CAR8 T cells or untransduced control CD8+ T cells (CTRL8) at 1:1 effector-to-target ratio for 24 hours. Tumor cell death was assessed using fixable viability dye (Zombie NIR). Each dot represents one technical replicate (n = 1 experiment). (l) Pro-B-cell tumors were established by intravenous injection of 0.5 × 10⁶ pro-B-DEVD cells in C57BL/6 mice after sublethal irradiation. Six days later, mice were injected intravenously with WT or IFN-γ−/− CAR8 T cells. (m) Percentage of tumor cells recovered from the bone marrow 3 days after the transfer of CAR8 T cells. Each dot represents one mouse (n = 11 untreated and n = 10 WT CAR8 T cell-treated mice from n = 3 independent experiments, n = 7 IFN-γ−/− CAR8 T cell-treated mice from n = 2 independent experiments). One-way ANOVA and Tukey’s multiple comparisons were used for statistical analysis. Data are expressed as mean ± SEM. ***P<0.001; **P<0.01; *P<0.05; ns, not significant. Source data
Extended Data Fig. 5
Extended Data Fig. 5. CAR4 T cells induce upregulation of ICAM-1 and PD-L1 molecules on both immune and tumor cells in the tumor microenvironment.
Pro-B-cell tumors were established by intravenous injection of 0.5 × 10⁶ pro-B-DEVD cells in C57BL/6 mice after sublethal irradiation. Six days later, mice were injected intravenously with WT or IFN-γ−/− CAR4 T cells (5–10 × 106). (a–b) CAR4 T cell-derived IFN-γ induces ICAM-1 and PD-L1 upregulation in both tumor and tumor-infiltrating immune cells. Bone marrow cells were analyzed using flow cytometry 3 days after CAR T cell transfer. Surface expression of ICAM-1 and PD-L1 was assessed on CD11b+ myeloid (A) and tumor cells (B). gMFI, geometric mean fluorescence intensity. Each dot represents one mouse (n = 10 untreated and n = 11 WT CAR4 T cell-treated mice from n = 3 independent experiments, n = 8 IFN-γ−/− CAR4 T cell-treated mice from n = 2 independent experiments). One-way ANOVA and Tukey’s multiple comparisons were used for statistical analysis. Data are expressed as mean ± SEM. ***P<0.001; **P<0.01; *P<0.05; ns, not significant. Source data
Extended Data Fig. 6
Extended Data Fig. 6. IFN-γ induces caspase 3 activation in pro-B cell tumors.
(a, b) Pro-B cell tumors were incubated with IFN-γ (0.5 or 50 ng.mL−1) for 24 hours or left untreated. (a) Representative FACS plot and (B) bar graphs of cell death assessed using fixable viability dye (eFluor 780, eBioscience) and intracellular staining of activated caspase 3. Each dot represents one technical replicate (n = 1 experiment). Source data
Extended Data Fig. 7
Extended Data Fig. 7. IFN-γ-R1 expression in the various B cell tumors.
(a–b) Validation of IFN-γ-R1−/− pro-B cell tumors. (a) Impact of IFN-γ-induced cell death on IFN-γ-R1+/+ and IFN-γ-R1−/− pro-B cell tumors in vitro. Pro-B cell tumors were incubated with the indicated IFN-γ concentrations in vitro for 24 hours. Cell death was then assessed using fixable viability dye (Zombie NIR) and expressed as a fold change relative to untreated cells. (b) Pro-B cell tumors were incubated with the indicated IFN-γ concentrations in vitro for 24 hours. H2-Kb (left) and PD-L1 (right) surface expression was then analyzed by flow cytometry and expressed as a fold change relative to untreated cells. gMFI, geometric mean fluorescence intensity. (a, b) Data are pooled from n = 4 independent experiments. Two-way ANOVA and Sidak’s multiple comparisons were used for statistical analysis. (c) IFN-γ-R1 surface expression on Eµ-myc and pro-B cell tumors. Empty histograms represent the unstained control. (d) Eµ-myc and pro-B cell tumors respond to similar IFN-γ concentrations to upregulate PD-L1. Eµ-myc and pro-B cell tumors were incubated with the indicated IFN-γ concentrations in vitro for 24 hours. PD-L1 surface expression was then analyzed by flow cytometry. Data are pooled from n = 3 (Eµ-myc) and n = 5 (pro-B) independent experiments. gMFI, geometric mean fluorescence intensity. Two-way ANOVA and Sidak’s multiple comparisons were used for statistical analysis. (e) IFN-γ-R1 surface expression on GFP+, YFP+, CFP+ and mTom+ pro-B cell tumors. Note that the resistant CFP+ pro-B tumor cell line expressed similar levels of IFN-γ-R1 than the sensitive YFP+ pro-B tumor cell line. Empty histograms represent the unstained control. Data are expressed as mean ± SEM. ***P<0.001; **P<0.01; ns, not significant. Source data
Extended Data Fig. 8
Extended Data Fig. 8. Mouse and human CAR4 T cells induce distant tumor killing in an IFN-γ-dependent manner.
(a) Experimental setup. Pro-B tumors were co-cultured with WT or IFN-γ−/− CAR4 T cells (at an effector-to-target (E:T) ratio 5:1) in the upper chamber of a transwell. Pro-B tumors (expressing the caspase 3 reporter) were added to the lower chamber. When indicated, IFN-γ was neutralized using a blocking antibody. 24 hours later, pro-B tumors located in the lower chamber were analyzed by flow cytometry. (b, c) Dot plots showing that CAR4 T cell-derived IFN-γ diffuses to induce the up-regulation of H2-Kb (B) and PD-L1 (C) levels on tumor cells. gMFI, geometric mean fluorescence intensity. (d–e) Dot plots showing that CAR4 T cell-derived IFN-γ induces distant tumor cell killing. (d) Tumor cell apoptosis was assessed using the FRET-based caspase 3 reporter. (e) Tumor cell death was assessed using fixable viability dye (Zombie NIR). (b–e) Each dot represents one technical replicate (n = 1 experiment). (f) Representative histogram of human CD19 expression by retrovirally transduced OVCAR3 tumors. (g) In vitro quantification of human CAR4 T cell cytotoxic activity. Antigen-negative (CD19) OVCAR3 or antigen-positive (CD19+) OVCAR3 tumors were co-cultured with human anti-CD19 CAR4 T cells at 1:1 effector-to-target ratio or left untreated for 48 hours. When indicated, IFN-γ and IFN-γ-R1 were neutralized using blocking antibodies. Tumor cell death was assessed using fixable viability dye (Zombie NIR). Each dot represents one technical replicate (n = 1 experiment). (h) Experimental setup. CD19-expressing OVCAR3 cells were co-cultured with human CAR4 T cells (at an effector-to-target (E:T) ratio 5:1) in the upper chamber of a transwell. CD19-expressing OVCAR3 tumors were added to the lower chamber. When indicated, IFN-γ and IFN-γ-R1 were neutralized using blocking antibodies. 48 hours later, CD19-expressing OVCAR3 tumors located in the lower chamber were analyzed by flow cytometry. (i) Dot plots showing that CAR4 T cell-derived IFN-γ diffuses to induce the up-regulation of HLA molecules (left) and PD-L1 (right) levels on tumor cells. gMFI, geometric mean fluorescence intensity. (j) Dot plots showing that CAR4 T cell-derived IFN-γ induces distant tumor cell death as assessed using fixable viability dye (Zombie NIR). (i, j) Each dot represents one technical replicate. Similar results were obtained in n = 2 independent experiments. Source data
Extended Data Fig. 9
Extended Data Fig. 9. Murine and human CAR4 T cell-derived IFN-γ promotes the bystander killing of CD19 target cells.
(a) Representative histogram of CD19 expression by antigen-positive (black) and CRISPR-edited antigen-negative (white) pro-B cell tumors. (b) Experimental setup. Antigen-negative (CD19) pro-B tumors were co-cultured with antigen-positive (CD19+) pro-B tumors and WT or IFN-γ−/− CAR4 T cells. When indicated, IFN-γ was neutralized using a blocking antibody. 48 hours later, apoptosis in CD19 pro-B tumors (expressing the caspase 3 reporter) was analyzed by flow cytometry. (c, d) Representative FACS plots (C) and dot plots (D) showing that CAR4 T cell-derived IFN-γ produced upon recognition of CD19+ pro-B tumors contributes to the apoptosis of CD19 pro-B tumors. Each dot represents one technical replicate (n = 1 experiment). CFP, Cyan Fluorescent Protein. (e) Experimental setup. Antigen-negative (CD19) OVCAR3 tumors were co-cultured with antigen-positive (CD19+) OVCAR3 tumors and human anti-CD19 CAR4 T cells. When indicated, IFN-γ and IFN-γ-R1 were neutralized using blocking antibodies. 48 hours later, cell death in OVCAR3 tumors was analyzed by flow cytometry using fixable viability dye (Zombie NIR). (f) Dot plots showing that human CAR4 T cell-derived IFN-γ produced upon recognition of CD19+ OVCAR3 tumors contributes to the killing of antigen-negative OVCAR3 tumors. Each dot represents one technical replicate (n = 1 experiment). (g) In vivo experimental set-up. Pro-B cell tumors were established by intravenous injection of 0.5 × 10⁶ of pro-B cells expressing the FRET-based caspase 3 reporter in C57BL/6 mice after sublethal irradiation. Six days later, mice were injected intravenously with WT or IFN-γ−/− CAR4 T cells or left untreated. Seven days after CAR T cell transfer, blood cells were processed using flow cytometry. (h) Percentage of antigen-positive (CD19+) and emerging antigen-negative (CD19) pro-B tumors tumor cells recovered from the blood (n = 7 untreated, n = 8 WT CAR4 T cell-treated and n = 8 IFN-γ−/− CAR4 T cell-treated mice from 1 experiment). Statistics for antigen-negative (CD19) pro-B tumors are shown. Two-way ANOVA and Tukey’s multiple comparisons were used for statistical analysis. Data are expressed as mean ± SEM. *P<0.05; ns, not significant. Source data
Extended Data Fig. 10
Extended Data Fig. 10. IFN-γ contributes to CAR4 T cell-mediated killing of some but not all solid tumors.
(a, b) Impact of IFN-γ on two distinct solid tumors, colon adenocarcinoma MC38 cells and melanoma B16.F10 cells. MC38 and B16.F10 tumors were incubated with the indicated IFN-γ concentrations in vitro for 24 hours. (a) Cell death was assessed using fixable viability dye (Zombie NIR) and expressed as a fold change relative to untreated cells. (b) IFN-γ induces phenotypic changes in both MC38 and B16.F10 tumors in vitro. H2-Kb (left) and PD-L1 (right) surface expression was then analyzed by flow cytometry. gMFI, geometric mean fluorescence intensity. (a, b) Each dot represents the mean of 3 technical replicates from n = 2 independent experiments. Two-way ANOVA and Sidak’s multiple comparisons were used for statistical analysis. (c) CD19-expressing MC38 and CD19-expressing B16.F10 tumors were co-cultured with WT or IFN-γ−/− CAR4 T cells at 1:1 effector-to-target ratio or left untreated for 24 hours. When indicated, IFN-γ was neutralized using a blocking antibody. Tumor cell death was assessed using fixable viability dye (Zombie NIR). Each dot represents one technical replicate (n = 1 experiment). (d-e) B16-CD19 tumors were established by subcutaneous injection of 0.5 × 10⁶ B16-CD19 cells in the flank of C57BL/6 mice after sublethal irradiation. Ten days later, mice were injected intravenously with WT or IFN-γ−/− CAR4 T cells (10 × 106) or left untreated (n = 7 untreated mice, n = 7 WT CAR4 T cell-treated mice and n = 8 IFN-γ−/− CAR4 T cell-treated mice from 1 experiment). (d) Tumor growth was monitored every 2–3 days. Two-way ANOVA and Tukey’s multiple comparisons were used for statistical analysis. (e) WT CAR4 but not IFN-γ−/− CAR4 T cell therapy prolonged mouse survival. Log-rank test was used for statistical analysis. Data are expressed as mean ± SEM. ***P<0.001; **P<0.01; *P<0.05; ns, not significant. Source data

Comment in

  • CD4+ CAR T cells - more than helpers.
    Kohler ME, Fry TJ. Kohler ME, et al. Nat Cancer. 2023 Jul;4(7):928-929. doi: 10.1038/s43018-023-00567-2. Nat Cancer. 2023. PMID: 37248396 No abstract available.
  • The role of CD4+ CAR T cells in cancer immunotherapy.
    Bove C, Maher J, Glover M. Bove C, et al. Transl Cancer Res. 2024 May 31;13(5):2580-2586. doi: 10.21037/tcr-23-2044. Epub 2024 May 17. Transl Cancer Res. 2024. PMID: 38881935 Free PMC article. No abstract available.

References

    1. Tay RE, Richardson EK, Toh HC. Revisiting the role of CD4(+) T cells in cancer immunotherapy-new insights into old paradigms. Cancer Gene Ther. 2021;28:5–17. - PMC - PubMed
    1. Poncette L, Bluhm J, Blankenstein T. The role of CD4 T cells in rejection of solid tumors. Curr. Opin. Immunol. 2021;74:18–24. - PMC - PubMed
    1. Li T, Wu B, Yang T, Zhang L, Jin K. The outstanding antitumor capacity of CD4(+) T helper lymphocytes. Biochim. Biophys. Acta, Rev. Cancer. 2020;1874:188439. - PubMed
    1. Binnewies M, et al. Unleashing type-2 dendritic cells to drive protective antitumor CD4(+) T cell immunity. Cell. 2019;177:556–571. - PMC - PubMed
    1. Wei SC, et al. Distinct cellular mechanisms underlie anti-CTLA-4 and anti-PD-1 checkpoint blockade. Cell. 2017;170:1120–1133. - PMC - PubMed

Publication types