. 2023 Jul;24(7):1110-1123.
doi: 10.1038/s41590-023-01521-1. Epub 2023 May 29.

Monocyte-derived IL-6 programs microglia to rebuild damaged brain vasculature

Affiliations

Monocyte-derived IL-6 programs microglia to rebuild damaged brain vasculature

Bo-Ran Choi et al. Nat Immunol. 2023 Jul.

Abstract

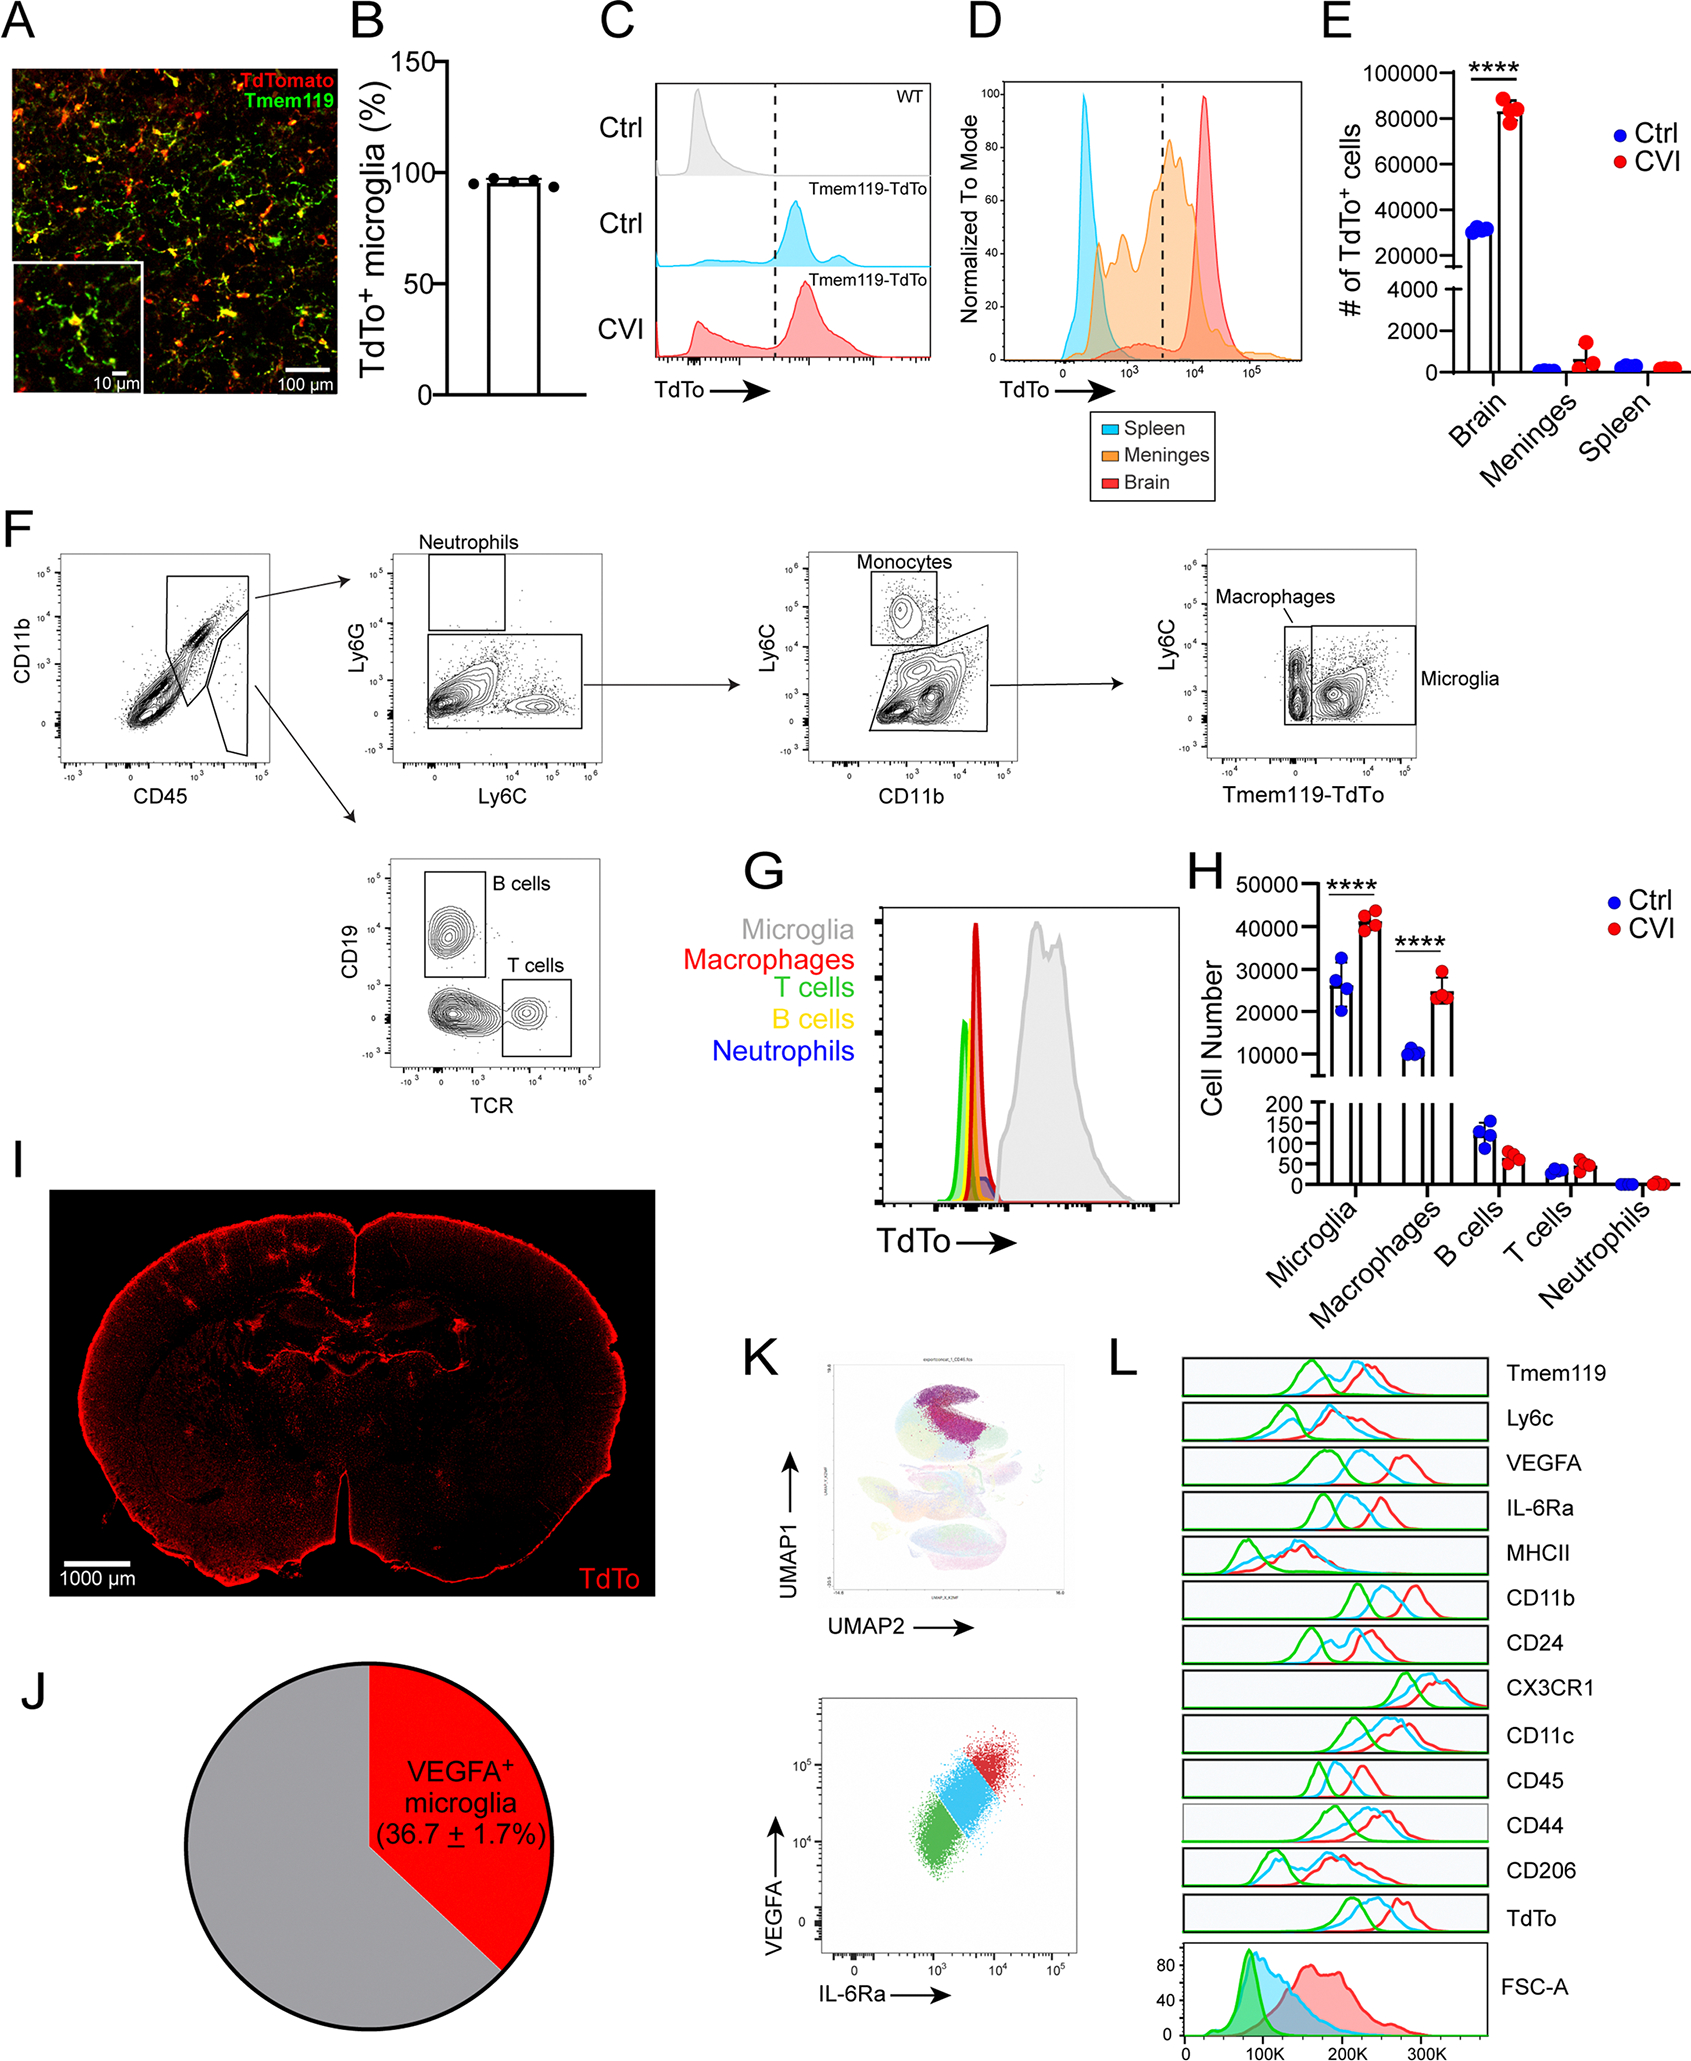
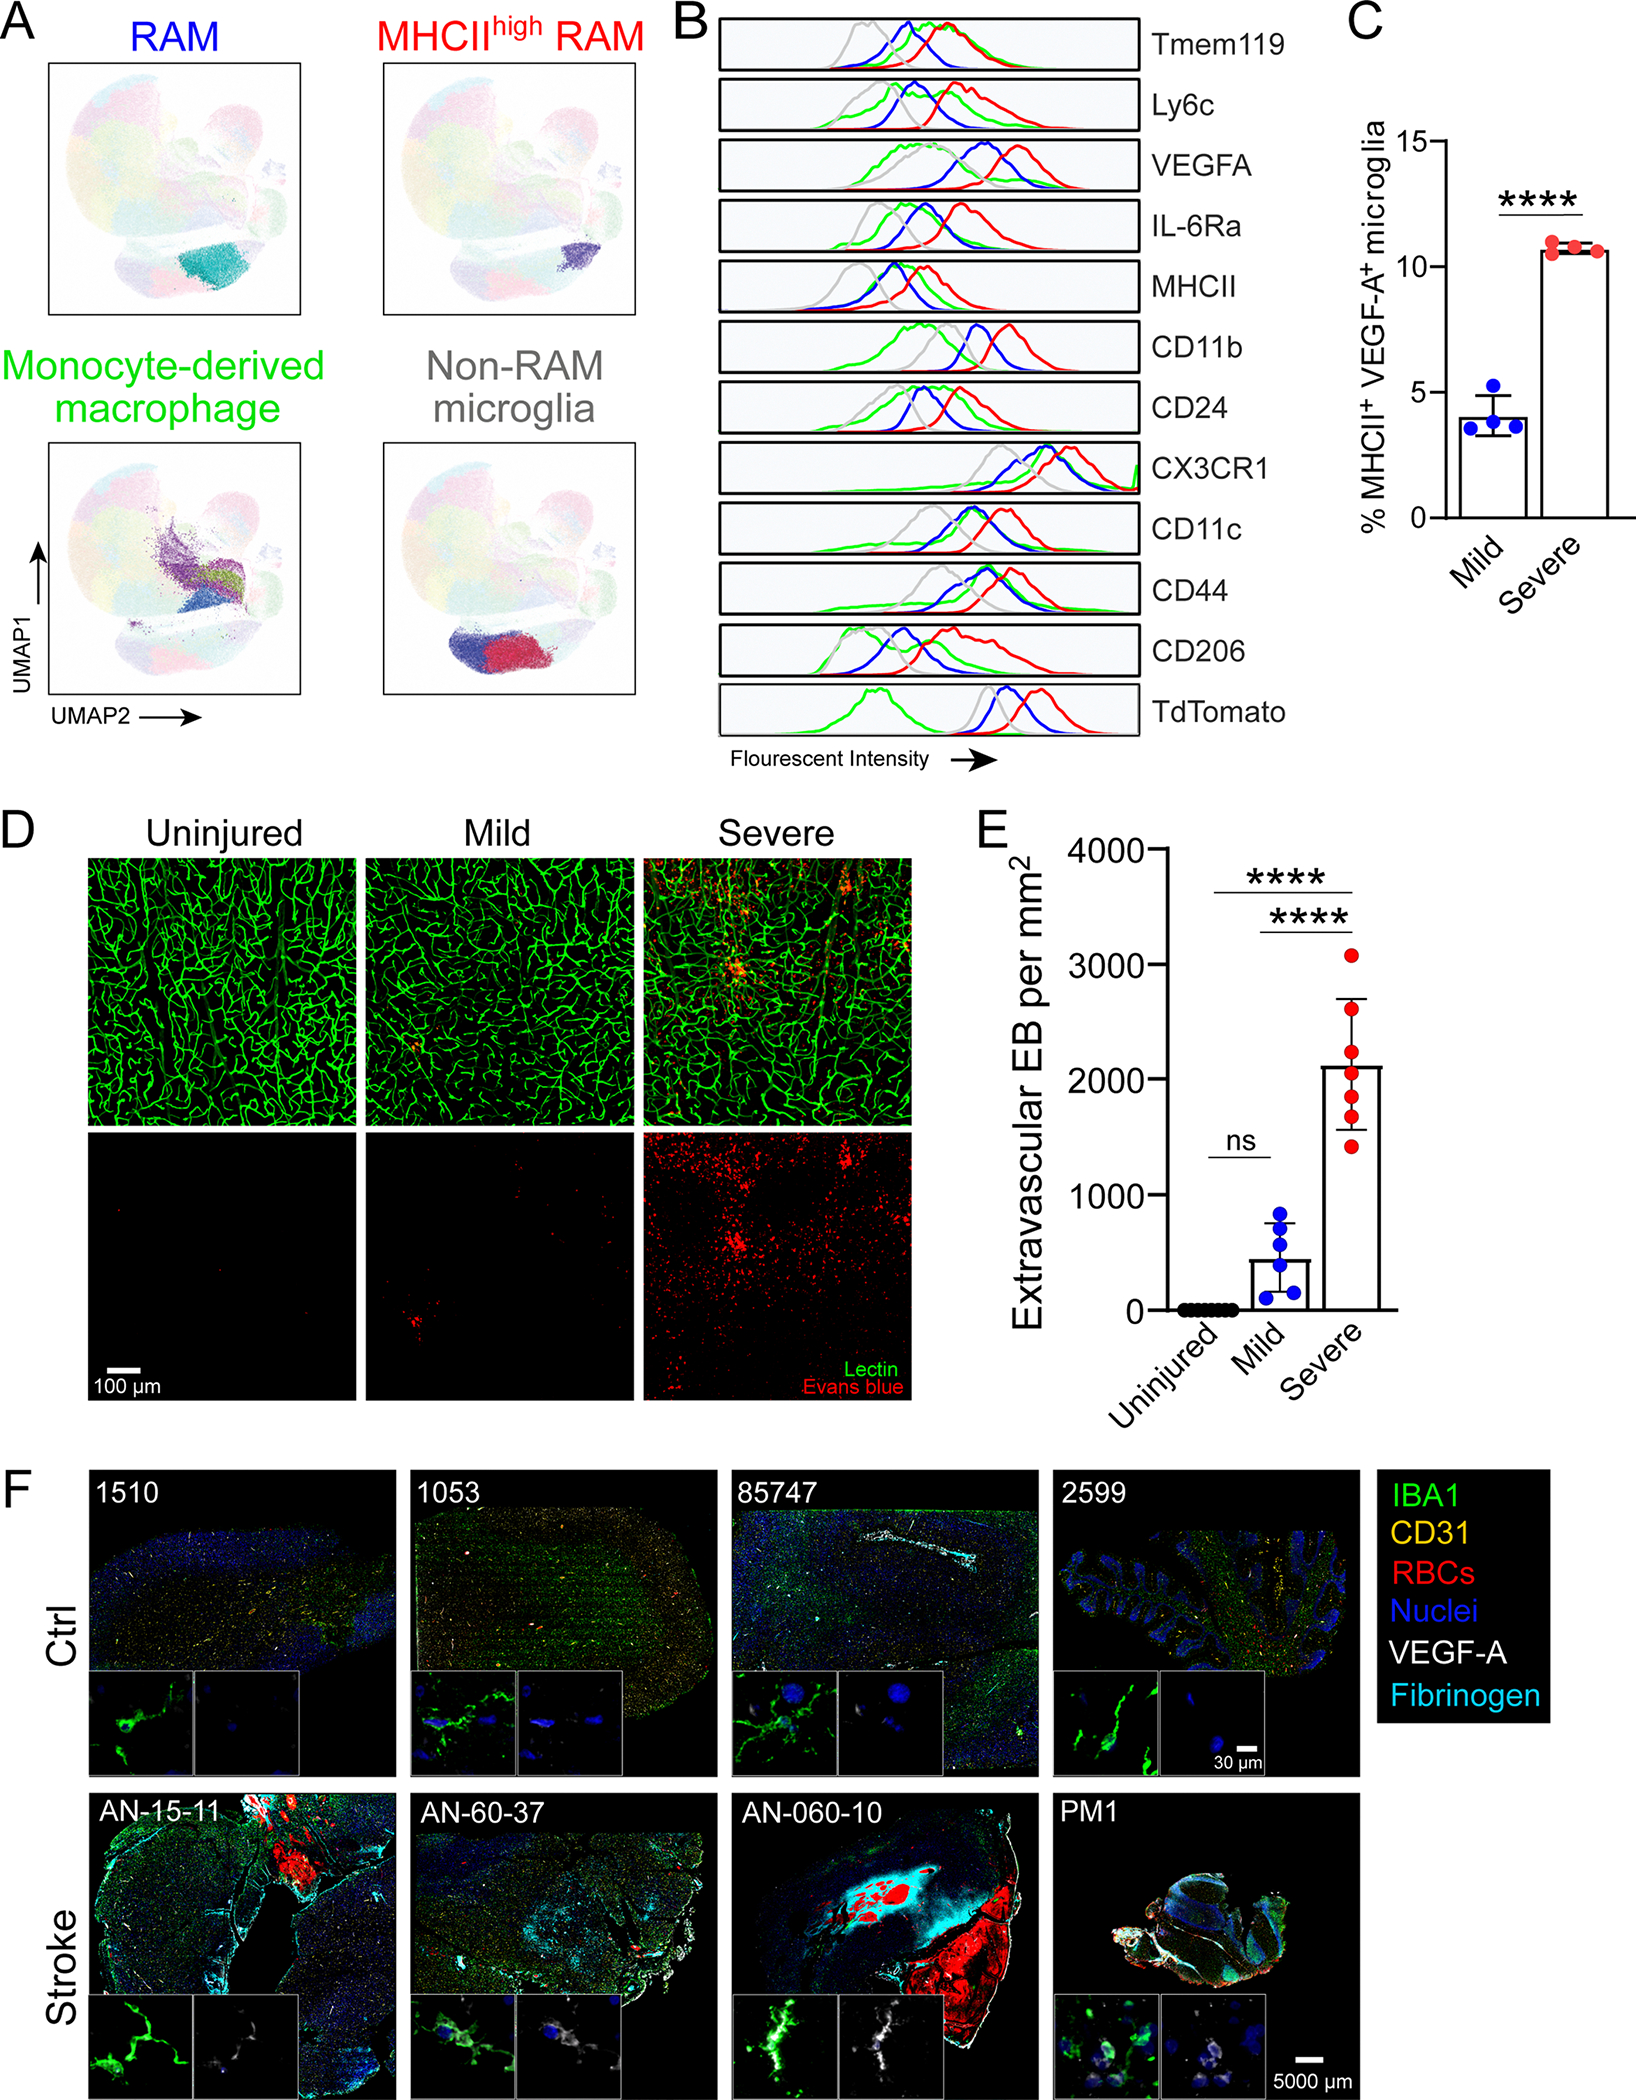
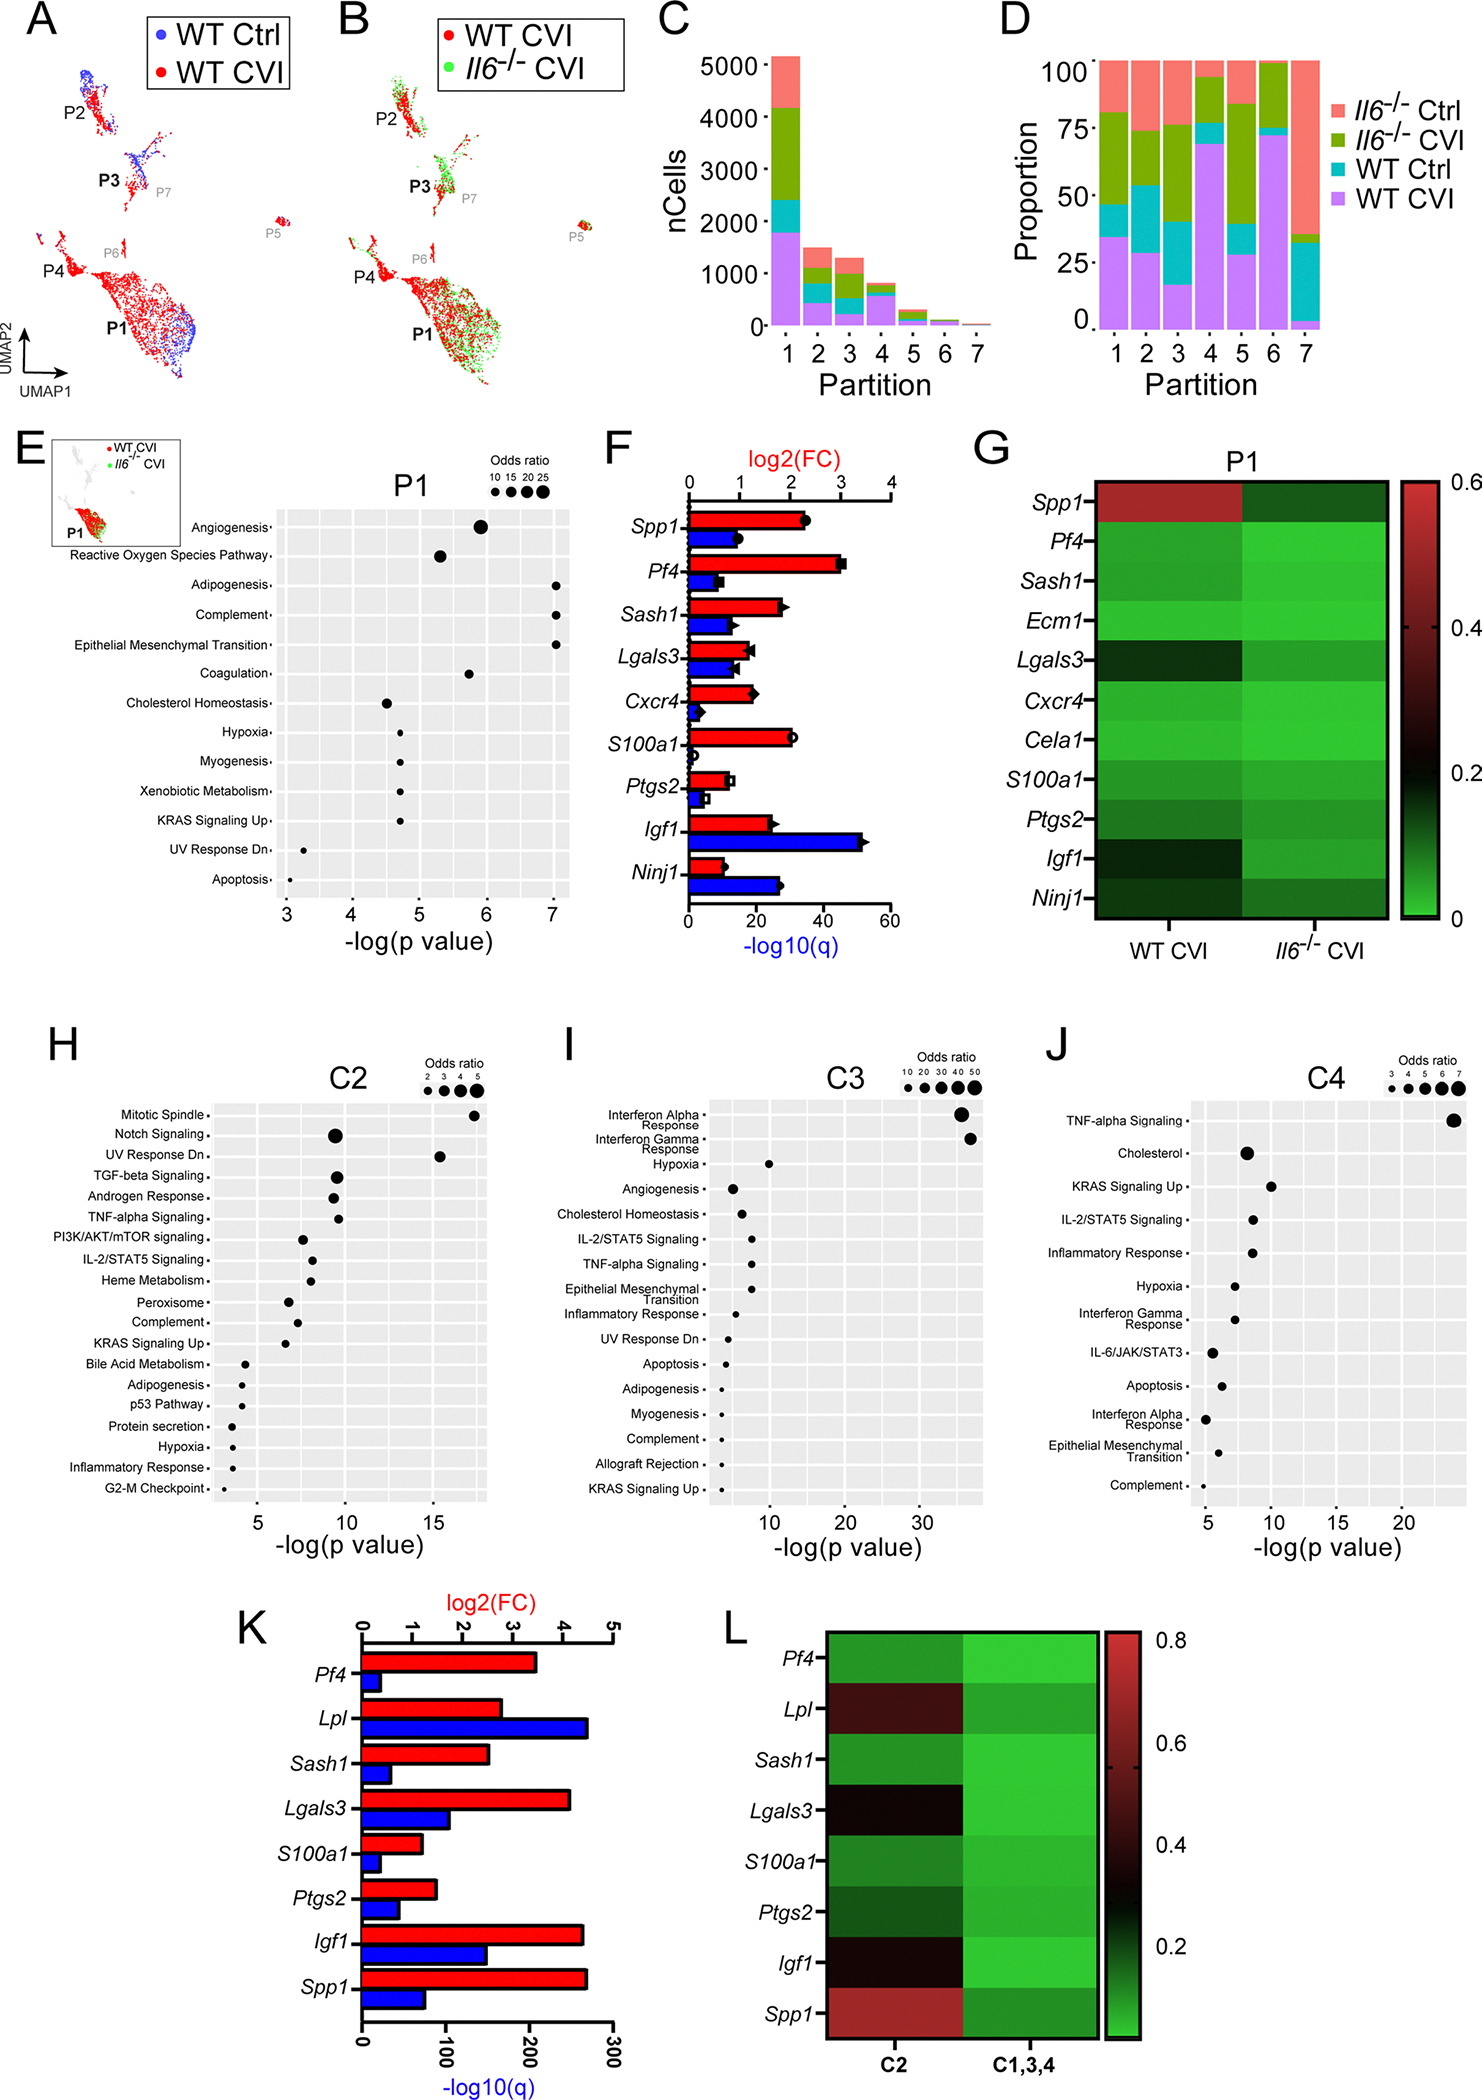
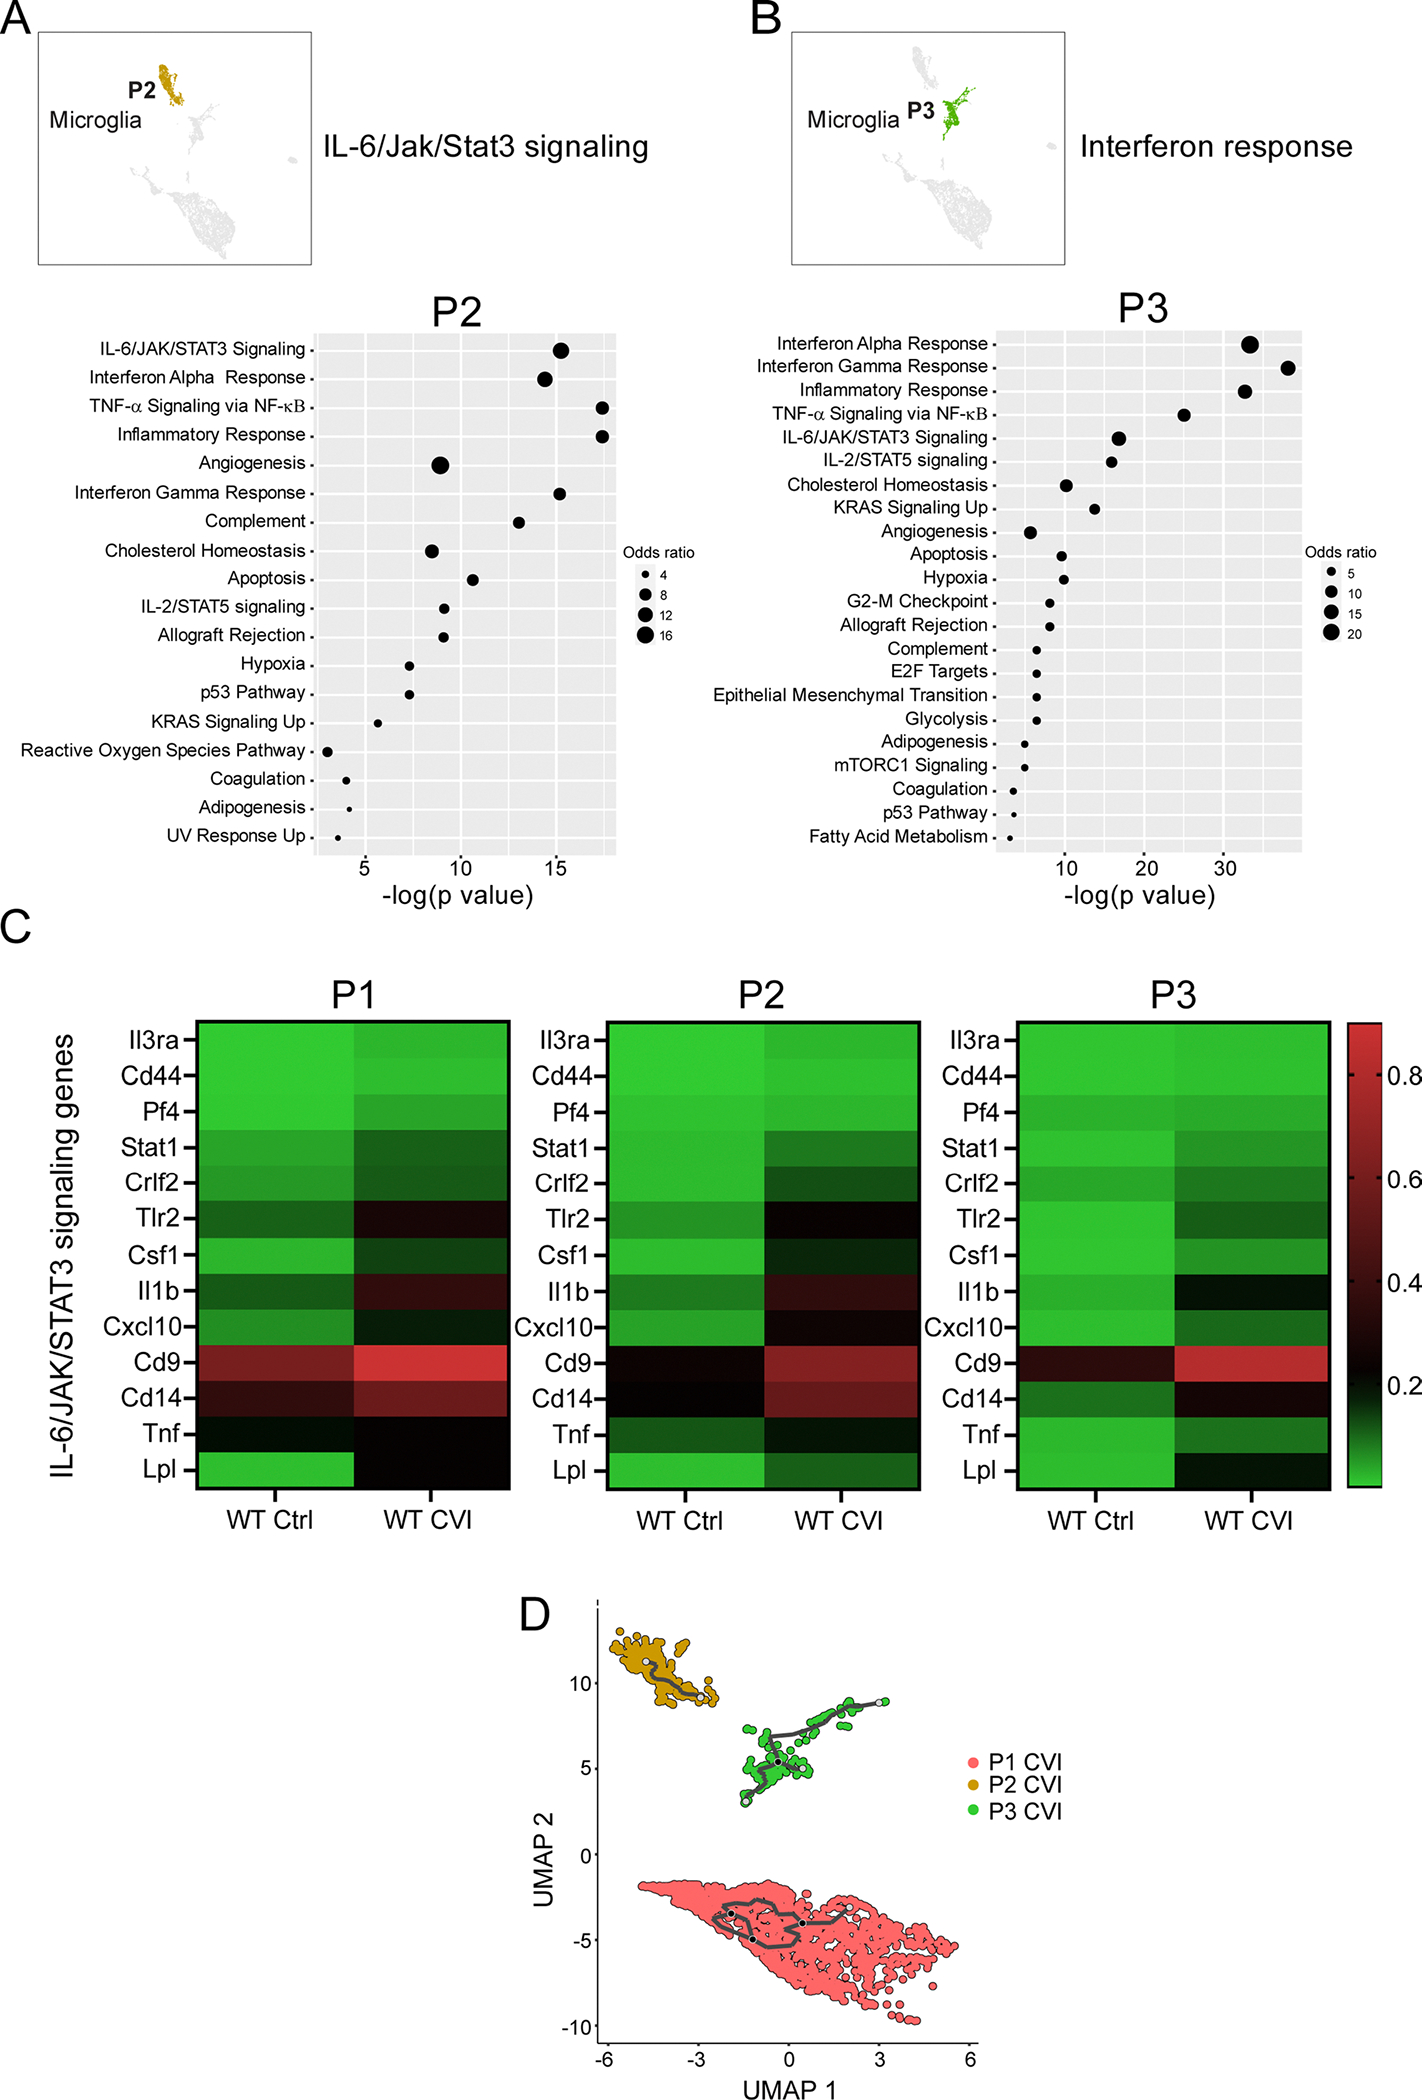
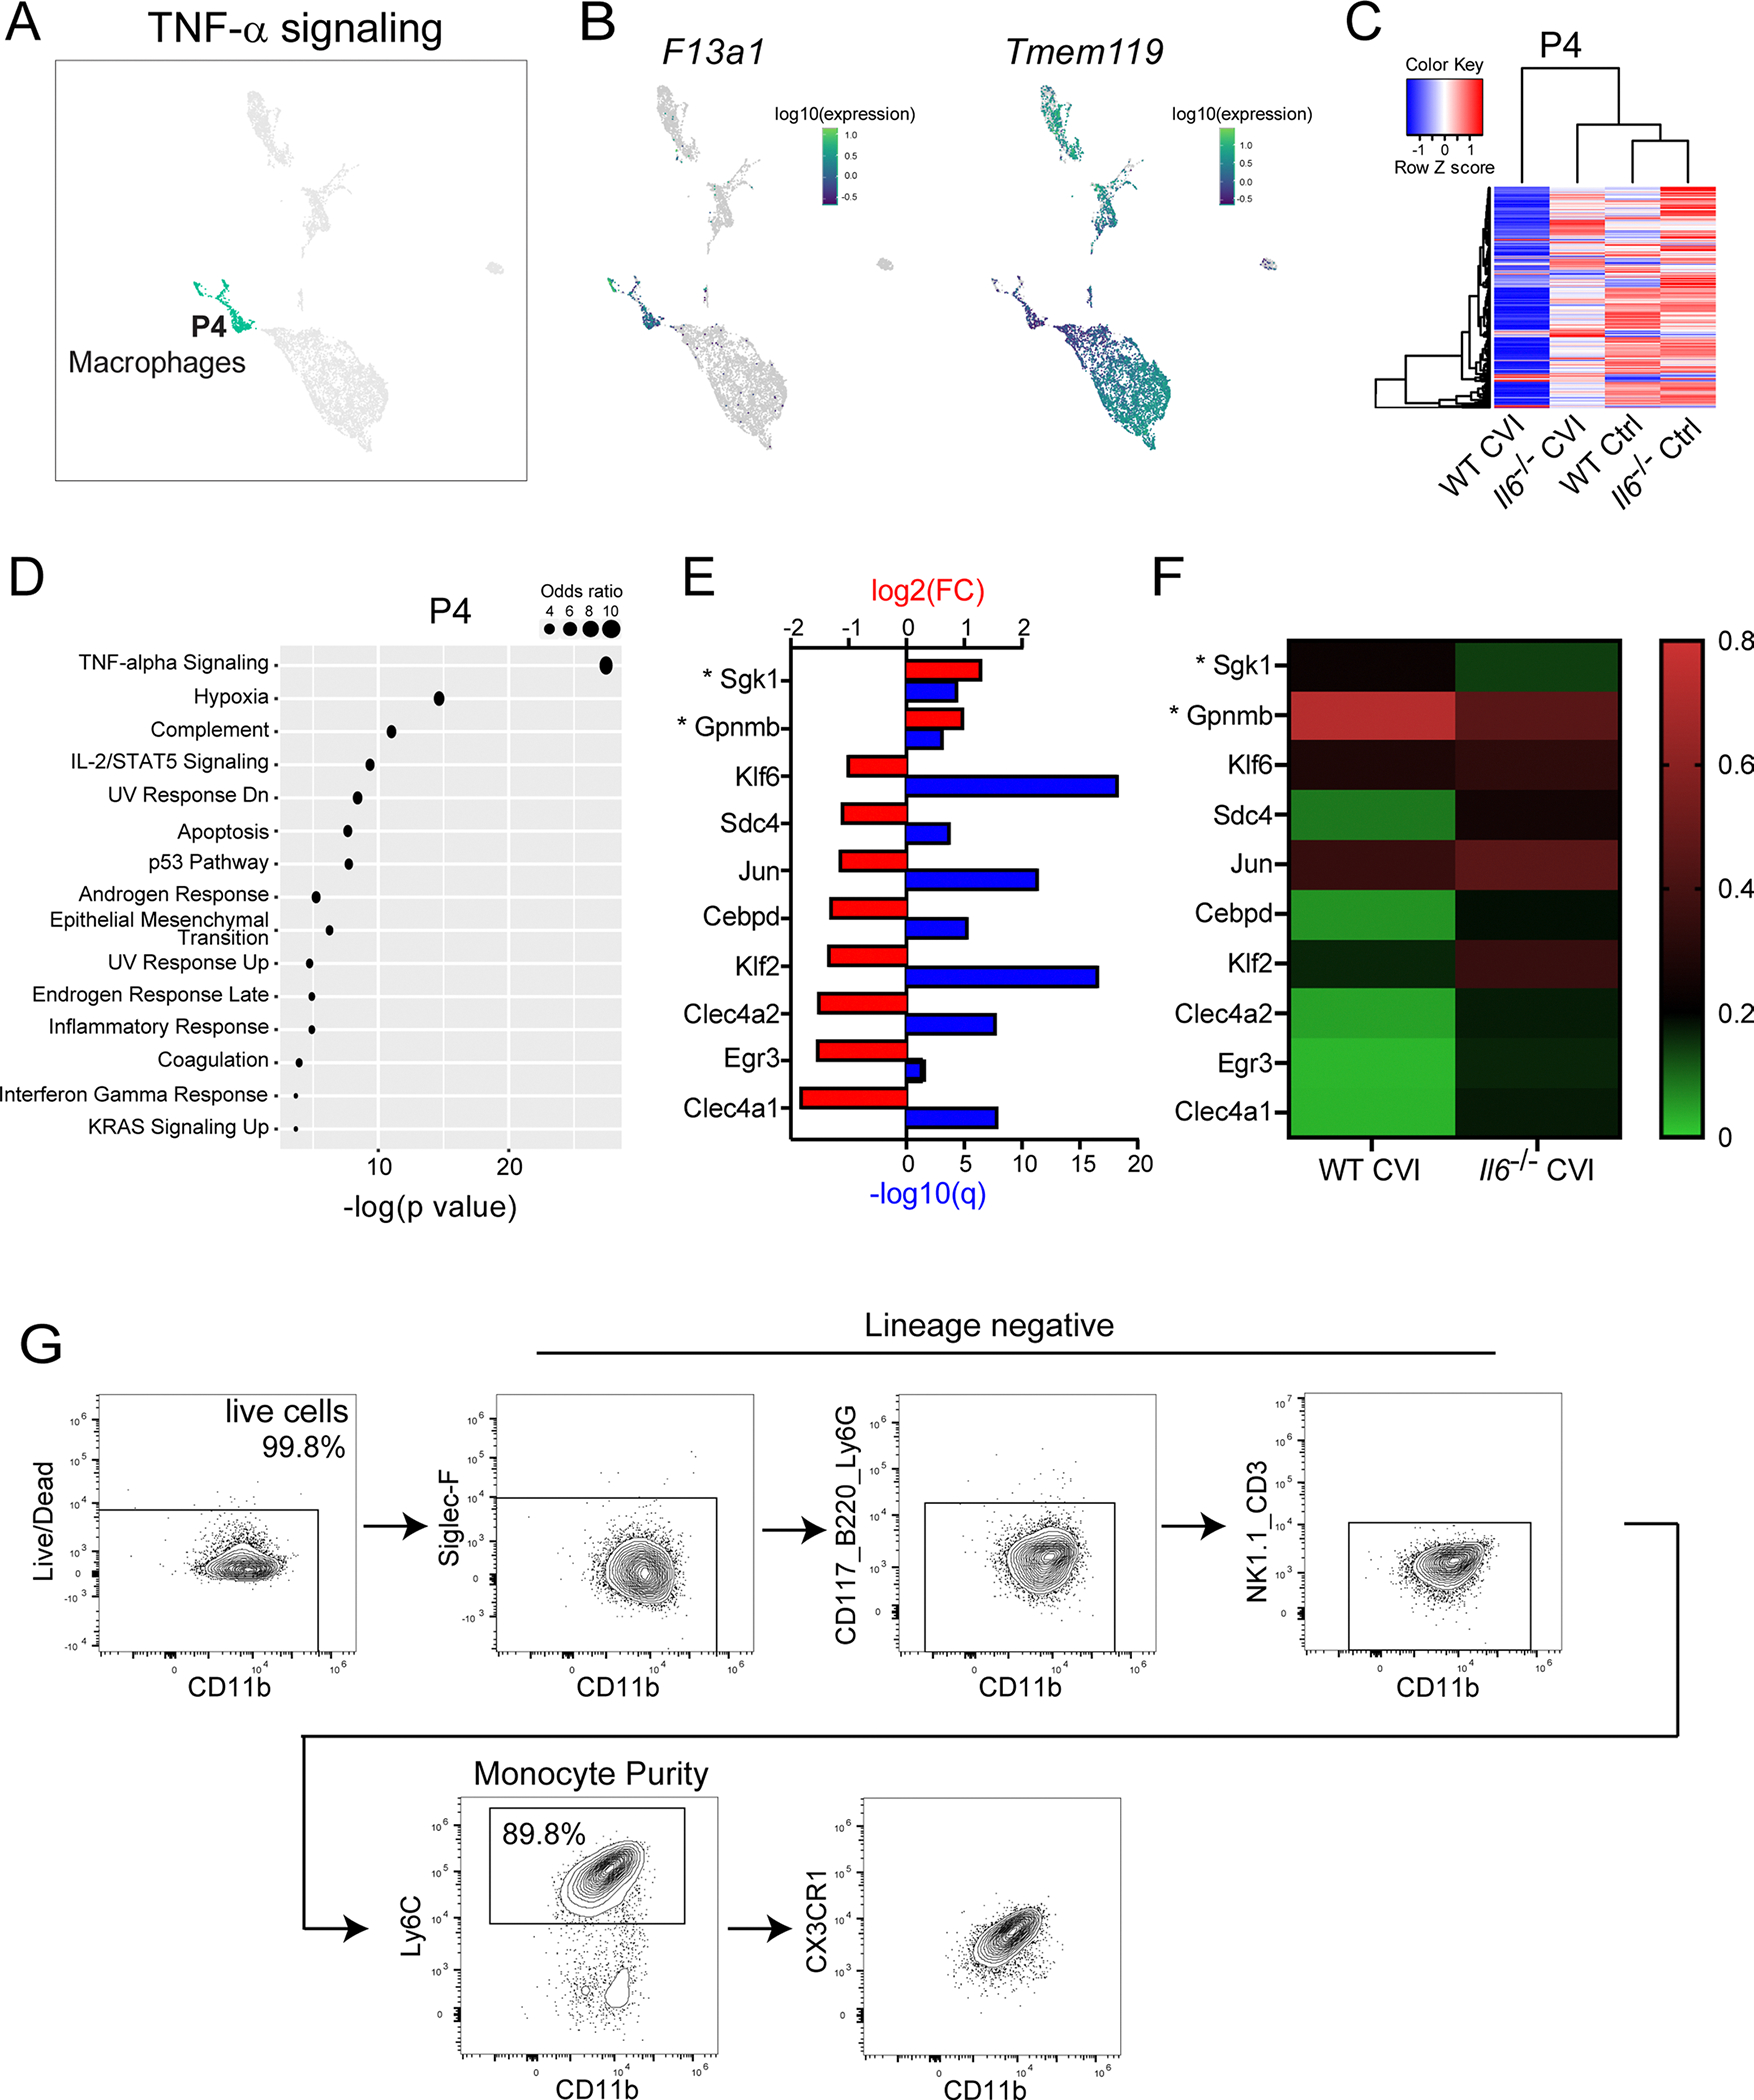
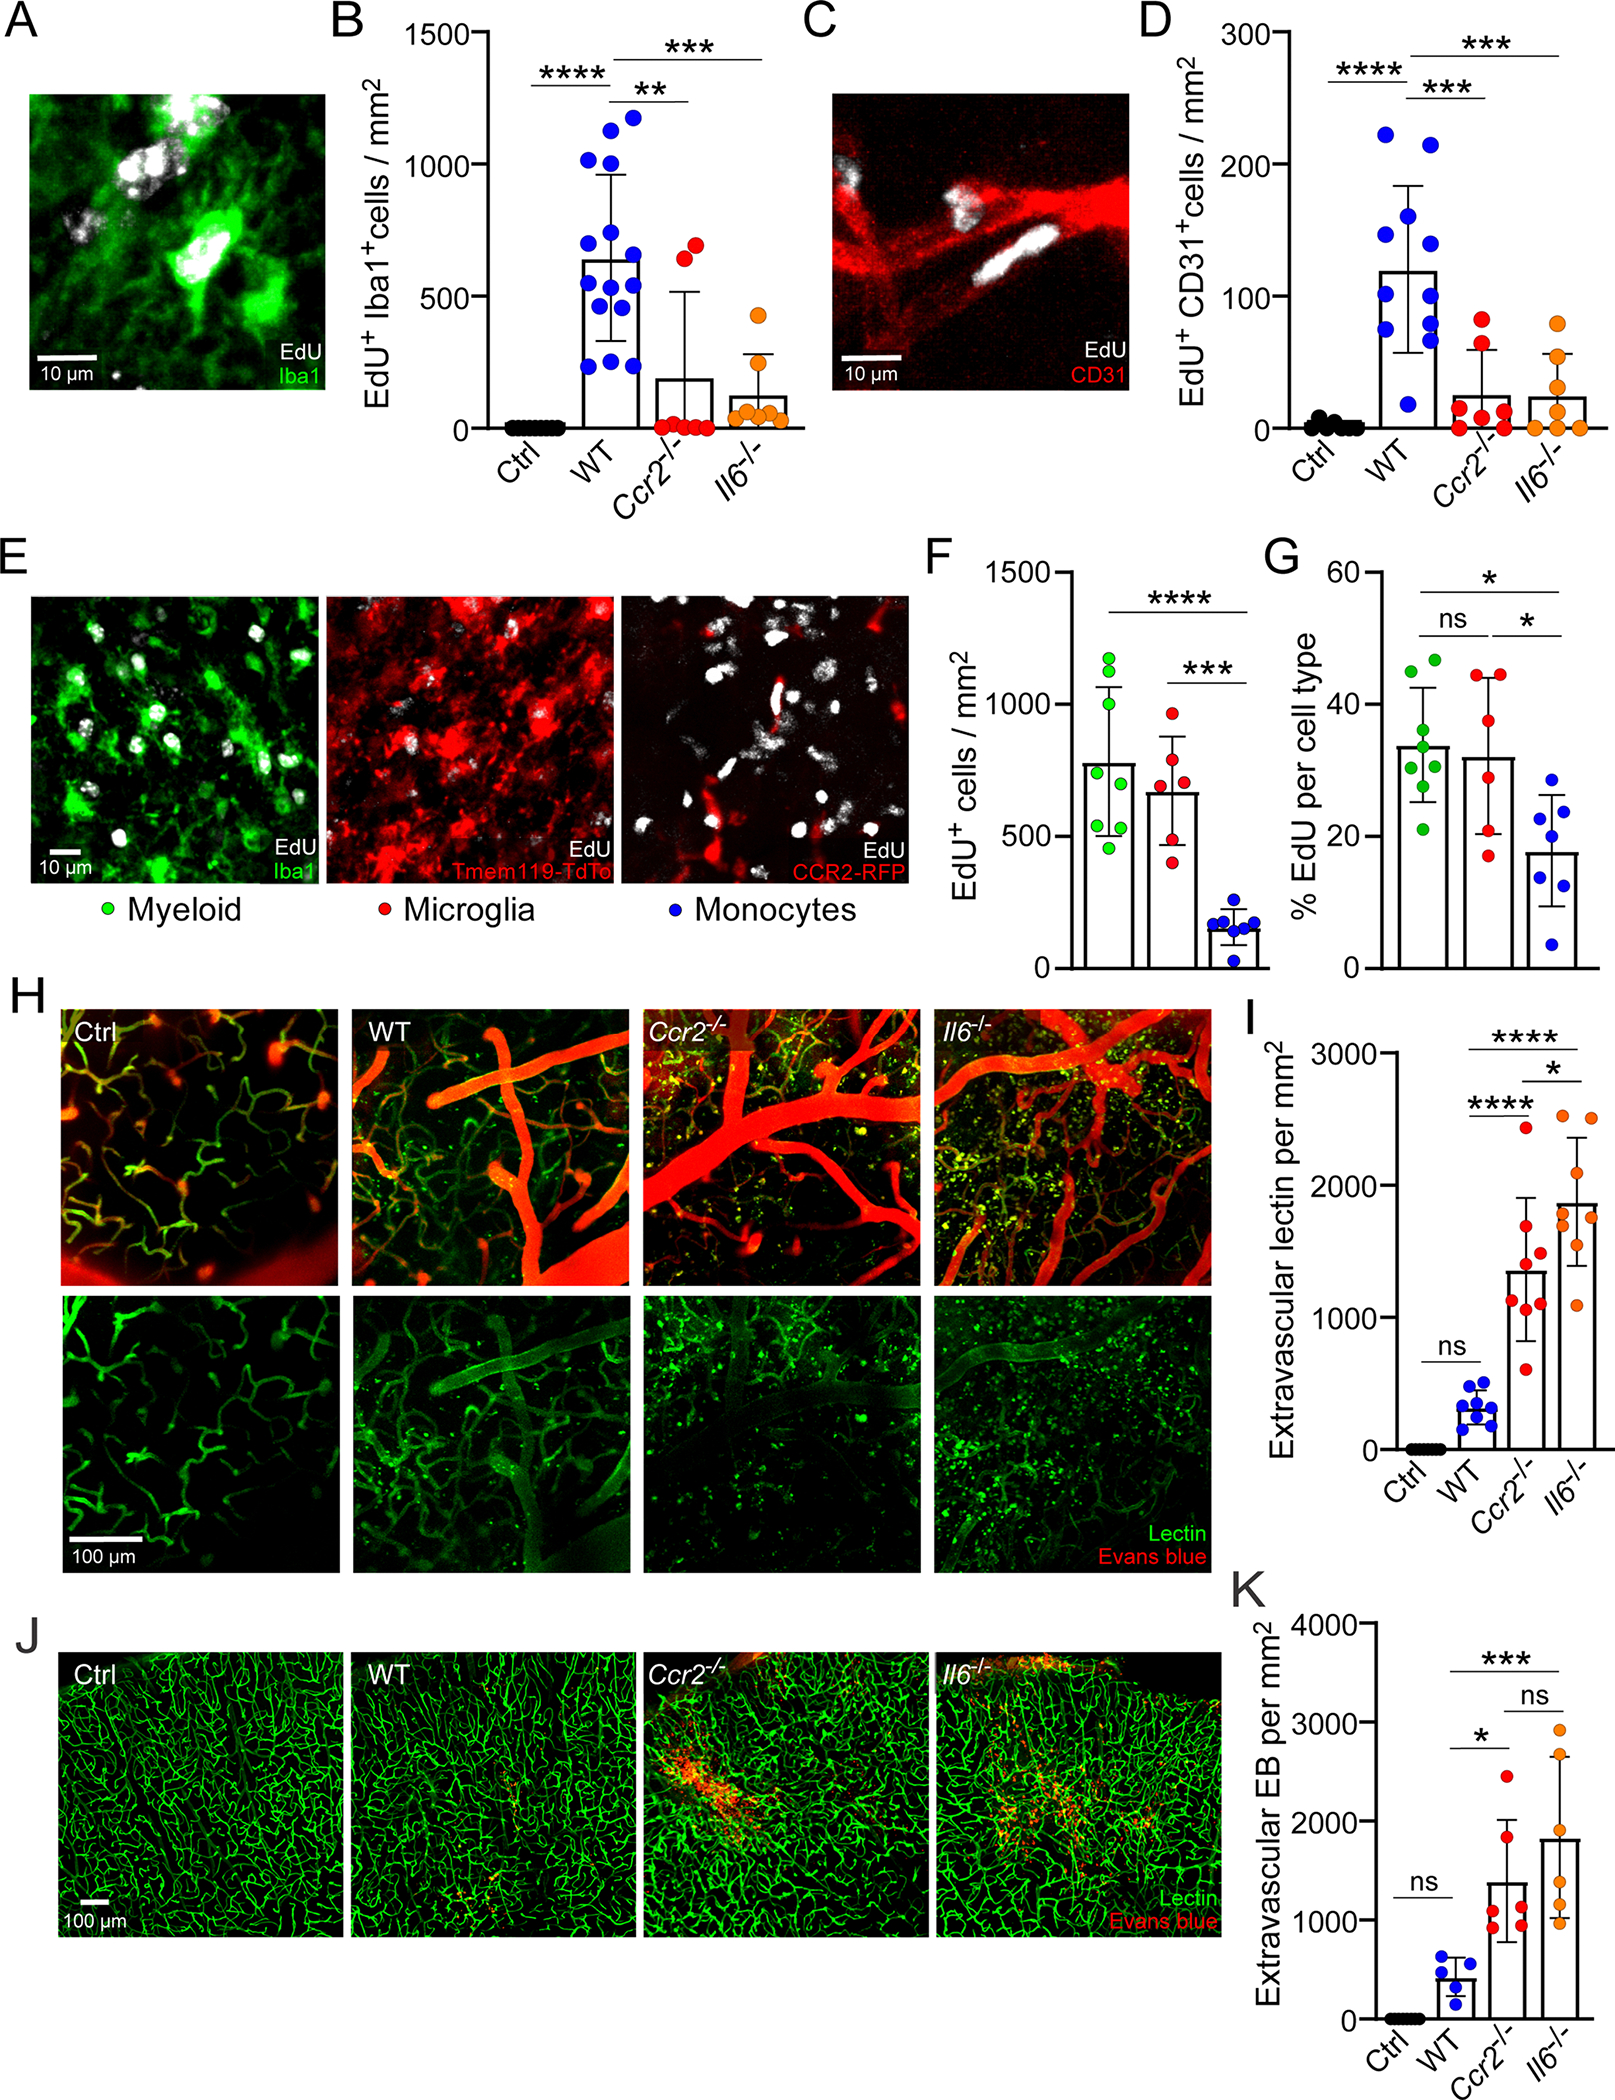
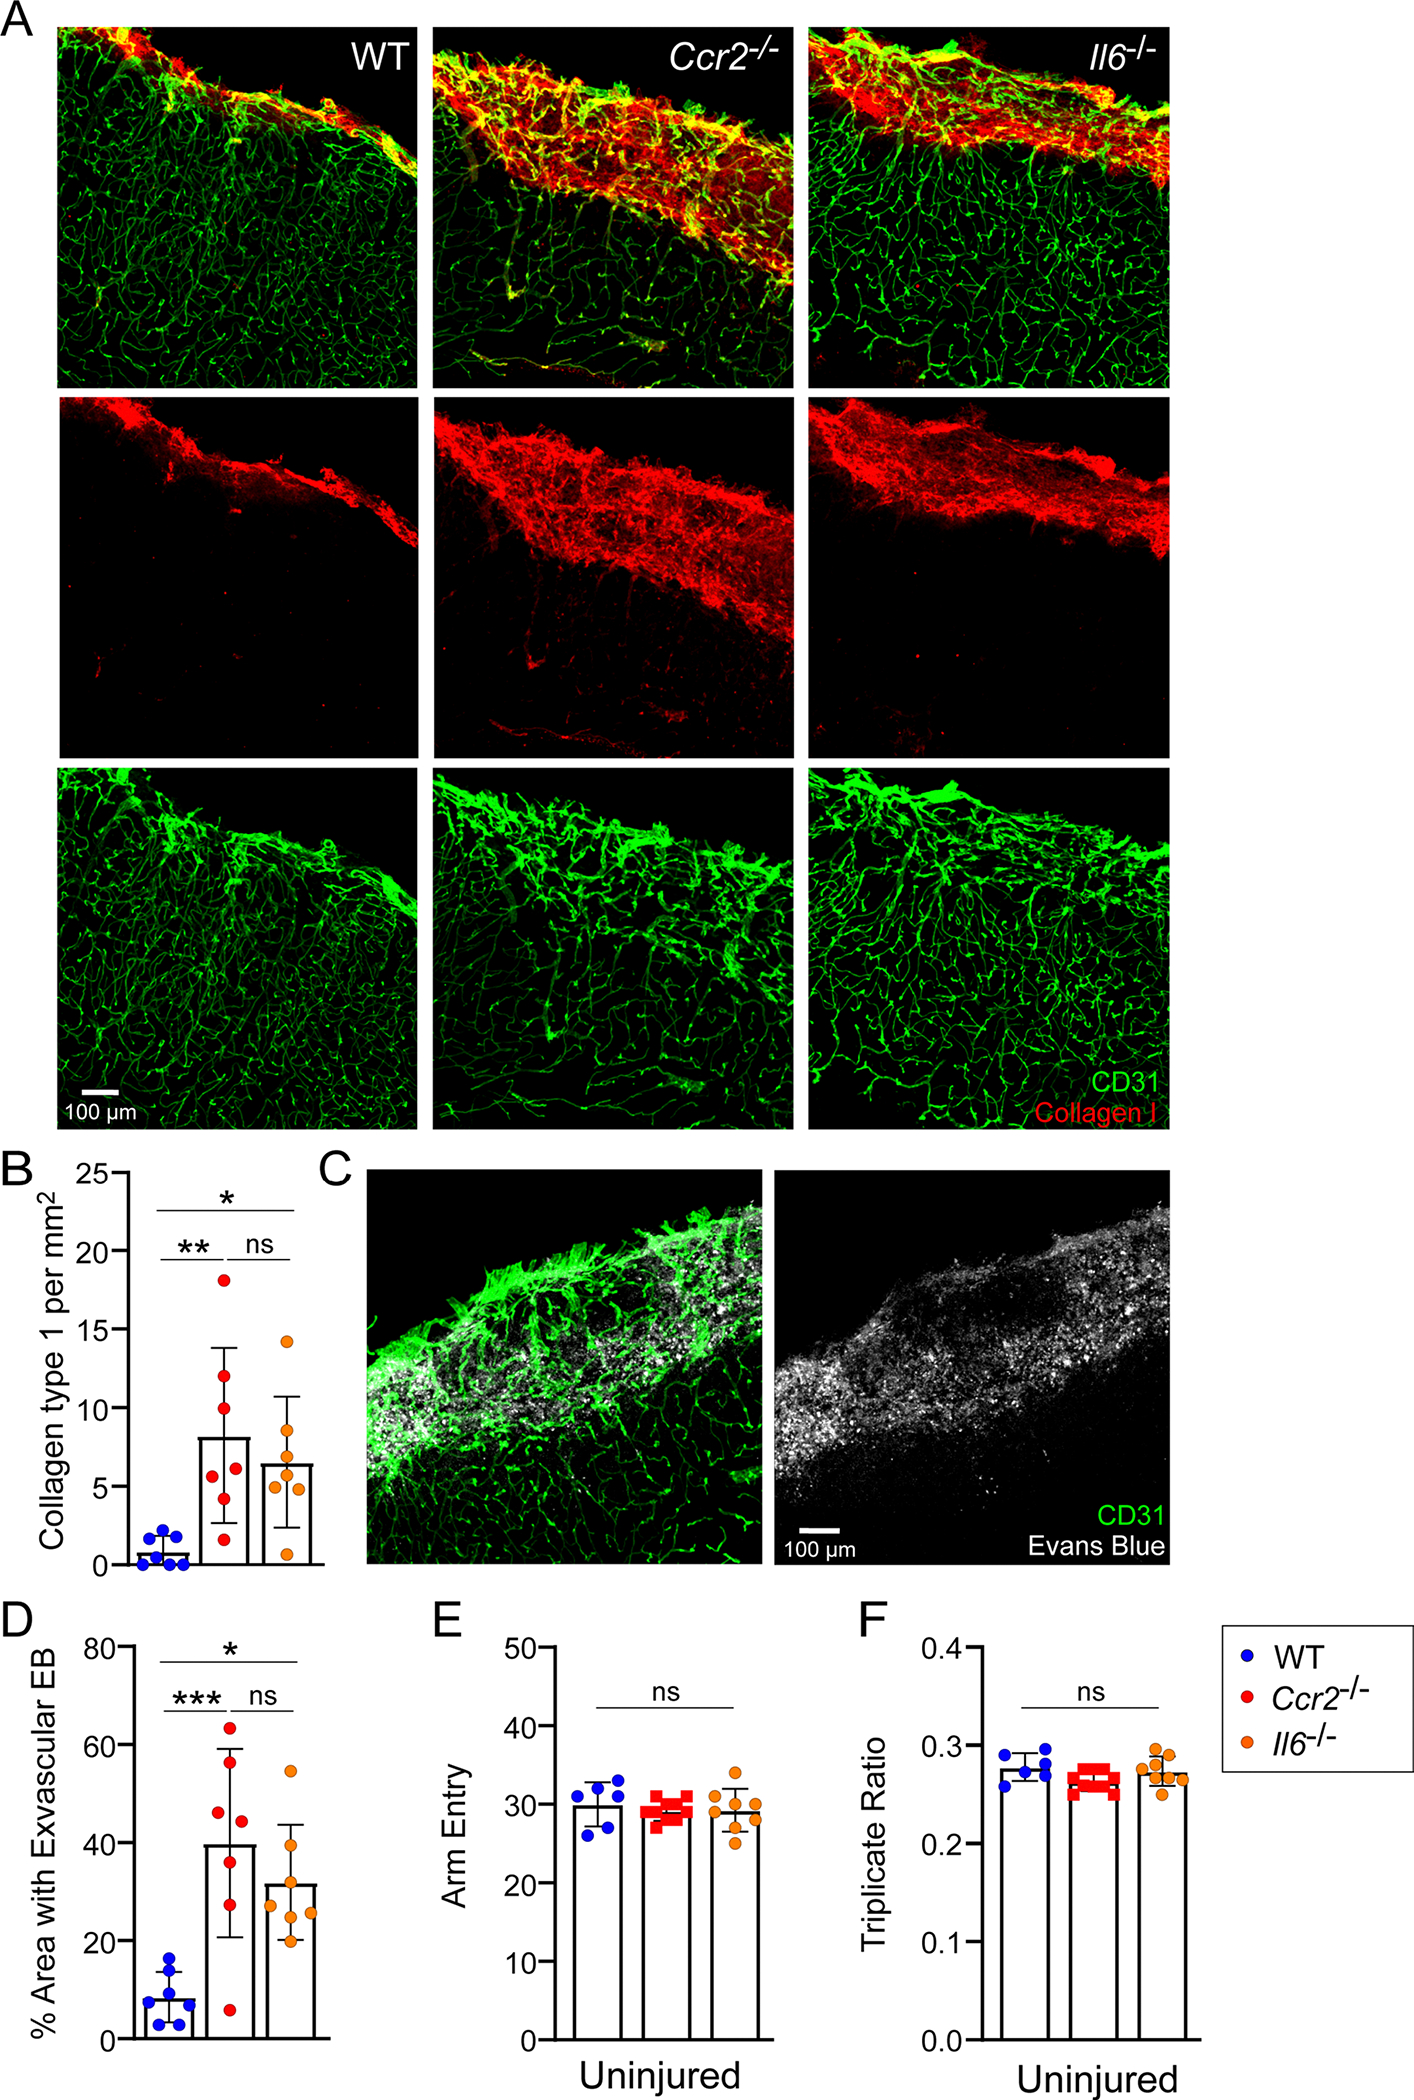
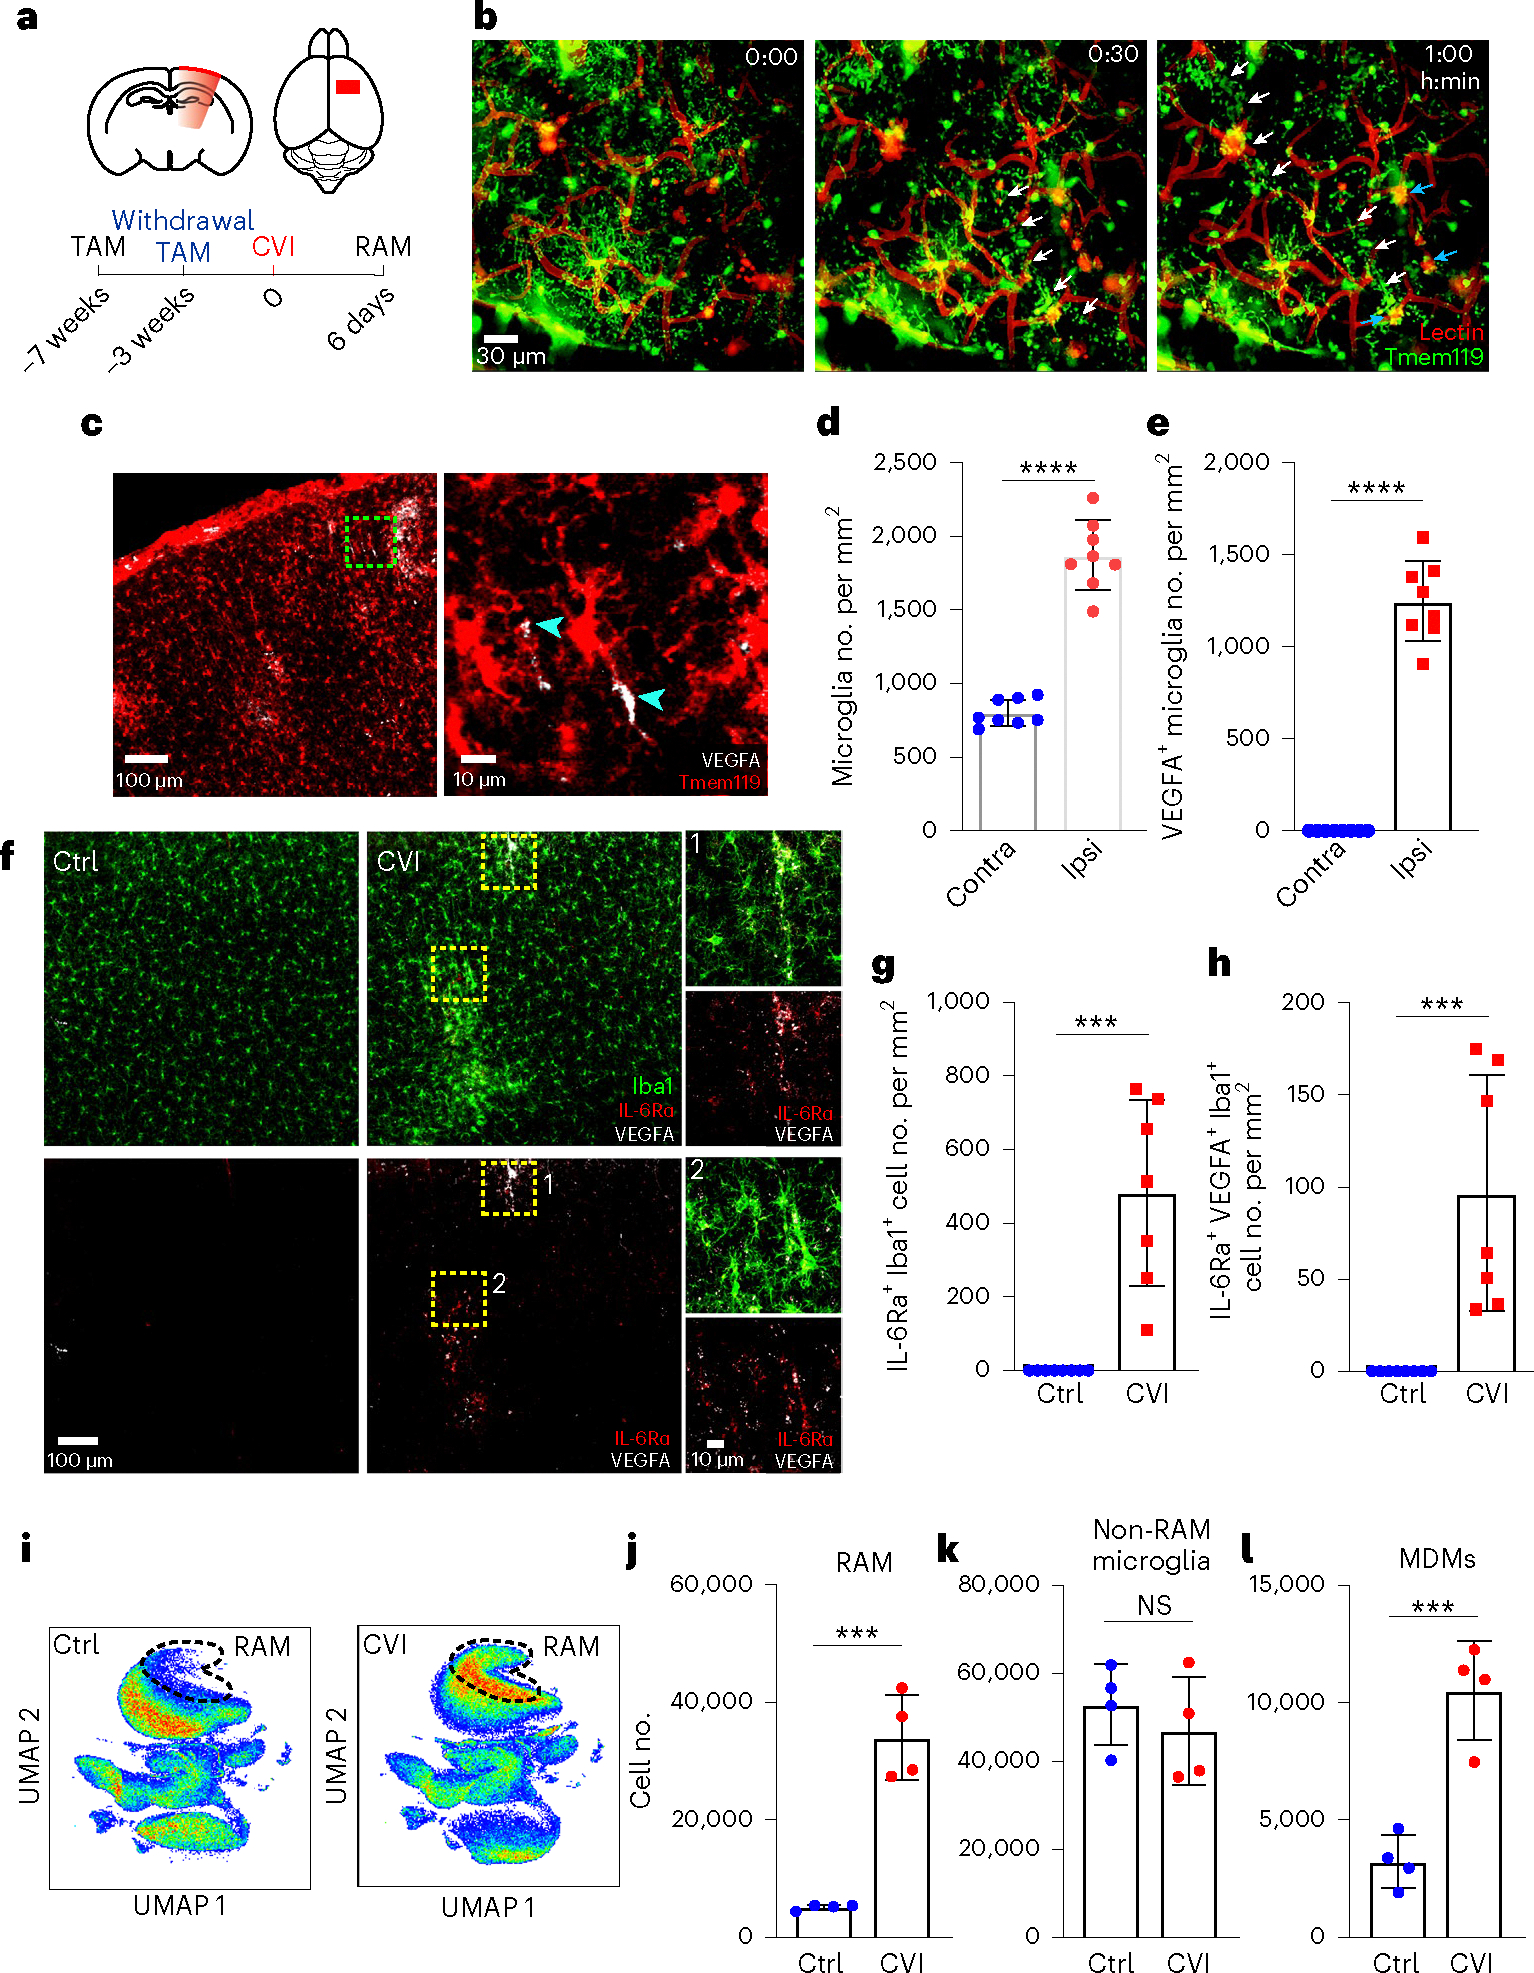
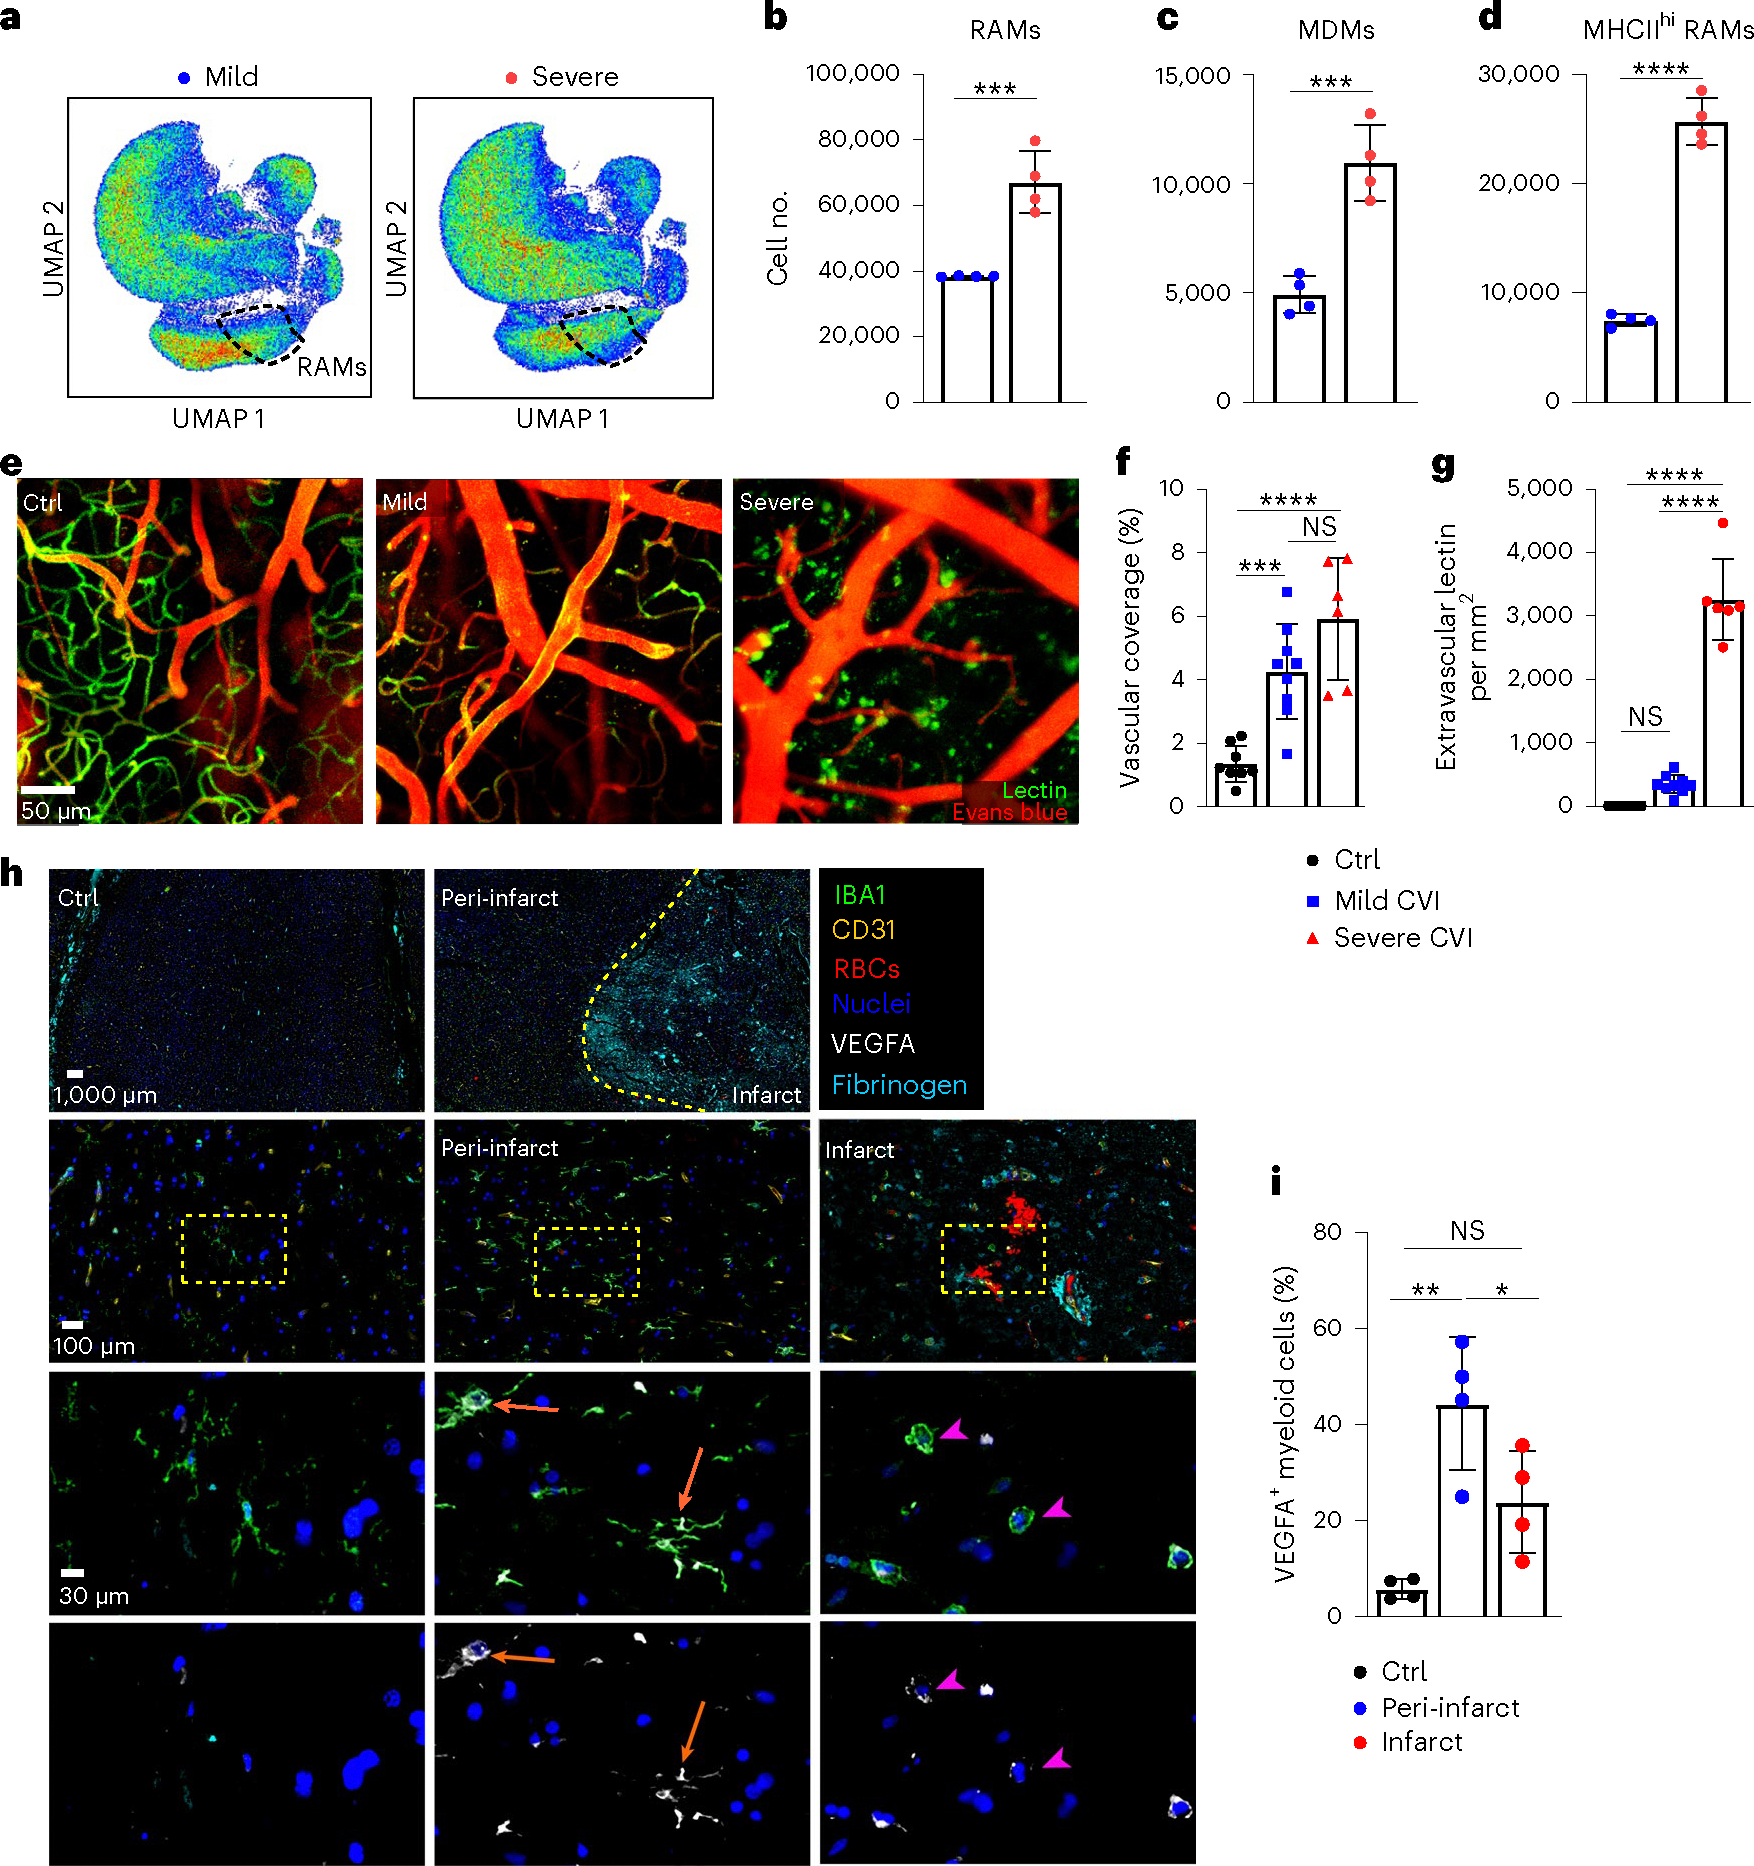
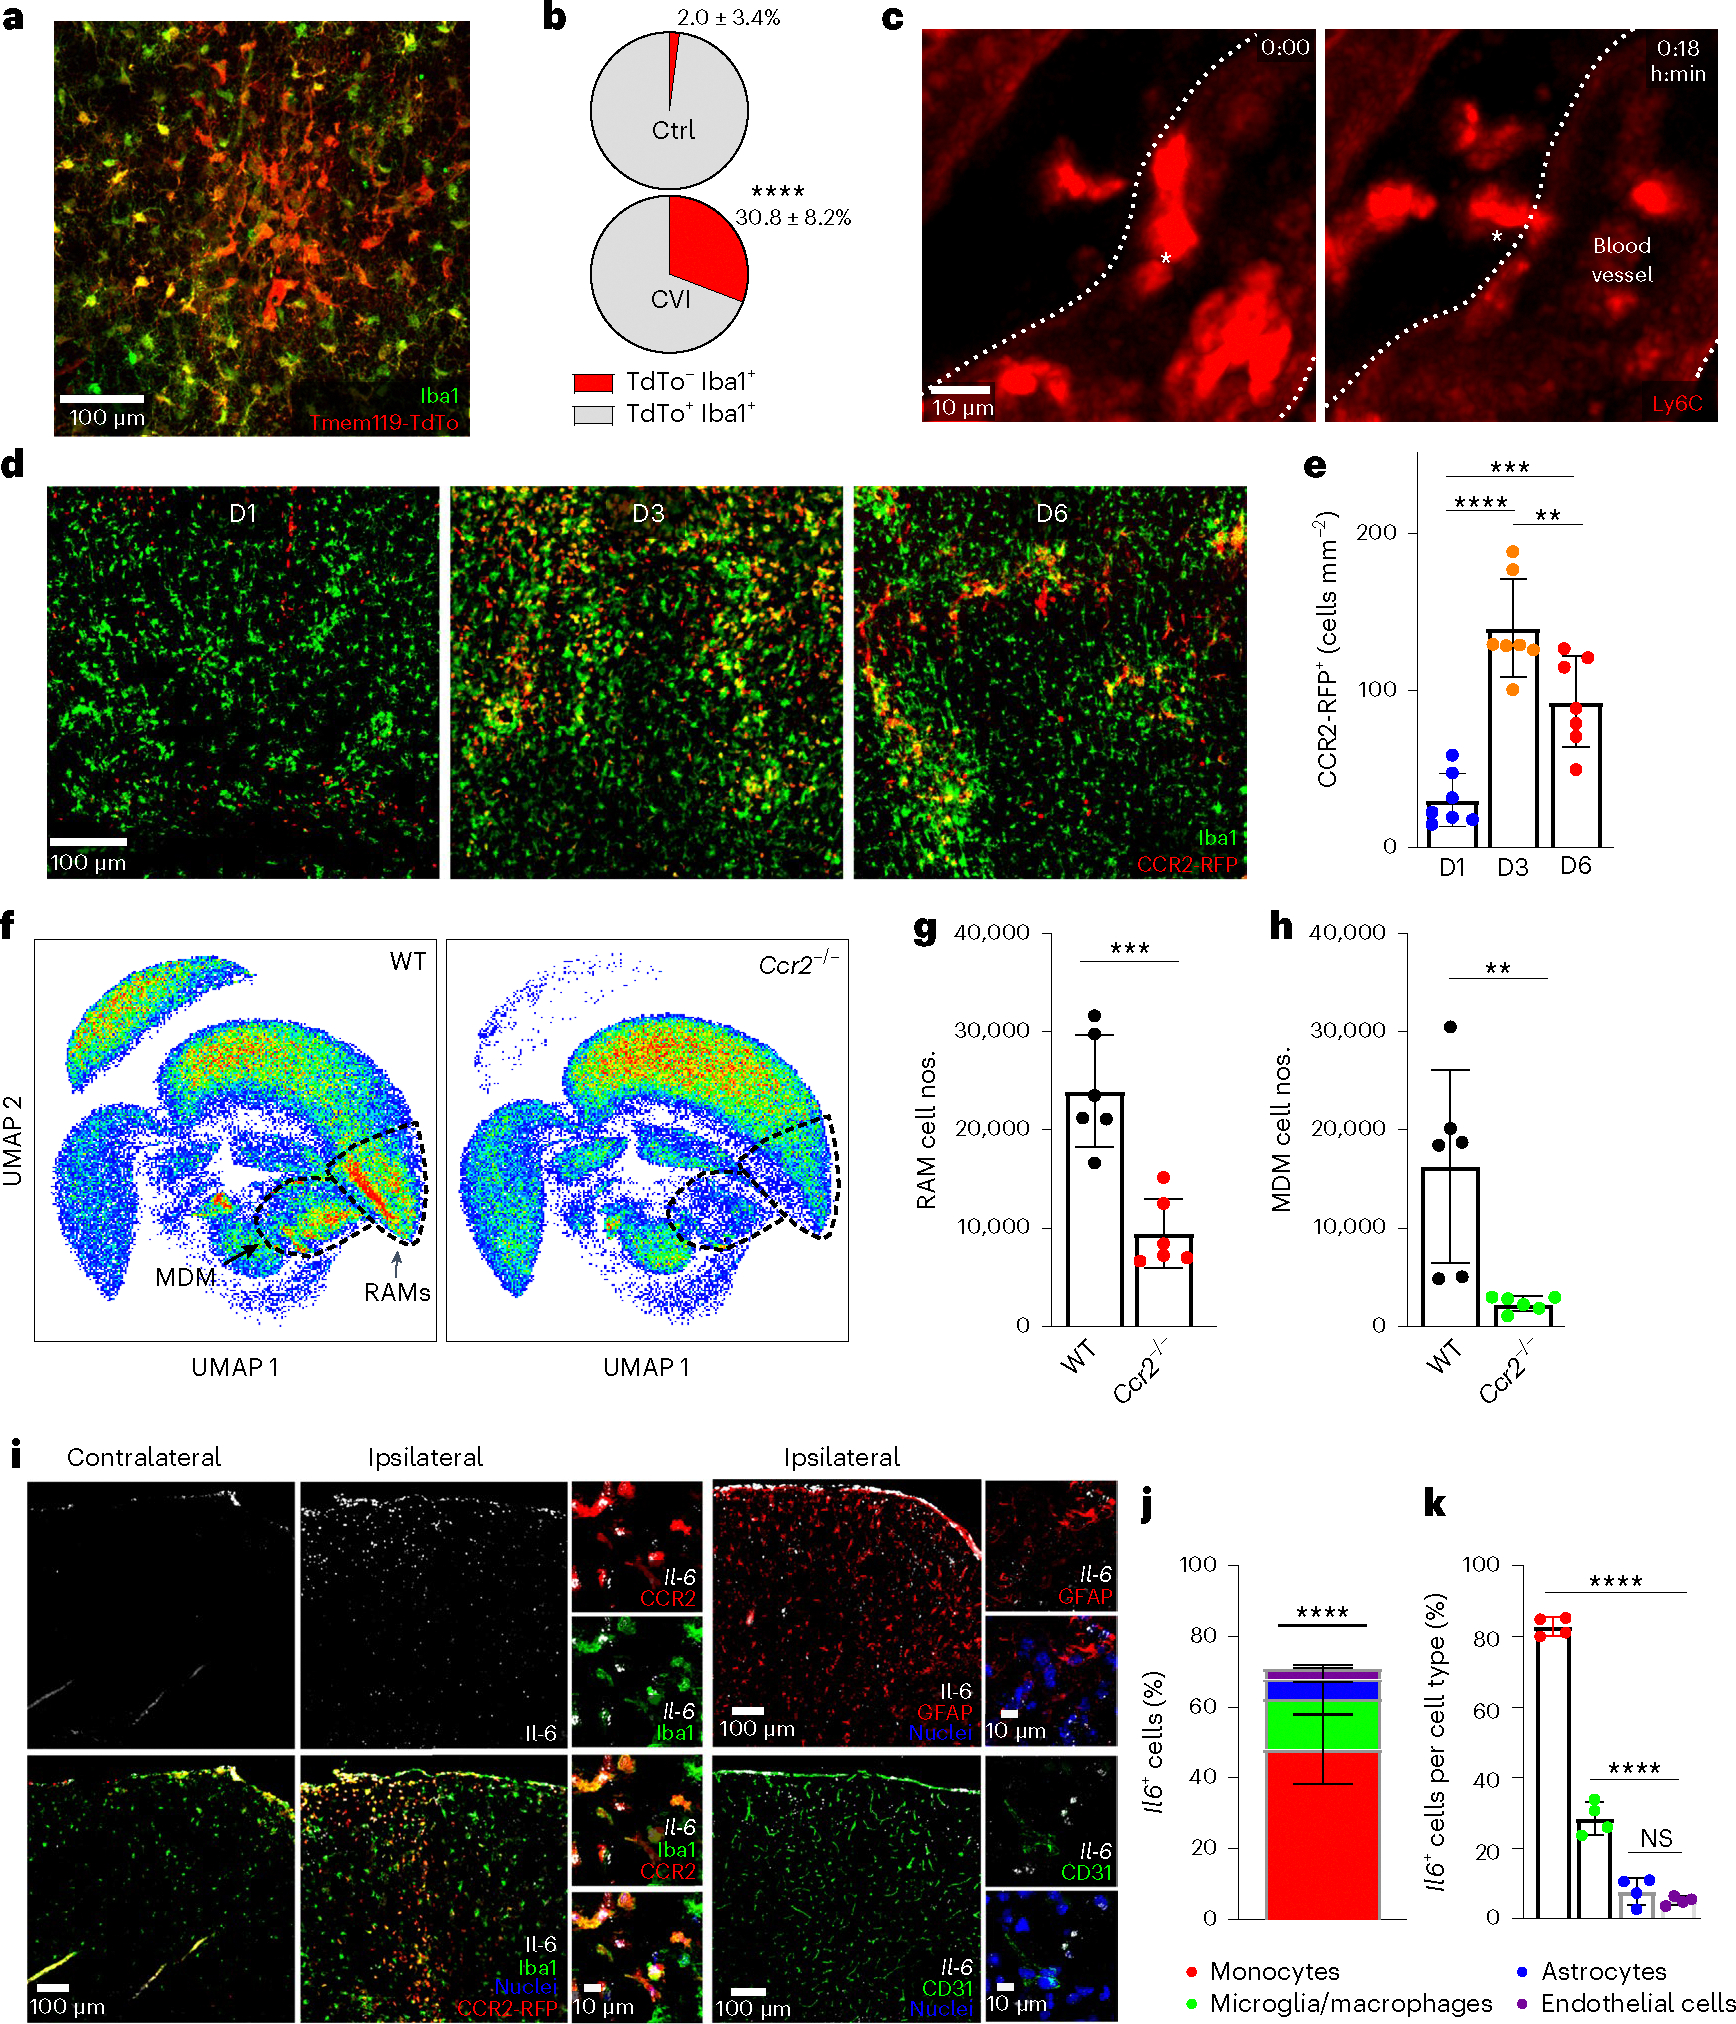
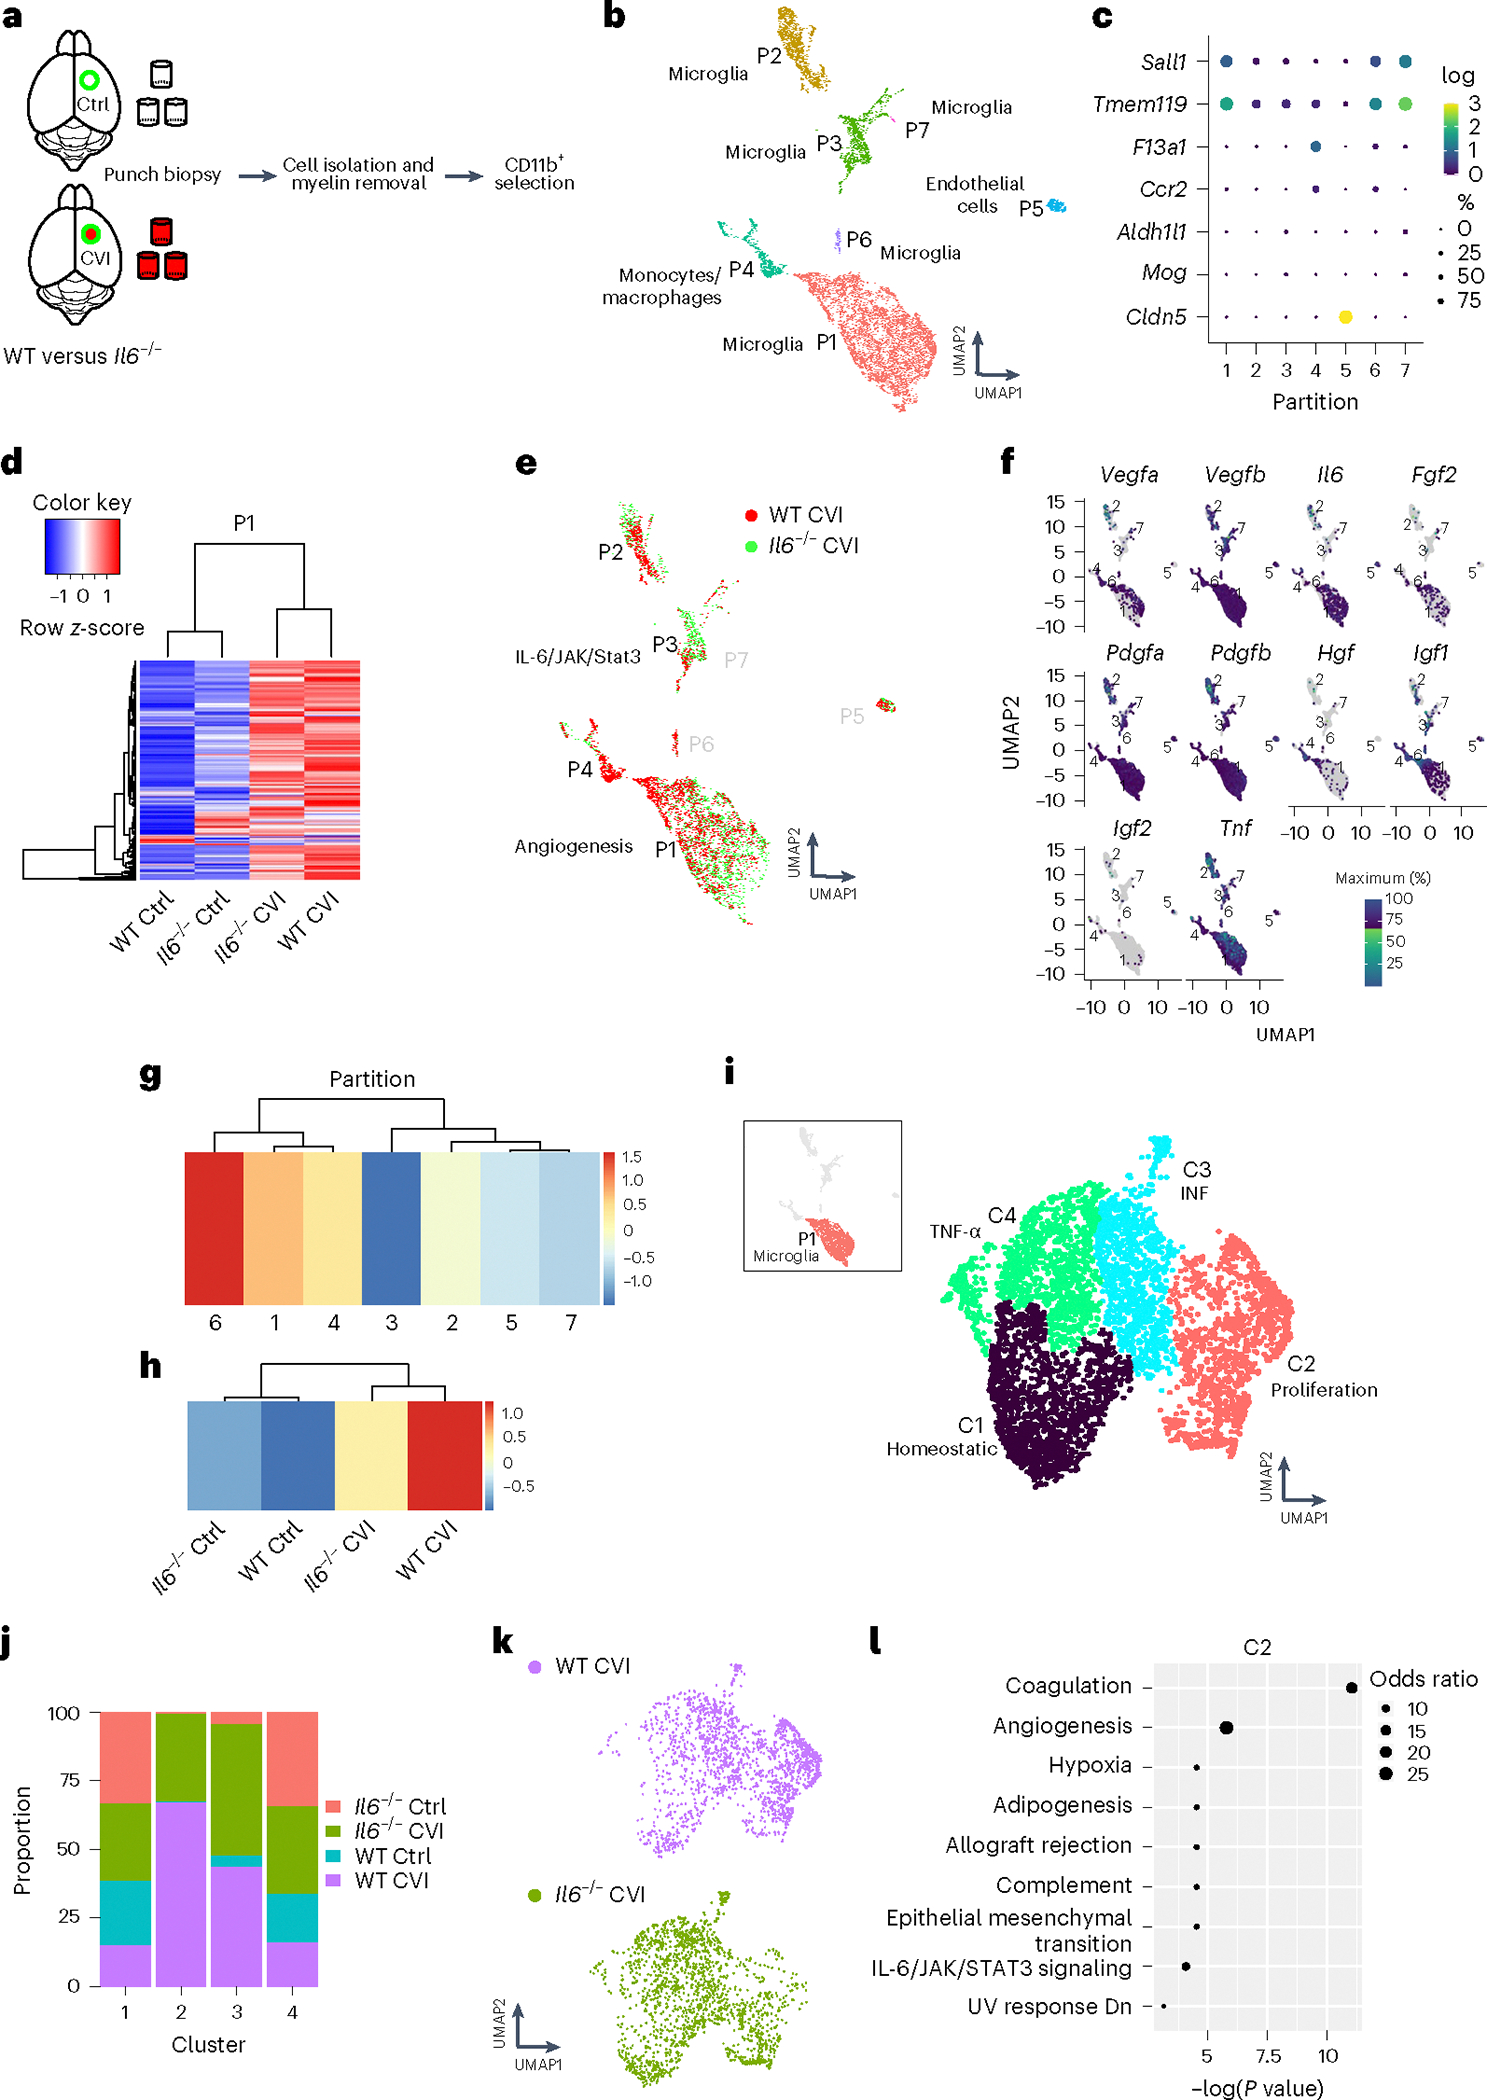
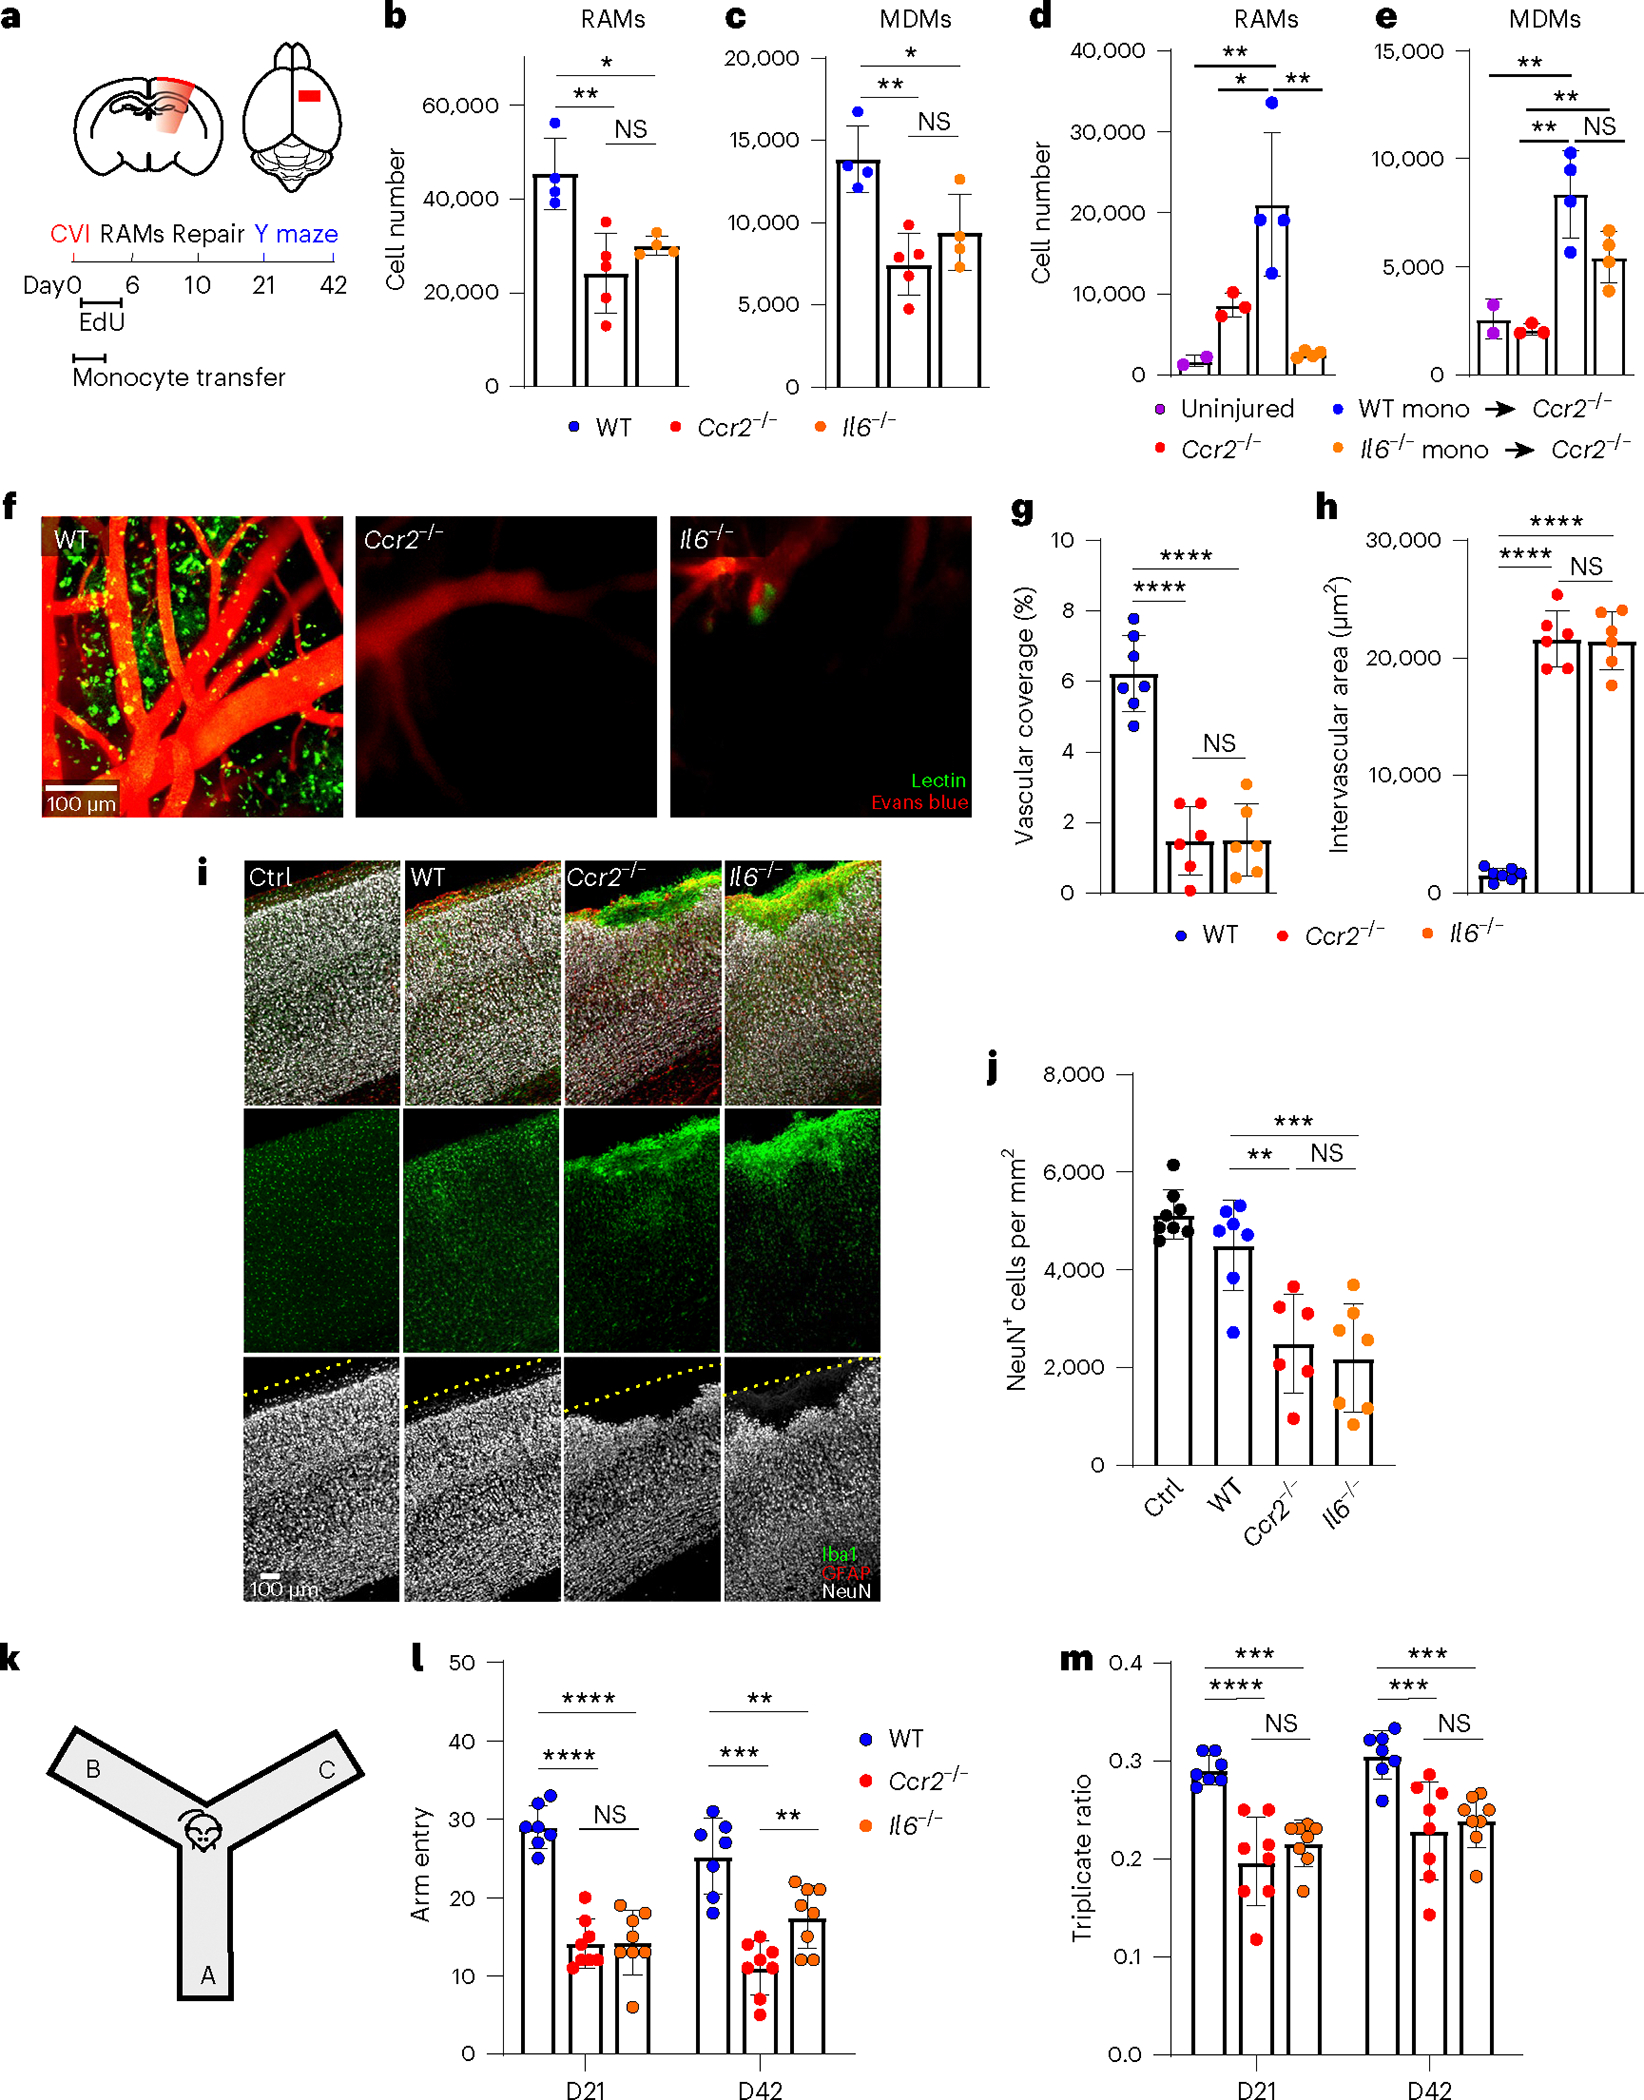
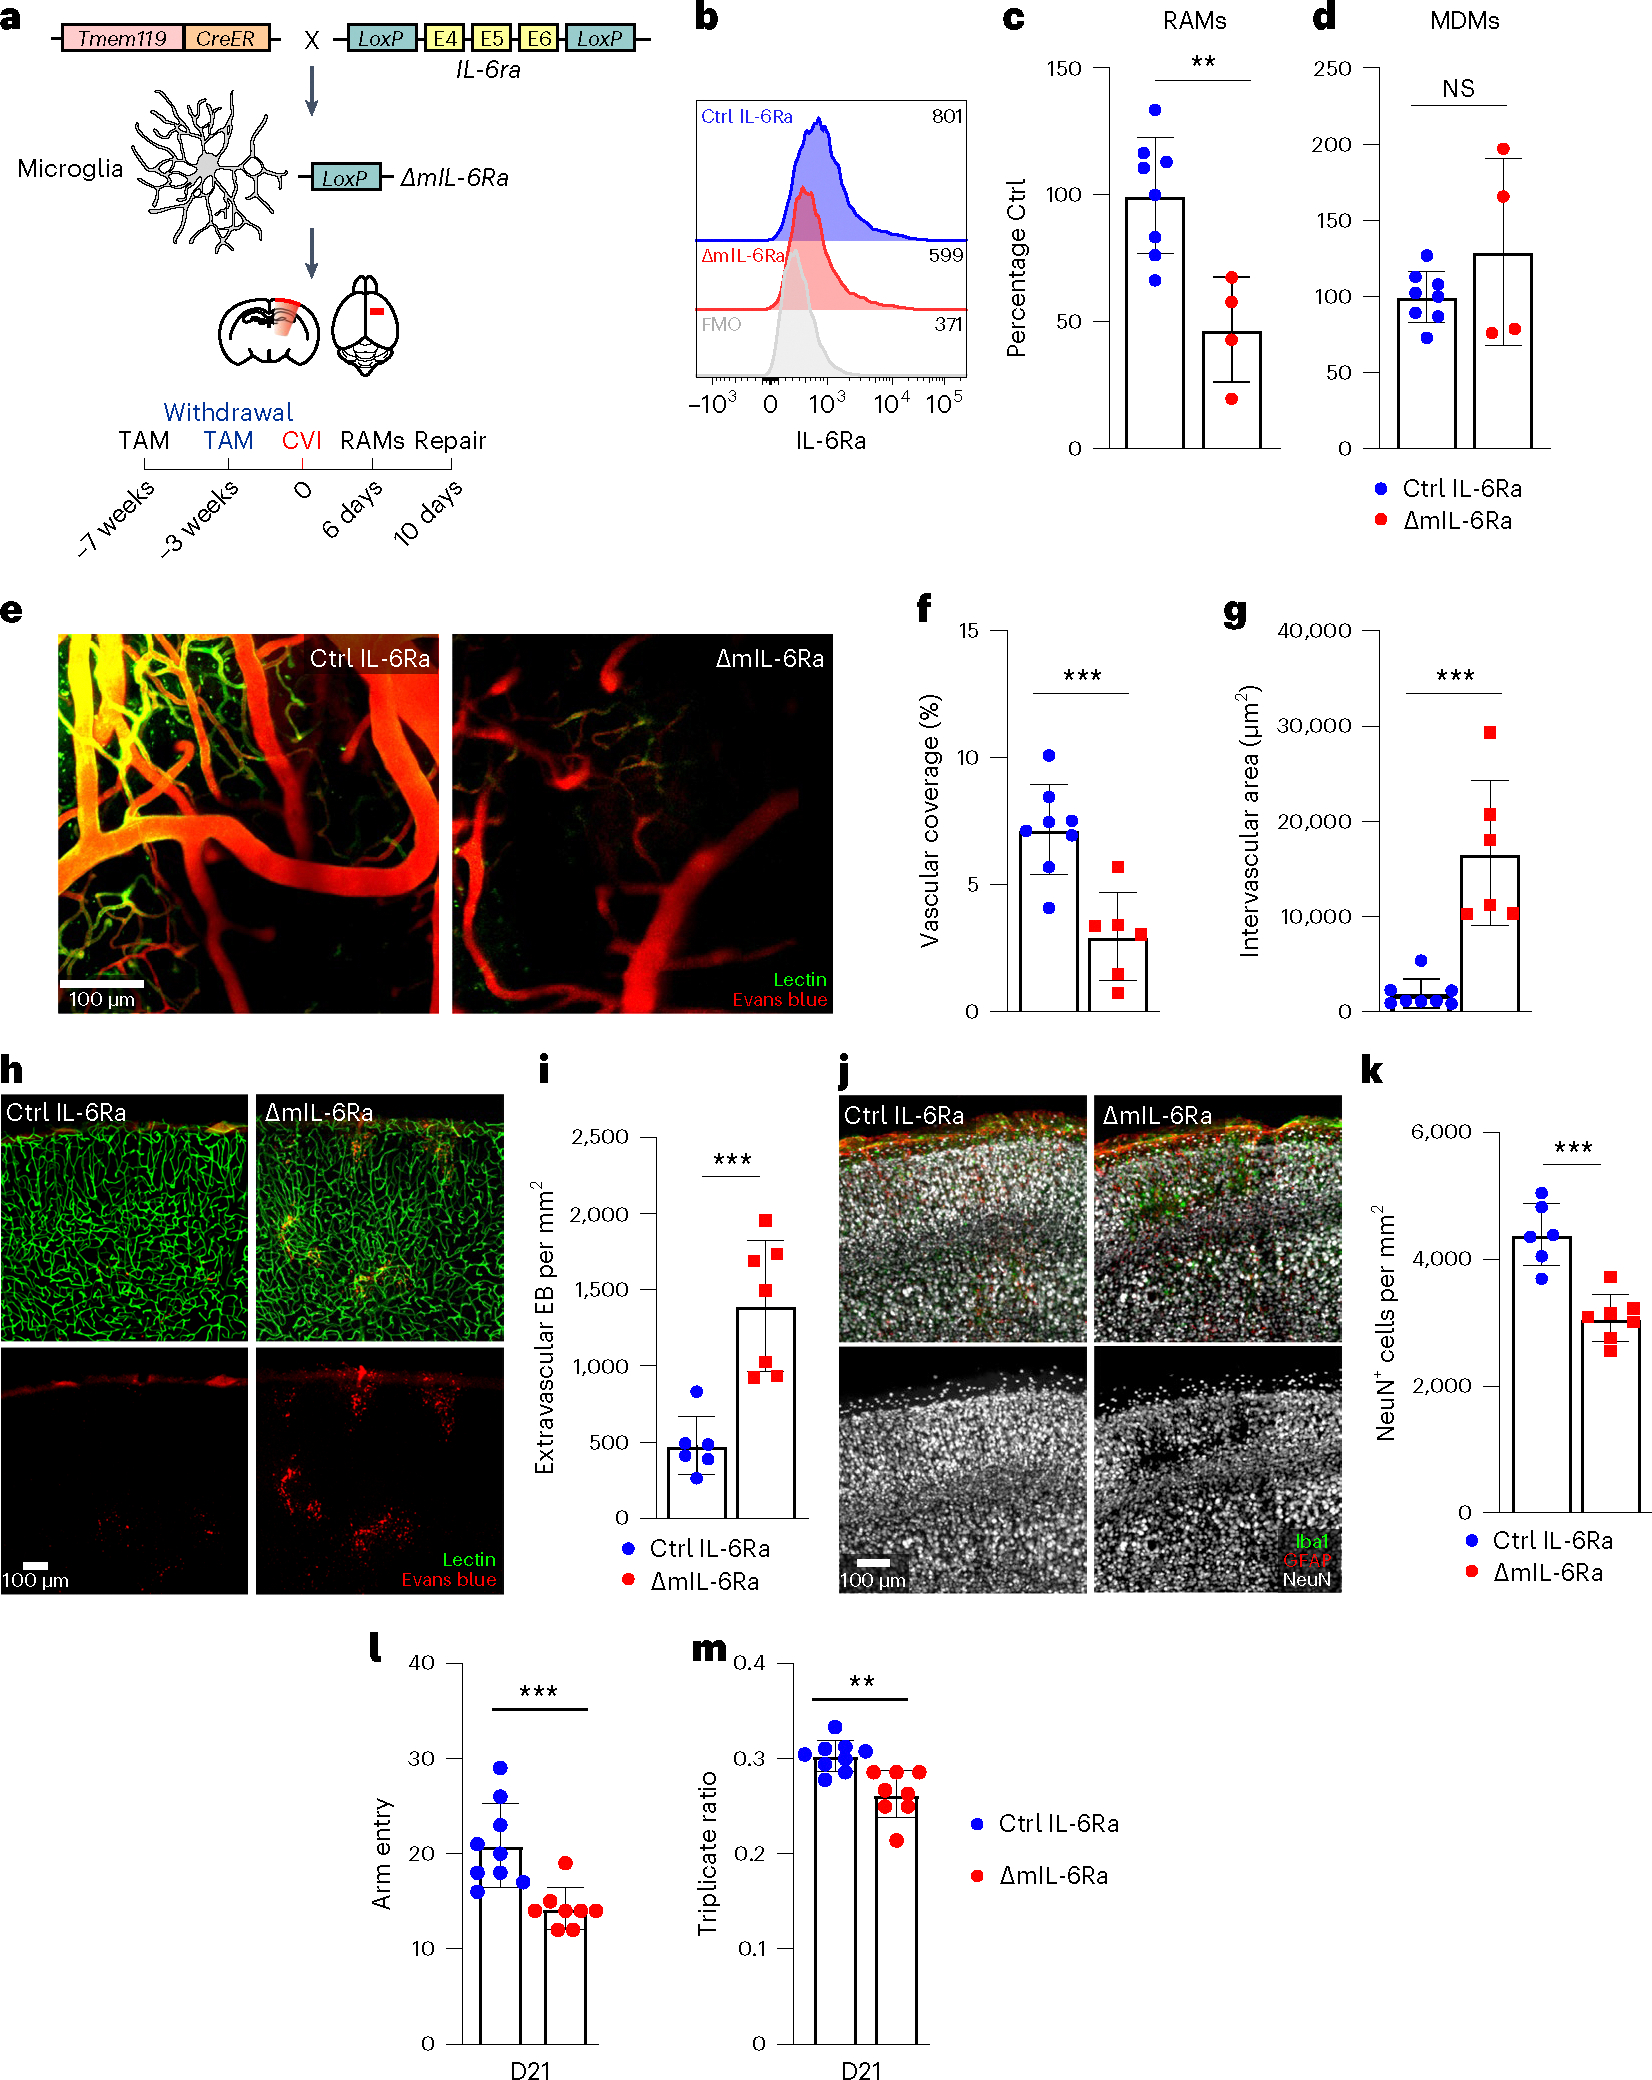
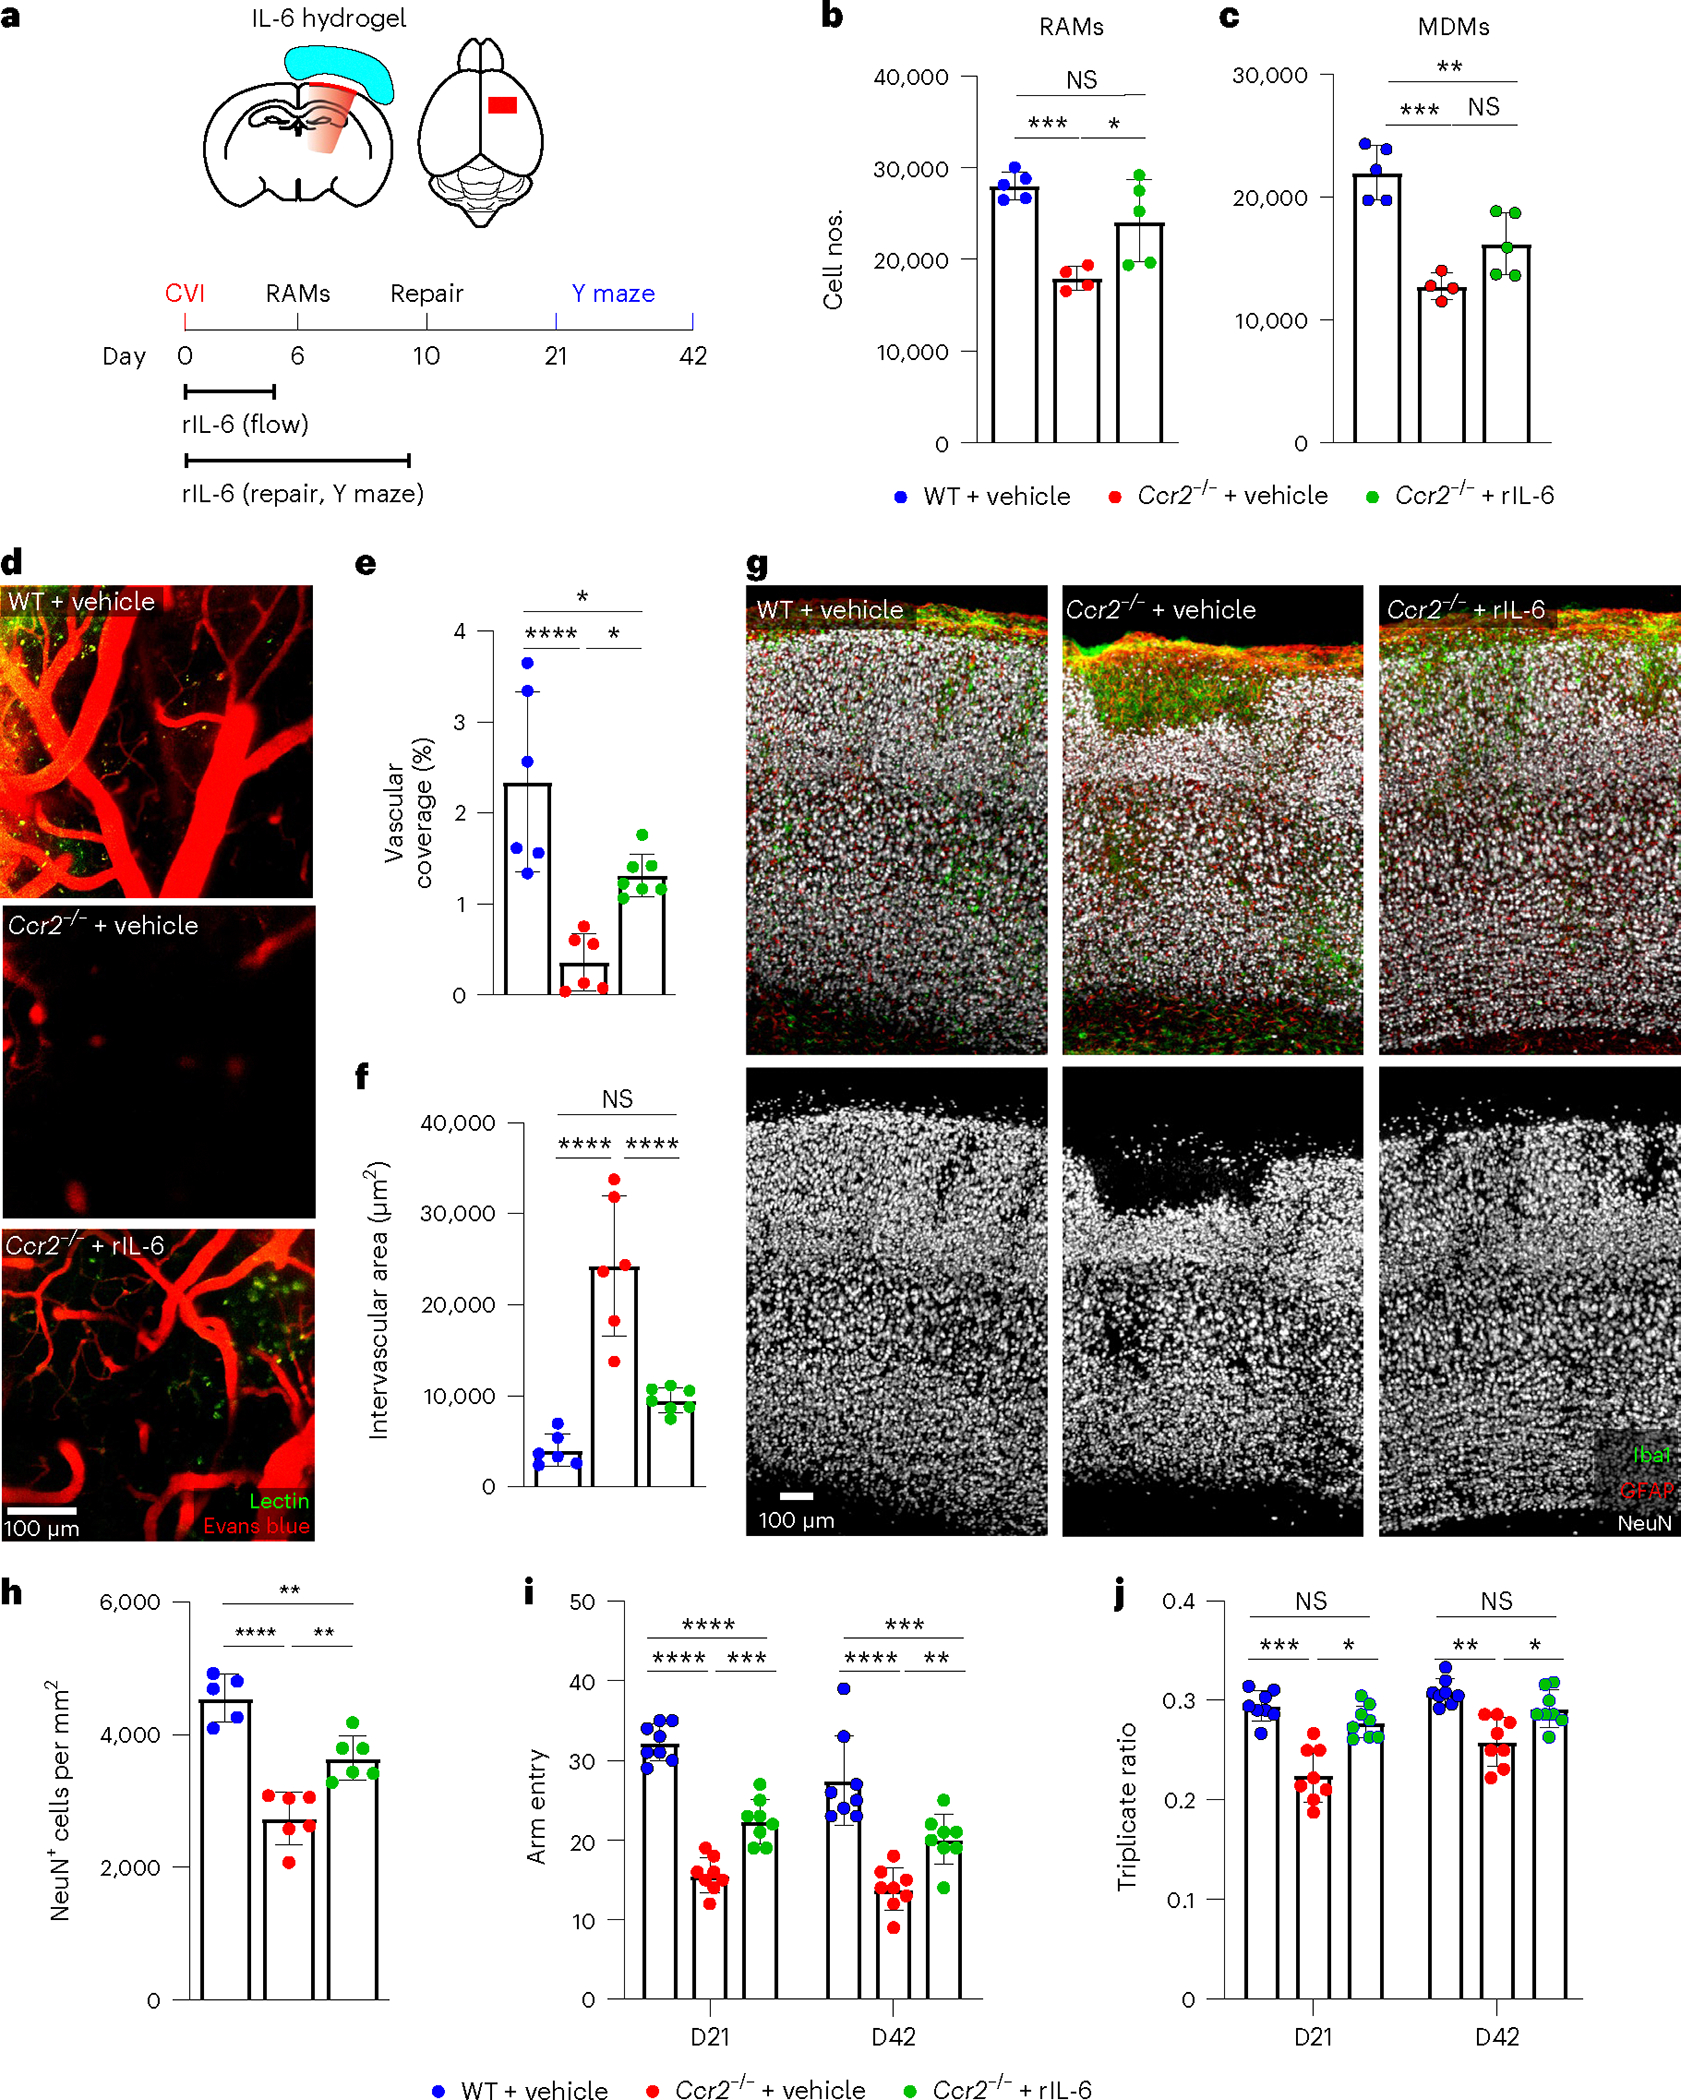
Cerebrovascular injury (CVI) is a common pathology caused by infections, injury, stroke, neurodegeneration and autoimmune disease. Rapid resolution of a CVI requires a coordinated innate immune response. In the present study, we sought mechanistic insights into how central nervous system-infiltrating monocytes program resident microglia to mediate angiogenesis and cerebrovascular repair after an intracerebral hemorrhage. In the penumbrae of human stroke brain lesions, we identified a subpopulation of microglia that express vascular endothelial growth factor A. These cells, termed 'repair-associated microglia' (RAMs), were also observed in a rodent model of CVI and coexpressed interleukin (IL)-6Ra. Cerebrovascular repair did not occur in IL-6 knockouts or in mice lacking microglial IL-6Ra expression and single-cell transcriptomic analyses revealed faulty RAM programming in the absence of IL-6 signaling. Infiltrating CCR2+ monocytes were the primary source of IL-6 after a CVI and were required to endow microglia with proliferative and proangiogenic properties. Faulty RAM programming in the absence of IL-6 or inflammatory monocytes resulted in poor cerebrovascular repair, neuronal destruction and sustained neurological deficits that were all restored via exogenous IL-6 administration. These data provide a molecular and cellular basis for how monocytes instruct microglia to repair damaged brain vasculature and promote functional recovery after injury.


Conflict of interest statement

Competing interests

The authors declare no competing interests.

Figures

Extended Data Fig. 1 |
Extended Data Fig. 1 |. Identification of microglia in Tmem119-TdTo reporter mice.
a, Immunofluorescent staining for Tmem119 (green) and TdTo (red) of neocortex from a naïve Tmem119-TdTo mouse. Inset depicts an enlarged area of the image. b, Bar graph shows quantification of TdTo+ Tmem119+ microglia after tamoxifen treatment (n = 5 mice). c, Histograms show TdTo expression on CD45+ CD11b+ cells harvested from the brains of uninjured (Ctrl) WT mice (n = 4) as well as uninjured (n = 4) and D6 post-CVI (n = 4) Tmem119-TdTo mice. Each histogram represents concatenated samples for the entire group. Data are representative of two independent experiments. d, Histograms show TdTo expression in CD45+ CD11b+ myeloid cells isolated from the brain (n=8), meninges (n=6) and spleen (n=8) of uninjured and D6 post-CVI Tmem119-TdTo mice. The histogram represents a concatenation of both uninjured and injured samples. Data are representative of two independent experiments. Dashed lines in panels c and d denote the cut-off value for cells with TdTo positivity. Note that meningeal macrophages have more background fluorescence in this channel than splenic macrophages. e, Bar graph shows the absolute number of TdTo+ cells in the denoted tissues from uninjured Ctrl (blue) and D6 post-CVI (red) Tmem119-TdTo mice in panel c and d. (****P<0.0001; two-way ANOVA with Šídák’s multiple comparisons test). f, Gating strategy for flow cytometric analysis of leukocytes isolated from the brains of Tmem119-TdTo mice following CVI. g, Histogram shows TdTo expression in the indicated cell populations, identified using the gating strategy from panel f, from the brains of Tmem119-TdTo mice (n = 5) at D6 post-CVI. h, Bar graph shows the absolute number of the denoted cell types from the brains of uninjured Ctrl (n=4) versus D6 post-CVI (n = 4) Tmem119-TdTo mice. (****P<0.0001; two-way ANOVA with Šídák’s multiple comparisons test). Data are representative of two independent experiments. i, Representative TdTo expression (red) on a coronal brain section from a Tmem119-TdTo mouse (n=3) at D6 post CVI. Data are representative of two independent experiments. j, Pie chart depicts the percentage of VEGFA+ microglia (mean+SEM, red) among total CD11b+ CX3CR1+ TdTo+ microglia obtained from the punch biopsies of injured brains (n=4) at D6 post CVI described in Fig. 1i. k, A dimensionality reduction plot (top) generated using Cluster Explorer depicts three RAM clusters (shades of purple) identified in the brains of Tmem119-TdTo mice (n=4) at D6 post-CVI. Data are representative of two independent experiments. A representative dot plot (bottom) shows expression of VEGFA and IL-6Ra by the three RAM clusters identified in D6 Tmem119-TdTo mice. Arbitrary gating was used to analyze marker expression in panel l. Specifically, RAM were stratified based on low, intermediate, and high VEGFA and IL-6Ra co-expression: VEGFAlo IL-6Ralo (green), VEGFAint IL-6Raint (cyan), VEGFAhi IL-6Rahi (red). l, Histograms show expression of the indicated markers and FSC-A by the three RAM subpopulations identified in panel k. All graphs show mean ± SEM. Dots represent individual mice.
Extended Data Fig. 2 |
Extended Data Fig. 2 |. Mild versus severe CVI in mice and immunohistochemical staining of human brain tissue.
a, Dimensionality reduction plots generated using Cluster Explorer show RAM (blue), MHC IIhi RAM (red), non-RAM microglia (gray), and MDM (green) in Tmem119-TdTo mice on D6 post CVI. Plots show concatenated samples obtained from mild (n=4) and severe (n=4) WT CVI mice described in Fig. 2. The gating strategy for the different myeloid subsets is described in Fig. 2b–d. Data are representative of two independent experiments. b, Histograms show expression of the indicated markers by the different myeloid cell populations (a). c, Bar graph shows the percentage of MHCII+ VEGFA+ microglia in the brains of D6 Tmem119-TdTo mice described in Fig. 2a–d following mild versus severe CVI (****P<0.0001; two-tailed unpaired t test). d, Immunofluorescent staining of neocortical vasculature in uninjured Ctrl (n=8) as well as mild (n=6) and severe (n=7) CVI mice at day 10. Lectin (green) and Evans blue (red) were injected i.v. to visualize vessels and BBB disruption. e, Quantification showing numbers of extravasated dye among the groups of animals (Ctrl=8, mild CVI=6, and severe CVI=7). Data are combined from two independent experiments. (****P<0.0001; one-way ANOVA with Tukey’s test). All graphs show mean ± SEM. Dots represent individual mice. f, Multiplex immunostaining of human stroke (n=4) versus Ctrl (n=4) brain tissue (see Supplementary Table 1) showing expression of IBA1, CD31, glycophorin A (red blood cells, RBCs), VEGF-A, fibrinogen, and DAPI (cell nuclei). All images are comparably scaled. The magnified images in the bottom of each image depict VEGF-A (white) expression in IBA1+ myeloid cells (green).
Extended Data Fig. 3 |
Extended Data Fig. 3 |. Single cell RNA-seq analysis of WT vs Il6−/− CVI mice.
a-b, UMAPs show overlays of all single cell partitions for uninjured Ctrl versus WT D6 CVI (a) and WT CVI versus Il6−/− CVI mice (b). c-d, Bar graphs depict the number (c) and percentage (d) of cells corresponding to each mouse group for the 7 different partitions. e, UMAP inset shows an overlay of WT CVI versus Il6−/− CVI mice for all partitions. Top pathways are also shown based on gene set enrichment analysis of DEGs (Q<0.05) between injured WT versus Il6−/− mice in P1. Only statistically significant pathway terms are plotted on the graph (P<0.05; Fisher exact test), and dot size represents the odds ratio. f, Bar graph shows statistical significance (−log q value; blue) and the expression level (log2 fold change; red) for genes involved in angiogenesis, the top-rated signaling pathway from gene set enrichment analysis in (e). g, Heatmap shows the mean expression of genes associated with angiogenesis for injured WT and Il6−/− mice. The color legend (right) depicts the gene expression level. h-j, Top pathways are shown based on gene set enrichment analysis of DEGs (Q<0.05) between uninjured and injured WT mice in P1 C2 (h), 3 (i), and 4 (j). Only statistically significant pathway terms are plotted on the graphs (P<0.05; Fisher exact test), and dot size represents the odds ratio. k, Bar graph shows statistical significance (−log q value; blue) and the expression level (log2 fold change; red) for genes involved in angiogenesis for C2 vs C1, 3, and 4 within P1. l, Heatmap shows the mean expression of genes associated with angiogenesis in panel k.
Extended Data Fig. 4 |
Extended Data Fig. 4 |. Analysis of signaling pathways in microglia partitions identified by scRNA-seq.
a-b, UMAP insets show all partitions and the location of P2 (a) and 3 (b). Dot plots depict the top pathways in the respective partitions based on gene set enrichment analysis of DEGs (Q<0.05) between WT Ctrl and CVI mice. Dot size corresponds to the odds ratio. Only statistically significant pathways (P<0.05) are shown on the graph. Pathways are ordered based on the negative log of the P value multiplied by the corresponding Z score. The top ranked pathways are listed next to the UMAP insets. c, Heatmaps show mean expression levels of genes associated with IL-6/JAK/Stat3 signaling between WT and Il6−/− CVI mice for P1, 2, and 3. The color legend (right) depicts the gene expression level. d, UMAP plot shows differentiation trajectories for P1, 2, and 3 microglia. Individual dots represent single cells and the distance between two cells infers transcriptional similarity. Black traces represent trajectory branches. Each light grey circle denotes a different outcome of the trajectory. Black circles indicate branch nodes, from which cells can move to one of the denoted outcomes.
Extended Data Fig. 5 |
Extended Data Fig. 5 |. scRNA-seq analysis of macrophages and flow cytometric purity of sorted monocytes.
a, UMAP shows all partitions and the location of P4, which corresponds to macrophages. The top ranked pathway in P4 is noted above the UMAP. b, UMAPs depict expression of F13a1 and Tmem119 in all partitions. c, Pearson correlation-based clustered heatmap using DEGs (Q<0.05) between WT Ctrl and CVI mice in P4. The color legend reflects the Z score. d, Dot plot depicts the top pathways in P4 based on gene set enrichment analysis of DEGs (q<0.05) between WT and Il6−/− CVI mice. Dot size corresponds to the odds ratio. Only statistically significant pathways (P<0.05) are shown on the graph. Pathways are ordered based on the negative log of the P value multiplied by the corresponding Z score. e, Bar graph shows statistical significance (−log q value; blue) and the expression level (log2 fold change; red) for genes involved in TNFα signaling, the top-rated signaling pathway from gene set enrichment analysis in (d). Asterisks denote suppressor genes. f, Heatmap shows mean expression levels of genes in (e) for WT and Il6−/− CVI mice. The color legend (right) depicts the gene expression level. g, Gating strategy used for flow cytometric analysis of purified bone marrow-derived monocytes (CD11b+ Ly6C+ CX3CR1+ CD3 Siglec F NK1.1 Ly6G CD117 CD220) from WT or Il6−/− mice that were adoptively transferred into Ccr2−/− recipients as described in Fig. 5d,e.
Extended Data Fig. 6 |
Extended Data Fig. 6 |. Quantification of cell proliferation and vascular leakage after CVI.
a-d, Representative confocal images from the neocortex stained for Iba1 (green) and EdU (white) (a) or CD31 (red) and EdU (white) (c). Bar graphs show the number of EdU+ Iba1+ cells (b) and EdU+ CD31+ cells (d) in uninjured WT Ctrl (n=9) versus D6 post-CVI WT (n=15), Ccr2−/− (n=7), and Il6−/− (n=7) mice at D6 post-CVI. Data are combined from two independent experiments. (**P<0.01, ***P<0.001, ****P<0.0001; one-way ANOVA with Tukey’s test). e-g, Representative confocal images from the neocortex stained for Iba1 (green), Tmem119-TdTo (red), CCR2-RFP (red), and EdU (white). Bar graphs show the number (f) and percentage (g) of EdU+ cells that are myeloid (green), microglia (red), and monocytes (blue) based on analysis of WT (n=8), Tmem119-TdTo (n=6), and CX3CR1gfp/+ CCR2rfp/+ (n=7) mice at D6 post-CVI. Data are combined from two independent experiments. (*P<0.05, ***P<0.001, ****P<0.0001; one-way ANOVA with Tukey’s test). h, Representative intravital TPM images captured through the thinned skull of uninjured WT Ctrl (n=8) versus CVI WT (n=8), Ccr2−/− (n=8), and Il6−/− (n=8) mice at D10 post-mild CVI. Tomato lectin (green) and Evans blue (red) were injected i.v. to visualize vasculature and dye extravasation. i, Bar graph depicts quantification of extravasated tomato lectin based on the dataset in (h). Data are combined from two independent experiments. (*P<0.05, ****P<0.0001; one-way ANOVA with Tukey’s test). j, Representative confocal images from the neocortex of uninjured WT Ctrl (n=7) versus D6 post-CVI WT (n=5), Ccr2−/− (n=6), and Il6−/− (n=6) mice at D10 post-CVI show i.v. injected tomato lectin (green) and Evans blue (red). k, Bar graph shows quantification of extravasated Evans blue (EB) based on the dataset shown in (j). Data are combined from two independent experiments. (*P<0.05, ***P<0.001; one-way ANOVA with Tukey’s test). All graphs show mean ± SEM. Dots represent individual mice.
Extended Data Fig. 7 |
Extended Data Fig. 7 |. Evaluation of Y-maze performance in uninjured mice and quantification of type 1 collagen deposition and Evans blue leakage after CVI.
a, Representative confocal images from the neocortex of WT (n=7), Ccr2−/− (n=7), and Il6−/− (n=7) mice at D10 post-CVI show staining for CD31 (green) and collagen type 1 (red). b, Bar graph shows quantification of collagen type 1 based on the dataset shown in (a). Data are combined from two independent experiments. (*P<0.05, **P<0.01; one-way ANOVA with Tukey’s test). c, Representative confocal images from the neocortex of WT (n=7), Ccr2−/− (n=7), and Il6−/− (n=7) mice at D10 post-CVI show staining for CD31 (green) and i.v. injected Evans blue (white). d, Bar graph shows quantification of extravasated Evans blue (EB) based on the dataset shown in (c). Data are combined from two independent experiments. (*P<0.05, ***P<0.001; one-way ANOVA with Tukey’s test). All graphs show mean ± SEM. Dots represent individual mice. e-f, Bar graphs demonstrate the total number of Y maze arm entries (e) and the triplicate ratio (f) for uninjured WT (n=6), Ccr2−/− (n=10), and Il6−/− (n=8) mice. Data are from a single experiment. All graphs show mean ± SEM (one-way ANOVA with Tukey’s test). Dots represent individual mice.
Fig. 1 |
Fig. 1 |. CVI induces RAM generation.
a, Schematic representation of CVI induction (red) in the mouse brain from a coronal (top left) and axial (top right) view. The timeline shows when tamoxifen (TAM) chow was administered and withdrawn in relation to CVI and RAM analysis. b, Time-lapse images from a Tmem119-TdTo mouse (n = 4) imaged by TPM through a thinned-skull window showing the acute microglial response to a CVI. Fluorescent tomato lectin (red, pseudocolored) was injected i.v. to visualize vessels and extravasated material from the blood. Microglia (green, pseudocolored) rapidly extended processes toward a damaged vessel (white arrowheads) and interacted with extravasated, lectin-derived material within minutes post-CVI (cyan arrowheads). The data represent two independent experiments (see Supplementary Video 1). c, Immunofluorescent staining for VEGFA (white) in the neocortex of a Tmem119-TdTo mouse on day 6 post-CVI. The magnified image in the right panel is denoted by a dotted green box in the left panel. Microglia (red) express VEGFA in their cell bodies and distal processes (cyan arrowheads). d,e, Bar graphs show the number of microglia (d) and VEGFA-expressing microglia (e) in the injured ipsilateral (Ipsi) versus uninjured contralateral (Contra) hemisphere at day 6 post-CVI in Tmem119-TdTo mice (n = 8). Combined data from two independent experiments are shown in ce. f, Immunofluorescent staining for IL-6Ra (red), VEGFA (white) and Iba1 (green) in the neocortex of B6 mice on day 6 post-CVI relative to uninjured controls (Ctrl). CVI induced IL-6Ra expression in microglia, some of which coexpressed VEGFA (yellow boxes 1 and 2). Boxed areas are enlarged on the far right. g,h, Bar graphs depicting quantification of IL-6Ra+ (g) and IL-6Ra+VEGFA+ (h) microglia in uninjured Ctrl (n = 8) versus CVI (n = 7) mice. Combined data from two independent experiments are shown in fh. i, UMAP plots showing high-parameter flow cytometry data of leukocytes extracted from punch-biopsied brains of injured (n = 4) versus uninjured (Ctrl, n = 4) Tmem119-TdTo mice at day 6 post-CVI. Dashed lines delineate RAMs based on the expression of markers identified using Cluster Explorer (see Extended Data Fig. 1k). jl, Bar graphs showing the absolute number of RAMs (TdTo+VEGFA+IL-6Ra+CD24+CD44+CD206+CD11c+Ly6clo/intMHCIIloCX3CR1+CD11b+CD45lo/int) (j), non-RAMs (TdTo+VEGFAIL-6RaCD24CD44CD206CD11cLy6cMHCIIloCX3C R1+CD11b+CD45lo) (k) and MDMs (TdToCD24+CD44+CD206+CD11c+Ly6c+CX3CR 1+CD11b+CD45+) (l) for the groups denoted in i. Data represent two independent experiments. All graphs show mean ± s.e.m. and dots represent individual mice. ***P < 0.0005, ****P < 0.0001; two-tailed, unpaired Student’s t-test. NS, not significant.
Fig. 2 |
Fig. 2 |. RAMs increase with lesion severity and are observed in human stroke brains.
a, Representative UMAPs depicting high-parameter flow cytometry data of leukocytes isolated from the brains of day 6 mild (n = 4) versus severe (n = 4) CVI Tmem119-TdTo mice by punch biopsy. The dashed lines denote RAMs. bd, Bar graphs show the absolute number of RAMs (TdTo+VEGFA+IL-6Ra+CD24+CD44+CD206+CD11c+Ly6clo/intMHCIIloCX3CR1+CD11b+CD45lo/int) (b), MHCIIhi RAMs (TdTo+VEGFA+IL-6Ra+CD24+CD44+CD206+CD11c+Ly6c+MHCIIhiCX3 CR1+CD11b+CD45+) (c) and MDMs (TdToCD24+CD44+CD206+CD11c+Ly6c+CX3CR 1+CD11b+CD45+) (d) for the groups indicated in a. Data represent two independent experiments. ***P < 0.0005, ****P < 0.0001; two-tailed, unpaired Student’s t-test. e, Representative maximal projection images captured by intravital TPM showing vasculature in the superficial neocortex of uninjured Ctrl (n = 8) versus day 10 mild (n = 9) and severe (n = 6) CVI mice. Tomato lectin (green) and EB (red) were injected i.v. before imaging. f,g, Bar graphs showing quantification of percentage vascular coverage (f) and the amount of extravasated tomato lectin (g) in the mice from e. Data are combined from two independent experiments. ***P < 0.0005, ****P < 0.0001; one-way ANOVA with Tukey’s test. In bg, the dots represent individual animals. h, Representative multiplex immunostaining of human stroke (n = 4) brain tissue (patient ID AN-060–37) versus Ctrl (n = 4) brain tissue (patient ID 85747) without neurological disease (Supplementary Table 1). Tissue was stained with antibodies directed against VEGFA (white), IBA1 (green), RBCs, CD31 (yellow) and fibrinogen (cyan). Cell nuclei are blue. The dashed yellow line denotes a border between infarct core and peri-infarct penumbrae. The dotted yellow boxes denote the location of enlarged images below. The orange arrows point to IBA1+ cells with a ramified microglial morphology that express VEGFA in peri-infarct stroke tissue. The pink arrowheads denote spherical IBA1+ cells expressing low amounts of VEGFA in the stroke lesion core. i, Bar graph showing quantification of the percentage VEGFA+IBA1+ myeloid cells in Ctrl, peri-infarct and infarct ROIs from Ctrl (n = 4) and stroke (n = 4) brain tissues. Individual dots denote the average of percentage VEGFA+IBA1+ myeloid cells from one to three ROIs per specimen analyzed (see Extended Data Fig. 2f). *P < 0.05, **P < 0.005; one-way ANOVA with Tukey’s test. All graphs show mean ± s.e.m.
Fig. 3 |
Fig. 3 |. Infiltrating monocytes produce IL-6 and are critical for RAM generation.
a, Immunofluorescent staining for Iba1 (green) and TdTo (red) in the neocortex of a Tmem119-TdTo mouse on day 6 post-CVI. Data represent two independent experiments. b, Pie charts depicting the proportion of TdToIba1+ (monocytes/macrophages, red) and TdTo+ Iba1+ (microglia, gray) in the brains of uninjured Ctrl (n = 8) versus injured (n = 7) mice. Data represent two independent experiments. ****P < 0.0001; two-tailed, unpaired Student’s t-test. c, Time-lapse intravital TPM images showing monocyte extravasation into the parenchyma at day 2 post-CVI (n = 3 mice). The white asterisk denotes a Ly6c+ monocyte (red) extravasating from a blood vessel (demarcated by white dotted lines) into the parenchyma (Supplementary Video 2). d, Immunofluorescent staining for Iba1 (green) and RFP (red) in brains of CX3CR1gfp/+CCR2rfp/+ (n = 7 mice per group) at days 1, 3 and 6 (D1, D3, D6) post-CVI. Green fluorescent protein (GFP) and RFP were photobleached before anti-Iba1 and RFP staining. e, Bar graph depicting the absolute number of CCR2-RFP+ monocytes per mm2 of brain tissue at the denoted time points after a CVI. Combined data from two independent experiments are shown in d and e. **P < 0.005, ***P < 0.0005, ****P < 0.0001; one-way ANOVA with Tukey’s test. f, UMAPs showing high-parameter flow cytometric data of leukocytes isolated via punch biopsy from WT (n = 6) and Ccr2−/− (n = 6) mice on day 6 post-CVI. The dashed lines delineate RAMs and MDMs. g,h, Bar graphs showing the absolute number of RAMs (g) and MDMs (h) in WT versus Ccr2−/− mice derived from f. The cell cluster in the top left of the UMAPs corresponds to CD45 nonimmune cells. Data represent two independent experiments. **P < 0.005, ***P < 0.0005; two-tailed, unpaired Student’s t-test. i, Representative images of RNAscope in situ hybridization for Il-6 transcripts (white) combined with immunofluorescent staining for Iba1, RFP, GFAP and CD31 in ipsilateral (injured) versus contralateral (uninjured) neocortex of CX3CR1gfp/+CCR2rfp/+ mice (n = 4) at day 3 post-CVI. GFP and RFP were photobleached before anti-Iba1 and RFP staining. The following cell populations were identified: microglia/macrophages (Iba1+CCR2-RFP), monocytes (CCR2-RFP+), astrocytes (GFAP+) and endothelial cells (CD31+). Cell nuclei are shown in blue. j,k, Bar graphs showing the percentage of each cell type expressing Il-6 (j) and the percentage of Il-6-expressing cells within each cell type (k) from the mice described in i. Combined data from two independent experiments are shown in ik. The asterisks in j denote a statistically significant difference between monocytes and all other IL-6-expressing cells: ****P < 0.0001; one-way ANOVA with Tukey’s test. All graphs in this figure show mean ± s.e.m. The dots represent individual animals.
Fig. 4 |
Fig. 4 |. ScRNA-seq reveals that IL-6 deficiency impairs proangiogenic microglial programming.
a, Schematic of how purified single-cell suspensions of CD11b+ cells were isolated for scRNA-seq via punch biopsy from the neocortex of WT versus Il6−/− mice at day 6 post-CVI. b, The UMAP depicts 7 different partitions based on 9,027 cells processed by scRNA-seq. Each dot represents a single cell and each color denotes a partition that is labeled with the corresponding cell type. c, Dot plots showing differential expression of canonical cell type markers for each partition. The dot size represents the percentage of cells within the partition that express the denoted gene and the color reflects the average expression level. d, A Pearson’s correlation-based clustered heatmap showing DEGs (q < 0.05) in P1 among uninjured (Ctrl) versus injured WT and Il6−/− mice. e, UMAP showing an all-partition comparison of WT versus Il6−/− CVI mice. The top pathway expressed in WT versus Il6−/− CVI based on DEGs is shown for P1 and P3. f, Expression of classic proangiogenic factors shown in each partition from all groups combined. g,h, Heatmaps showing the aggregated expression of the ten proangiogenic genes (denoted in f) per partition (g) and per experimental group (h). i, UMAP depicting drill-down analysis of P1, which revealed four clusters labeled with different colors. The top weighted signaling pathway for each cluster is listed. These pathways were identified using GSEA of DEGs (q < 0.05) between injured and uninjured mice. j, Bar graph showing the proportion of cells in each cluster of P1 that are attributed to the four denoted groups of mice. k, UMAPs depicting a side-by-side comparison of microglia P1 for WT versus Il6−/− CVI mice. l, Pathways revealed by GSEA of DEGs (q < 0.05) between WT and Il6−/− CVI mice in microglial P1 C2. Dot size corresponds to the odds ratio. Only statistically significant pathways (P < 0.05) are shown on the graph. Pathways are ordered based on −log(P value) multiplied by the corresponding z-score.
Fig. 5 |
Fig. 5 |. Monocytes and IL-6 are required for RAM generation, vascular repair and functional recovery.
a, Schematic depicting the experimental timeline. b,c, Bar graphs depicting the absolute number of RAMs (b) and MDMs (c) obtained from cortical punch biopsies of WT (n = 4), Ccr2−/− (n = 5) and Il6−/− (n = 4) mice at day 6 post-CVI. Data represent two independent experiments. *P < 0.05, **P < 0.005; one-way ANOVA with Tukey’s test. d,e, Bar graphs showing the absolute number of RAMs (d) and MDMs (e) obtained from cortical punch biopsies of uninjured Ccr2−/− mice (n = 2) as well as Ccr2−/− mice at day 6 post-CVI that received no transfer (n = 3) or adoptive transfer of WT (n = 4) versus Il6−/− (n = 4) monocytes. Data represent two independent experiments. *P < 0.05, **P < 0.005; one-way ANOVA with Tukey’s test. f, Representative intravital TPM images captured through the thinned skull of WT (n = 7), Ccr2−/− (n = 6) and Il6−/− (n = 6) mice at day 10 post-CVI. Tomato lectin (green) and EB (red) were injected i.v. to visualize vasculature. g,h, Bar graphs showing quantification of vascular coverage (g) and intervascular area (h) in the denoted groups of mice in f. Data are combined from two independent experiments. ****P < 0.0001; one-way ANOVA with Tukey’s test. i, Immunofluorescent staining for Iba1 (green), GFAP (red) and NeuN (white) in neocortex from uninjured WT mice (Ctrl; n = 8), as well as WT (n = 7), Ccr2−/− (n = 6) and Il6−/− (n = 7) mice at day 10 post-CVI. The dashed yellow lines denote the brain surface. j, Bar graph showing the number of NeuN+ neurons per mm2 of tissue for the denoted groups in i. Data are combined from two independent experiments. **P < 0.005, ***P < 0.0005; one-way ANOVA with Tukey’s test. k, Schematic showing Y-maze behavioral test used to evaluate mouse cognitive–motor function. l,m, Bar graphs demonstrating the total number of Y-maze arm entries (l) and the triplicate ratio (m) for WT (n = 8), Ccr2−/− (n = 8) and Il6−/− (n = 7) at days 21 and 42 post-CVI. Combined data from two independent experiments are shown in l and m. **P < 0.005, ***P < 0.0005, ****P < 0.0001; two-way ANOVA with Holm–Šidák test. All graphs show mean ± s.e.m. The dots represent individual animals.
Fig. 6 |
Fig. 6 |. Microglial IL-6 signaling contributes to RAM generation and vascular repair.
a, Schematic showing the experimental timeline and strategy used conditionally to delete IL-6Ra from microglia (ΔmIL-6Ra mice). b, Histograms showing the expression of membrane-bound IL-6Ra on CD45+CD11b+ cells obtained from the brains of Ctrl IL-6Ra (n = 3) and ΔmIL-6Ra (n = 1) mice on day 6 post-CVI relative to the FMO control (gray). Values in the histograms represent the median fluorescent intensity for each condition. Data represent two independent experiments. c,d, Bar graphs showing the percentage of RAMs (TdTo+VEGFA+IL-6Ra+CD24+CD44+CD206+CD11c+Ly6clo/int MHCIIloCX3CR1+CD11b+CD45lo/int) (c) and MDMs (TdToCD24+CD44+CD206+C D11c+Ly6c+CX3CR1+CD11b+CD45+) (d) determined by flow cytometric analysis of leukocytes isolated from cortical punch biopsies of ΔmIL-6Ra mice (n = 4) percentage normalized to their littermate Ctrl counterparts (n = 8) at day 6 post-CVI. Data are combined from three independent experiments. **P < 0.005; two-tailed, unpaired Student’s t-test. e, Representative TPM images showing vasculature through the thinned skull of Ctrl IL-6Ra (n = 8) versus ΔmIL-6Ra (n = 6) mice at day 10 post-CVI. Lectin (green) and EB (red) were injected i.v. to visualize vasculature. f,g, Bar graphs showing quantification of vascular coverage (f) and intervascular area (g) in the denoted groups in e. Data are combined from two independent experiments. ***P < 0.0005; two-tailed unpaired Student’s t-test. h, Representative confocal images of neocortex from Ctrl IL-6Ra (n = 6) versus ΔmIL-6Ra (n = 7) mice on day 10 post-CVI. Lectin (green) and EB (red) were injected i.v. to visualize vessels and measure BBB integrity. i, Bar graph showing the quantity of extravascular EB per mm2 of tissue in the denoted mice in h. Data are combined from two independent experiments. ***P < 0.0005; two-tailed, unpaired Student’s t-test. j, Representative confocal images of the neocortex from Ctrl IL-6Ra (n = 6) versus ΔmIL-6Ra (n = 7) mice at day 10 post-CVI stained for Iba1 (green), GFAP (red) and NeuN (white). k, Bar graph demonstrating the number of NeuN+ neurons per mm2 of tissue in the denoted mice in j. Data are combined from two independent experiments. ***P < 0.0005; two-tailed, unpaired Student’s t-test. l,m, Bar graphs depicting the total number of Y-maze arm entries (l) and the triplicate ratio (m) for Ctrl IL-6Ra (n = 9) and ΔmIL-6Ra (n = 8) mice at day 21 post-CVI. Combined data from two independent experiments are shown. **P < 0.005; two-tailed, unpaired Student’s t-test. All graphs show mean ± s.e.m. The dots represent individual animals.
Fig. 7 |
Fig. 7 |. Exogenous IL-6 restores RAM, vascular repair and functional recovery in Ccr2−/− mice.
a, Schematic showing experimental timeline and transcranial application of rIL-6. b,c, Bar graph showing the absolute number of RAMs (b) and MDMs (c) determined by flow cytometric analysis of leukocytes isolated from cortical punch biopsies of WT + vehicle (n = 5), Ccr2−/− + vehicle (n = 4) and Ccr2−/− + rIL-6 (n = 5) at day 6 post-CVI. Data represent two independent experiments. *P < 0.05, **P < 0.005, ***P < 0.0005; one-way ANOVA with Tukey’s multiple comparisons test. d, Representative intravital TPM images captured through the thinned skull of WT + vehicle (n = 6), Ccr2−/− + vehicle (n = 6) and Ccr2−/− + rIL-6 (n = 7) at day 10 post-CVI. Tomato lectin (green) and EB (red) were injected i.v. to visualize vasculature. e,f, Bar graphs showing quantification of vascular coverage (e) and intervascular area (f) in the denoted groups of mice in d. Data are combined from two independent experiments. *P < 0.05, ****P < 0.0001; one-way ANOVA with Tukey’s multiple comparison test. g, Immunofluorescent staining for Iba1 (green), GFAP (red) and NeuN (white) in the neocortex from WT + vehicle (n = 5), Ccr2−/− + vehicle (n = 6) and Ccr2−/− + rIL-6 (n = 6) mice at day 10 post-CVI. h, Bar graph showing the number of NeuN+ neurons per mm2 of tissue for the denoted groups in g. Data are combined from two independent experiments. **P < 0.005, ****P < 0.0001; one-way ANOVA with Tukey’s test. i,j, Bar graphs demonstrating the total number of Y-maze arm entries (i) and the triplicate ratio (j) for WT + vehicle (n = 8), Ccr2−/− + vehicle (n = 8) and Ccr2−/− + rIL-6 (n = 8) at days 21 and 42 post-CVI. Data are combined from two independent experiments. *P < 0.05, **P < 0.005,***P < 0.0005, ****P < 0.0001; two-way ANOVA with Tukey’s multiple comparisons test. All graphs show mean ± s.e.m. The dots represent individual animals.

Similar articles

Cited by

References

    1. Parikh NS, Merkler AE & Iadecola C Inflammation, autoimmunity, infection, and stroke: epidemiology and lessons from therapeutic intervention. Stroke 51, 711–718 (2020). - PMC - PubMed
    1. Kenney K et al. Cerebral vascular injury in traumatic brain injury. Exp. Neurol. 275, 353–366 (2016). - PubMed
    1. Schneider JA & Bennett DA Where vascular meets neurodegenerative disease. Stroke 41, S144–S146 (2010). - PMC - PubMed
    1. Badjatia N & Rosand J Intracerebral hemorrhage. Neurologist 11, 311–324 (2005). - PubMed
    1. Twitchell TE The restoration of motor function following hemiplegia in man. Brain 74, 443–480 (1951). - PubMed

Publication types

Substances