

Experimental hepatic encephalopathy causes early but sustained glial transcriptional changes
- PMID: 37248507
- PMCID: PMC10226265
- DOI: 10.1186/s12974-023-02814-w
Experimental hepatic encephalopathy causes early but sustained glial transcriptional changes
Abstract
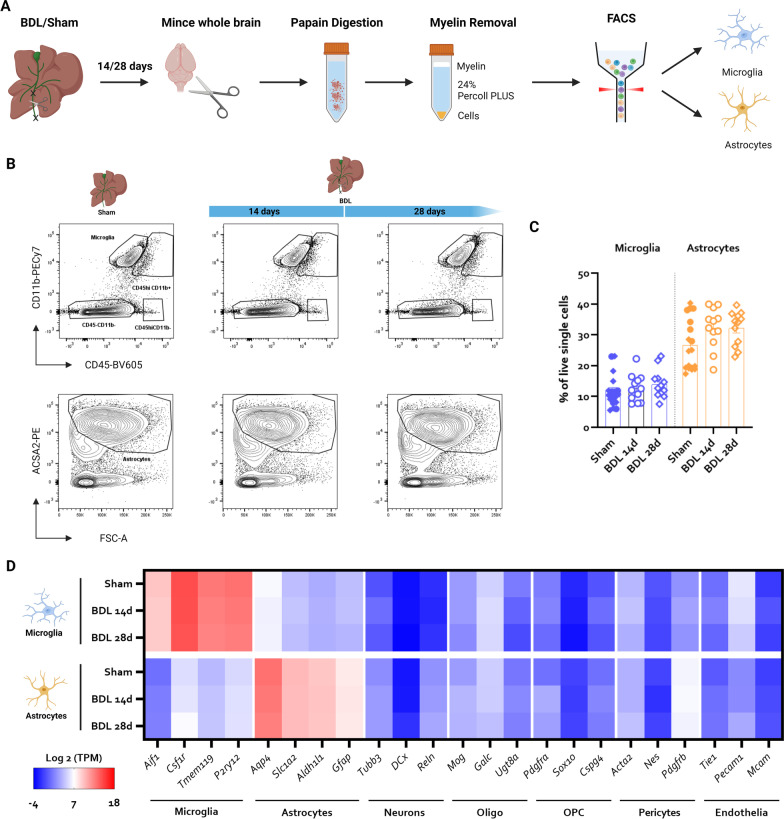
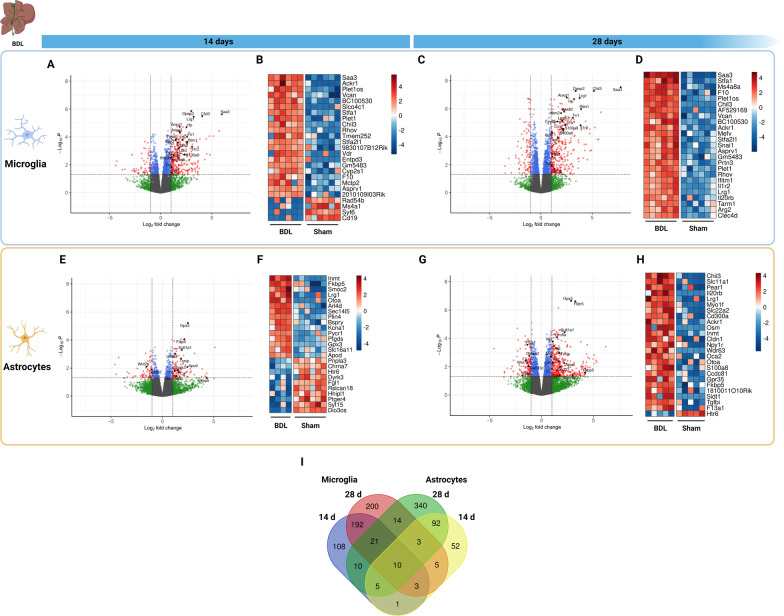
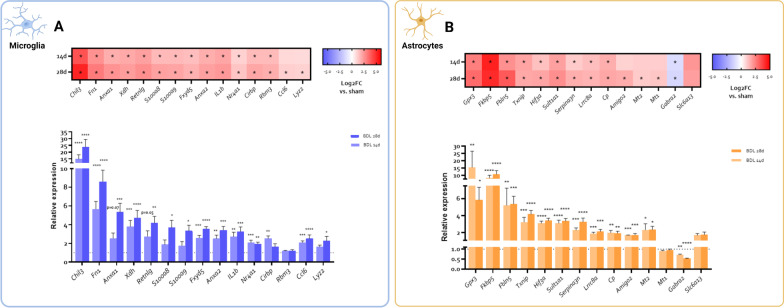
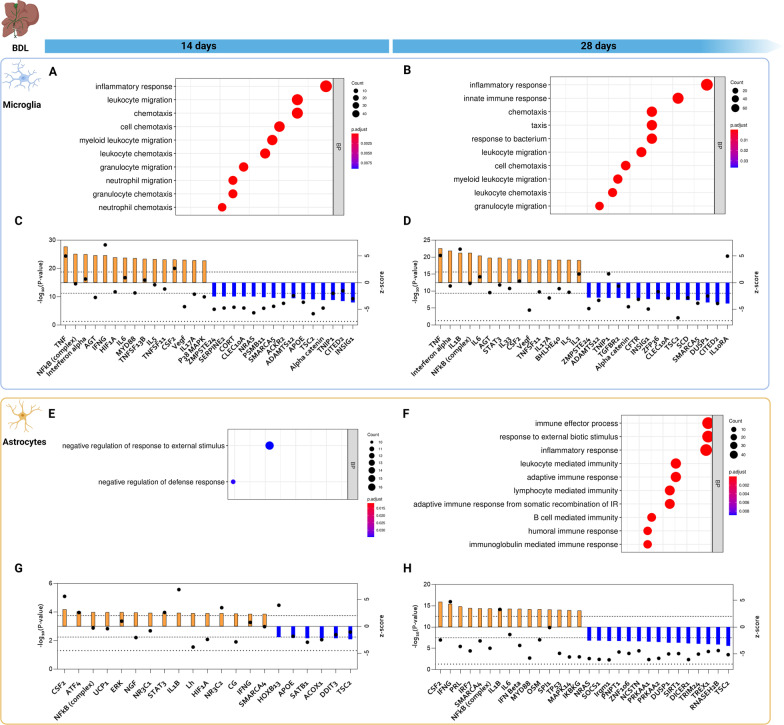
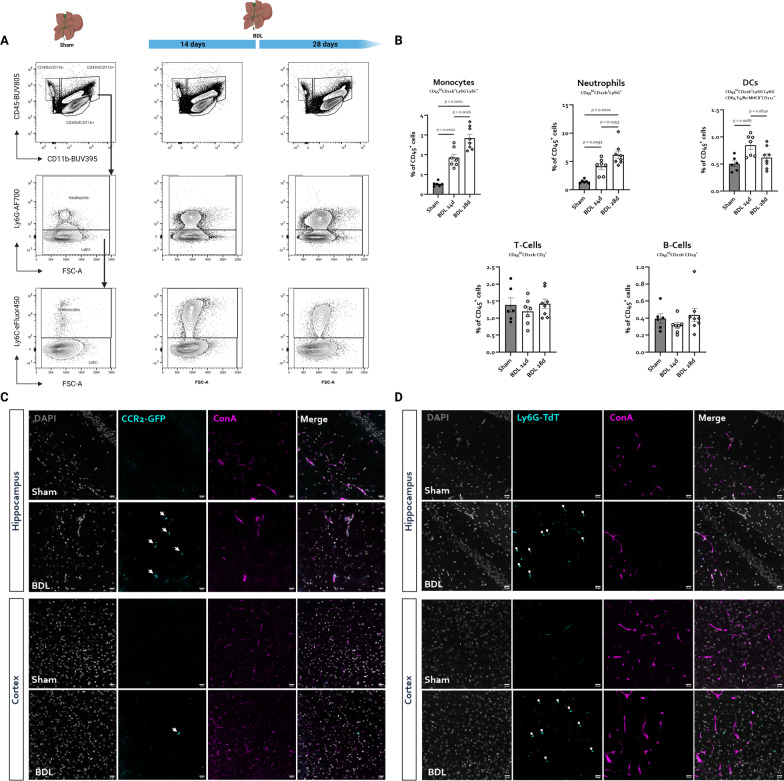
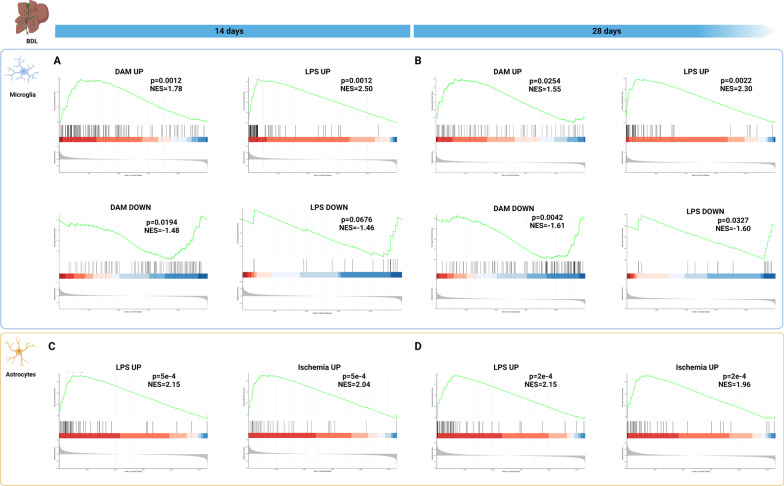
Hepatic encephalopathy (HE) is a common complication of liver cirrhosis, associated with high morbidity and mortality, for which no brain-targeted therapies exist at present. The interplay between hyperammonemia and inflammation is thought to drive HE development. As such, astrocytes, the most important ammonia-metabolizing cells in the brain, and microglia, the main immunomodulatory cells in the brain, have been heavily implicated in HE development. As insight into cellular perturbations driving brain pathology remains largely elusive, we aimed to investigate cell-type specific transcriptomic changes in the HE brain. In the recently established mouse bile duct ligation (BDL) model of HE, we performed RNA-Seq of sorted astrocytes and microglia at 14 and 28 days after induction. This revealed a marked transcriptional response in both cell types which was most pronounced in microglia. In both cell types, pathways related to inflammation and hypoxia, mechanisms commonly implicated in HE, were enriched. Additionally, astrocytes exhibited increased corticoid receptor and oxidative stress signaling, whereas microglial transcriptome changes were linked to immune cell attraction. Accordingly, both monocytes and neutrophils accumulated in the BDL mouse brain. Time-dependent changes were limited in both cell types, suggesting early establishment of a pathological phenotype. While HE is often considered a unique form of encephalopathy, astrocytic and microglial transcriptomes showed significant overlap with previously established gene expression signatures in other neuroinflammatory diseases like septic encephalopathy and stroke, suggesting common pathophysiological mechanisms. Our dataset identifies key molecular mechanisms involved in preclinical HE and provides a valuable resource for development of novel glial-directed therapeutic strategies.
© 2023. The Author(s).
Conflict of interest statement
The authors declare no competing interests.
Figures
Similar articles
-
A mouse model of hepatic encephalopathy: bile duct ligation induces brain ammonia overload, glial cell activation and neuroinflammation.Sci Rep. 2022 Oct 20;12(1):17558. doi: 10.1038/s41598-022-22423-6. Sci Rep. 2022. PMID: 36266427 Free PMC article.
-
Systemic inflammation without gliosis mediates cognitive deficits through impaired BDNF expression in bile duct ligation model of hepatic encephalopathy.Brain Behav Immun. 2018 May;70:214-232. doi: 10.1016/j.bbi.2018.03.002. Epub 2018 Mar 5. Brain Behav Immun. 2018. PMID: 29518527
-
Animal models in the study of episodic hepatic encephalopathy in cirrhosis.Metab Brain Dis. 2005 Dec;20(4):399-408. doi: 10.1007/s11011-005-7925-1. Metab Brain Dis. 2005. PMID: 16382350 Review.
-
Longitudinal neurometabolic changes in the hippocampus of a rat model of chronic hepatic encephalopathy.J Hepatol. 2019 Sep;71(3):505-515. doi: 10.1016/j.jhep.2019.05.022. Epub 2019 Jun 5. J Hepatol. 2019. PMID: 31173812
-
Pathophysiology of Hepatic Encephalopathy.Clin Liver Dis. 2020 May;24(2):175-188. doi: 10.1016/j.cld.2020.01.002. Epub 2020 Feb 19. Clin Liver Dis. 2020. PMID: 32245525 Review.
Cited by
-
Role of astrocytes and microglia in hepatic encephalopathy associated with advanced chronic liver disease: lessons from animal studies.Neural Regen Res. 2025 Dec 1;20(12):3461-3475. doi: 10.4103/NRR.NRR-D-24-00600. Epub 2024 Dec 16. Neural Regen Res. 2025. PMID: 39688562 Free PMC article.
-
Microbiota-gut-liver-brain axis and hepatic encephalopathy.Microbiome Res Rep. 2024 Jan 25;3(2):17. doi: 10.20517/mrr.2023.44. eCollection 2024. Microbiome Res Rep. 2024. PMID: 38841407 Free PMC article. Review.
-
Limitations of PLX3397 as a microglial investigational tool: peripheral and off-target effects dictate the response to inflammation.Front Immunol. 2023 Nov 22;14:1283711. doi: 10.3389/fimmu.2023.1283711. eCollection 2023. Front Immunol. 2023. PMID: 38077359 Free PMC article.
-
Management of hepatic encephalopathy following transjugular intrahepatic portosystemic shunts: Current strategies and future directions.World J Gastroenterol. 2025 Apr 21;31(15):103512. doi: 10.3748/wjg.v31.i15.103512. World J Gastroenterol. 2025. PMID: 40309228 Free PMC article. Review.
-
Role of glial cells in neurotoxicological effects of alcohol.Adv Neurotoxicol. 2025;14:41-73. doi: 10.1016/bs.ant.2025.03.001. Epub 2025 Apr 11. Adv Neurotoxicol. 2025. PMID: 40666307 Free PMC article.
References
-
- American Association for the Study of Liver Diseases. European Association for the Study of the Liver Hepatic encephalopathy in chronic liver disease: practice guideline by the European association for the study of the liver and the American association for the study of liver diseases. J Hepatol. 2014;61(3):642–659. doi: 10.1016/j.jhep.2014.05.042. - DOI - PubMed
-
- Cordoba J, Ventura-Cots M, Simón-Talero M, Amorós À, Pavesi M, Vilstrup H, et al. Characteristics, risk factors, and mortality of cirrhotic patients hospitalized for hepatic encephalopathy with and without acute-on-chronic liver failure (ACLF) J Hepatol. 2014;60(2):275–281. doi: 10.1016/j.jhep.2013.10.004. - DOI - PubMed
MeSH terms
Grants and funding
LinkOut - more resources
Full Text Sources
Molecular Biology Databases
Research Materials
