

Associations of time-weighted individual exposure to ambient particulate matter with carotid atherosclerosis in Beijing, China
- PMID: 37248518
- PMCID: PMC10226216
- DOI: 10.1186/s12940-023-00995-8
Associations of time-weighted individual exposure to ambient particulate matter with carotid atherosclerosis in Beijing, China
Abstract
Background: Time-location information (time spent on commuting, indoors and outdoors around residential and work places and physical activity) and infiltrated outdoor pollution was less considered estimating individual exposure to ambient air pollution. Studies investigating the association between individual exposure to particulate matter (PM) with aerodynamic diameter < 10 μm (PM10) and < 2.5 μm (PM2.5) and carotid atherosclerosis presented inconsistent results. Moreover, combined effect of pollutants on carotid atherosclerosis was not fully explored. We aimed to investigate the association between long-term individual time-weighted average exposure to PM2.5 and PM10 and the risk of carotid atherosclerosis, and further explore the overall effect of co-exposure to pollutants on carotid atherosclerosis.
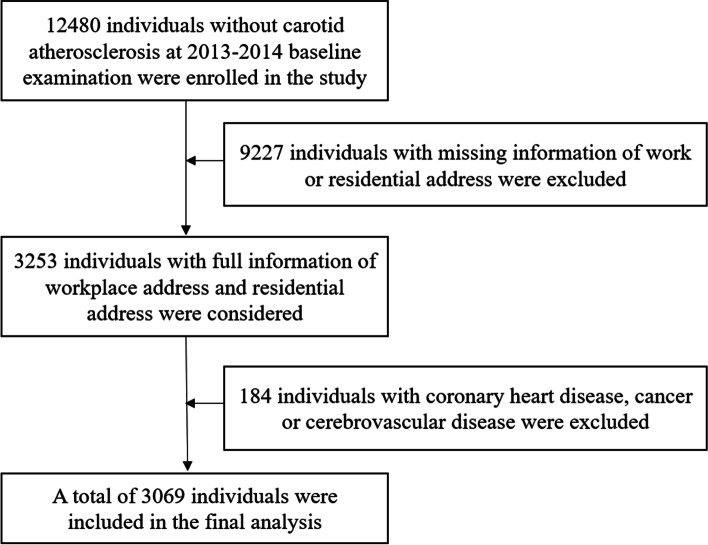
Methods: The study population included 3069 participants derived from the Beijing Health Management Cohort (BHMC) study. Daily concentration of ambient air pollutants was estimated by land-use regression model at both residential and work addresses, and one- and two-year time-weighted average individual exposure was calculated by further considering personal activity pattern and infiltration of ambient air pollution indoors. We explored the association of PM2.5 and PM10 with carotid atherosclerosis and pooled the overall effect of co-exposure to ambient air pollutants by quantile g-computation.
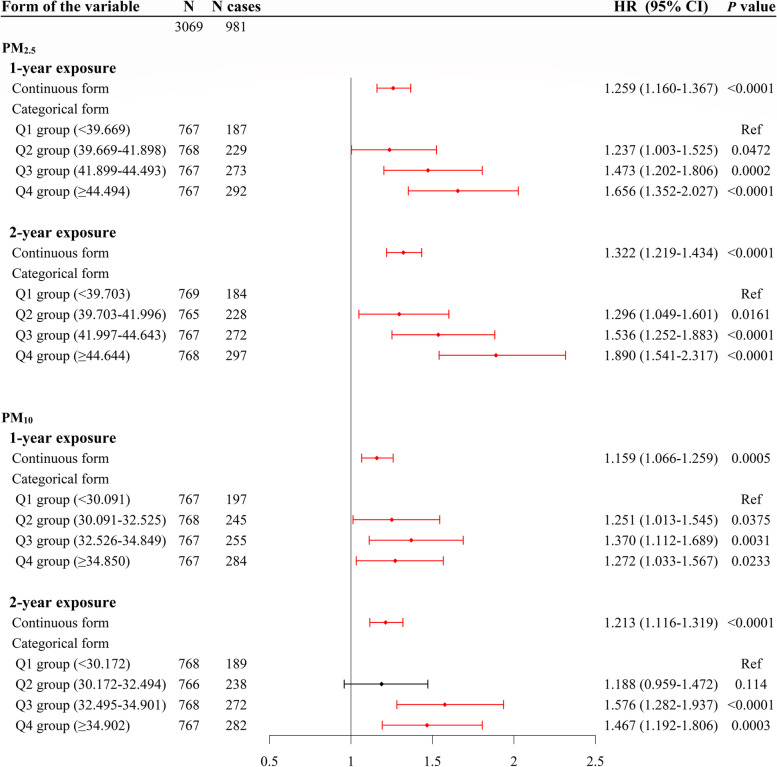
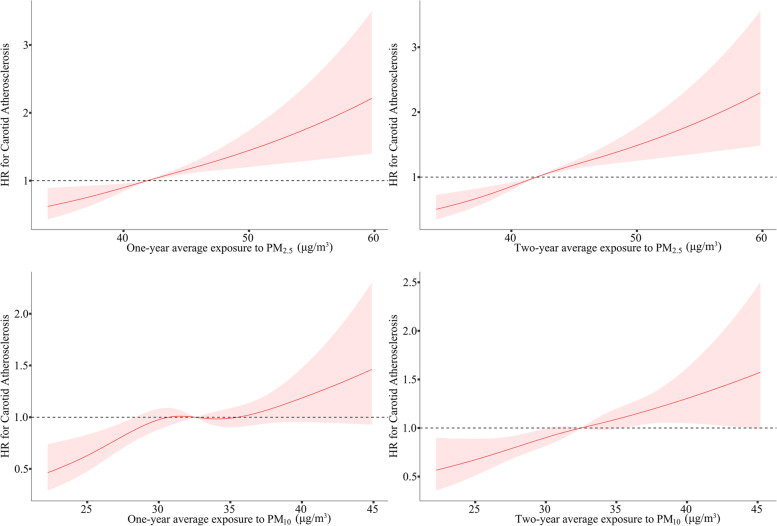
Results: A significant association between time-weighted average exposure to PM2.5 and PM10 and carotid atherosclerosis was observed. Per interquartile range increase in two-year exposure to PM2.5 (Hazard ratio (HR): 1.322, 95% confidence interval (CI): 1.219-1.434) and PM10 (HR:1.213, 95% CI: 1.116-1.319) showed the strongest association with carotid atherosclerosis, respectively. Individuals in higher quartiles of pollutants were at higher risk for carotid atherosclerosis compared with those in the lowest quartile group. Concentration response functions documented the nearly linear and nonlinear relationship and interpreted the upward trends of the risk for carotid atherosclerosis with increasing level of pollutant concentrations. Moreover, effect estimates for the mixture of pollutants and carotid atherosclerosis were larger than any of the individual pollutants (HR (95% CI) was 1.510 (1.338-1.704) and 1.613 (1.428-1.822) per quartile increase for one-year and two-year time-weighted average exposure, respectively).
Conclusions: Individual time-weighted average exposure to PM2.5 and PM10 was associated with carotid atherosclerosis. Co-exposure to ambient air pollution was also positively associated with carotid atherosclerosis.
Keywords: Carotid atherosclerosis; PM10; PM2.5; Quantile g-computation.
© 2023. The Author(s).
Conflict of interest statement
The authors declare they have nothing to disclose.
Figures
Similar articles
-
Multicity study of air pollution and mortality in Latin America (the ESCALA study).Res Rep Health Eff Inst. 2012 Oct;(171):5-86. Res Rep Health Eff Inst. 2012. PMID: 23311234
-
Joint Effects of Long-Term Exposure to Ambient Fine Particulate Matter and Ozone on Asthmatic Symptoms: Prospective Cohort Study.JMIR Public Health Surveill. 2023 Aug 3;9:e47403. doi: 10.2196/47403. JMIR Public Health Surveill. 2023. PMID: 37535415 Free PMC article.
-
Association between joint exposure to ambient air pollutants and carotid plaque: The mediating role of cardiometabolic risk factors.Ecotoxicol Environ Saf. 2025 Jan 15;290:117755. doi: 10.1016/j.ecoenv.2025.117755. Epub 2025 Jan 23. Ecotoxicol Environ Saf. 2025. PMID: 39854868
-
Association between exposure to ambient air pollution and hospital admission, incidence, and mortality of stroke: an updated systematic review and meta-analysis of more than 23 million participants.Environ Health Prev Med. 2021 Jan 26;26(1):15. doi: 10.1186/s12199-021-00937-1. Environ Health Prev Med. 2021. PMID: 33499804 Free PMC article.
-
Short-term exposure to particulate matter (PM10 and PM2.5), nitrogen dioxide (NO2), and ozone (O3) and all-cause and cause-specific mortality: Systematic review and meta-analysis.Environ Int. 2020 Sep;142:105876. doi: 10.1016/j.envint.2020.105876. Epub 2020 Jun 23. Environ Int. 2020. PMID: 32590284
Cited by
-
Extended exposure to tetrabromobisphenol A-bis(2,3-dibromopropyl ether) leads to subfertility in male mice at the late reproductive age.Arch Toxicol. 2023 Nov;97(11):2983-2995. doi: 10.1007/s00204-023-03589-y. Epub 2023 Aug 22. Arch Toxicol. 2023. PMID: 37606655
References
-
- GBD 2015 Risk Factors Collaborators. Global, regional, and national comparative risk assessment of 79 behavioural, environmental and occupational, and metabolic risks or clusters of risks, 1990–2015: a systematic analysis for the Global Burden of Disease Study 2015. Lancet. 2016;388(10053):1659–1724. 10.1016/S0140-6736(16)31679-8. Erratum in: Lancet. 2017;389(10064):e1. - PMC - PubMed
-
- WHO Regional Office for Europe . Review of evidence on health aspects of air pollution – REVIHAAP Project: Technical Report. Copenhagen: WHO Regional Office for Europe; 2013. - PubMed
-
- Stachyra K, Kiepura A, Olszanecki R. Air pollution and atherosclerosis - a brief review of mechanistic links between atherogenesis and biological actions of inorganic part of particulate matter. Folia Med Cracov. 2017;57(3):37–46. - PubMed
Publication types
MeSH terms
Substances
LinkOut - more resources
Full Text Sources
Medical
