

Medial Temporal Lobe Atrophy in Predementia Alzheimer's Disease: A Longitudinal Multi-Site Study Comparing Staging and A/T/N in a Clinical Research Cohort
- PMID: 37248900
- PMCID: PMC10657682
- DOI: 10.3233/JAD-221274
Medial Temporal Lobe Atrophy in Predementia Alzheimer's Disease: A Longitudinal Multi-Site Study Comparing Staging and A/T/N in a Clinical Research Cohort
Erratum in
-
Erratum to: Medial Temporal Lobe Atrophy in Predementia Alzheimer's Disease: A Longitudinal Multi-Site Study Comparing Staging and A/T/N in a Clinical Research Cohort.J Alzheimers Dis. 2023;96(2):859-860. doi: 10.3233/JAD-239011. J Alzheimers Dis. 2023. PMID: 37955098 Free PMC article. No abstract available.
Abstract
Background: Atrophy of the medial temporal lobe (MTL) is a biological characteristic of Alzheimer's disease (AD) and can be measured by segmentation of magnetic resonance images (MRI).
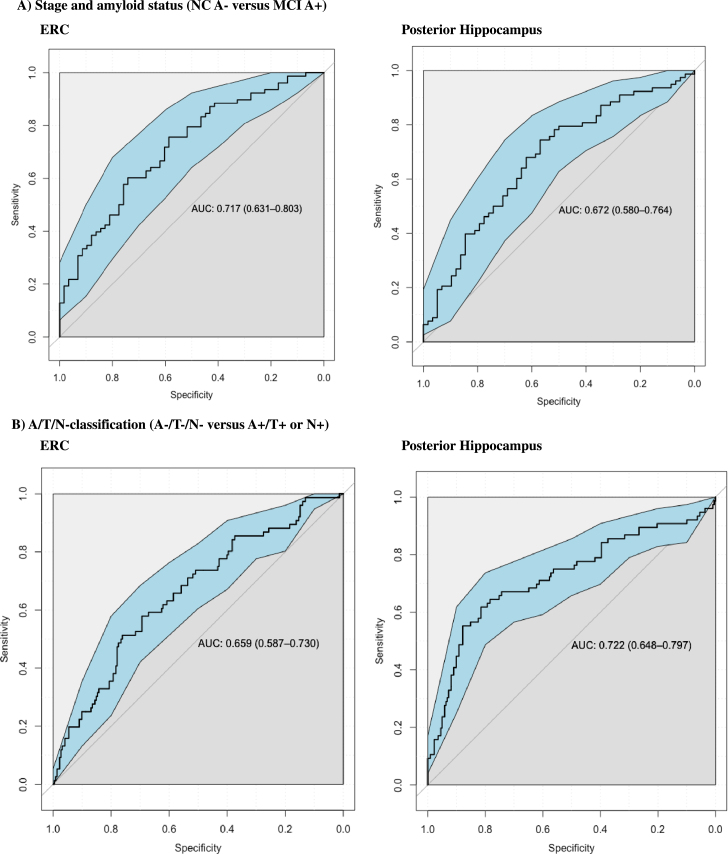
Objective: To assess the clinical utility of automated volumetry in a cognitively well-defined and biomarker-classified multi-center longitudinal predementia cohort.
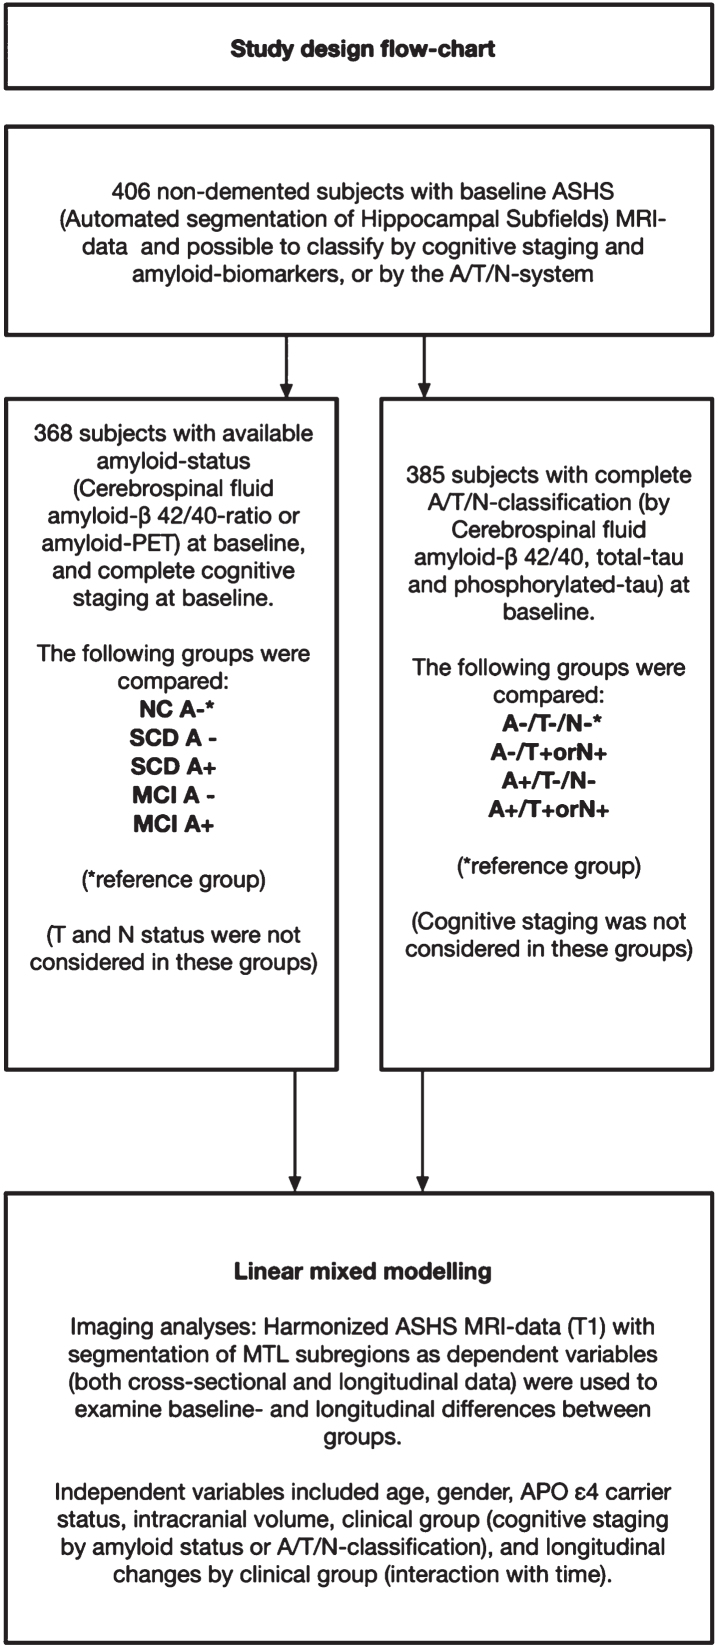
Methods: We used Automatic Segmentation of Hippocampal Subfields (ASHS) to determine MTL morphometry from MRI. We harmonized scanner effects using the recently developed longitudinal ComBat. Subjects were classified according to the A/T/N system, and as normal controls (NC), subjective cognitive decline (SCD), or mild cognitive impairment (MCI). Positive or negative values of A, T, and N were determined by cerebrospinal fluid measurements of the Aβ42/40 ratio, phosphorylated and total tau. From 406 included subjects, longitudinal data was available for 206 subjects by stage, and 212 subjects by A/T/N.
Results: Compared to A-/T-/N- at baseline, the entorhinal cortex, anterior and posterior hippocampus were smaller in A+/T+orN+. Compared to NC A- at baseline, these subregions were also smaller in MCI A+. Longitudinally, SCD A+ and MCI A+, and A+/T-/N- and A+/T+orN+, had significantly greater atrophy compared to controls in both anterior and posterior hippocampus. In the entorhinal and parahippocampal cortices, longitudinal atrophy was observed only in MCI A+ compared to NC A-, and in A+/T-/N- and A+/T+orN+ compared to A-/T-/N-.
Conclusion: We found MTL neurodegeneration largely consistent with existing models, suggesting that harmonized MRI volumetry may be used under conditions that are common in clinical multi-center cohorts.
Keywords: Alzheimer’s disease; brain atrophy; cognitive decline; hippocampus; longitudinal studies; magnetic resonance imaging.
Conflict of interest statement
T. Fladby has served on a Novo Nordisk and Biogen advisory boards.
All other authors have no conflict of interest to report.
Figures


References
-
- Braak H, Braak E (1991) Neuropathological stageing of Alzheimer-related changes. Acta Neuropathol (Berl) 82, 239–259. - PubMed
-
- Fukutani Y, Cairns NJ, Shiozawa M, Sasaki K, Sudo S, Isaki K, Lantos PL (2000) Neuronal loss and neurofibrillary degeneration in the hippocampal cortex in late-onset sporadic Alzheimer’s disease. Psychiatry Clin Neurosci 54, 523–529. - PubMed
-
- Bobinski M, Wegiel J, Tarnawski M, Bobinski M, Reisberg B, de Leon MJ, Miller DC, Wisniewski HM (1997) Relationships between regional neuronal loss and neurofibrillary changes in the hippocampal formation and duration and severity of Alzheimer disease. J Neuropathol Exp Neurol 56, 414–420. - PubMed
Publication types
MeSH terms
LinkOut - more resources
Full Text Sources
Medical
