

HNRNPH1 regulates the neuroprotective cold-shock protein RBM3 expression through poison exon exclusion
- PMID: 37248947
- PMCID: PMC10350819
- DOI: 10.15252/embj.2022113168
HNRNPH1 regulates the neuroprotective cold-shock protein RBM3 expression through poison exon exclusion
Abstract
Enhanced expression of the cold-shock protein RNA binding motif 3 (RBM3) is highly neuroprotective both in vitro and in vivo. Whilst upstream signalling pathways leading to RBM3 expression have been described, the precise molecular mechanism of RBM3 cold induction remains elusive. To identify temperature-dependent modulators of RBM3, we performed a genome-wide CRISPR-Cas9 knockout screen using RBM3-reporter human iPSC-derived neurons. We found that RBM3 mRNA and protein levels are robustly regulated by several splicing factors, with heterogeneous nuclear ribonucleoprotein H1 (HNRNPH1) being the strongest positive regulator. Splicing analysis revealed that moderate hypothermia significantly represses the inclusion of a poison exon, which, when retained, targets the mRNA for nonsense-mediated decay. Importantly, we show that HNRNPH1 mediates this cold-dependent exon skipping via its thermosensitive interaction with a G-rich motif within the poison exon. Our study provides novel mechanistic insights into the regulation of RBM3 and provides further targets for neuroprotective therapeutic strategies.
Keywords: CRISPR screen; RBM3; alternative splicing; cold-shock protein; poison exon.
© 2023 The Authors. Published under the terms of the CC BY 4.0 license.
Conflict of interest statement
S.P. is now an AstraZeneca employee. E.M. is an employee and shareholder of bit.bio.
Figures
- A
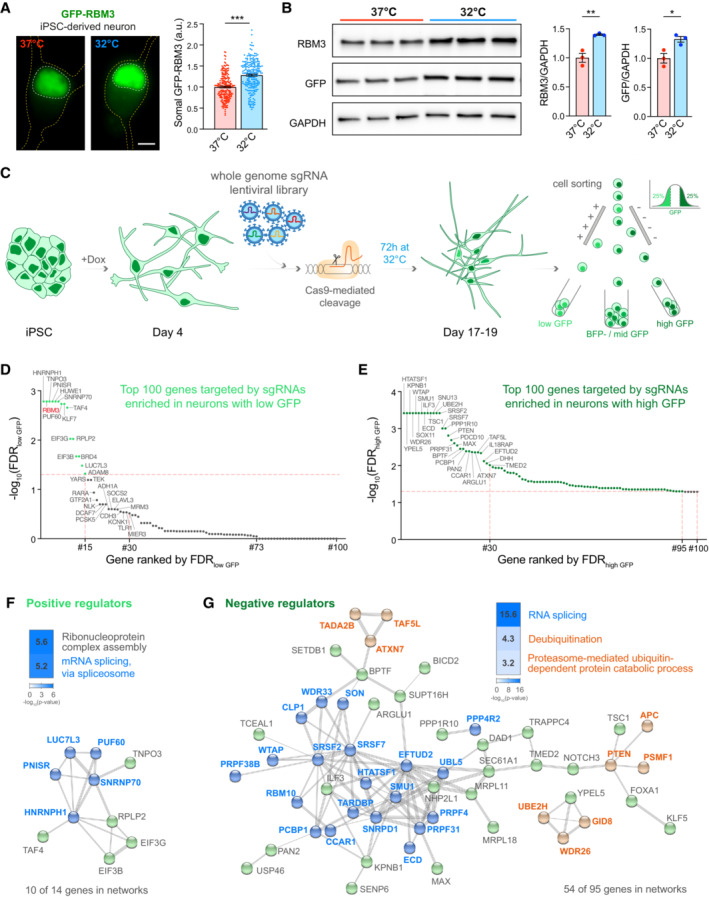
Representative images and quantification of somal intensity per unit area of GFP‐RBM3 i‐neurons at 37°C or after 72 h cooling at 32°C. Nuclei and cells are outlined by white and yellow dashed lines, respectively. N = 207 (37°C) and 220 (32°C) cells. Scale bar: 5 μm.
- B
Western blots and quantification of RBM3 and GFP normalised to GAPDH in GFP‐RBM3 i‐neurons at 37 or 32°C (72 h).
- C
Schematic of experimental steps in RBM3 CRISPR screen in i‐neurons. GFP‐RBM3 iPSCs stably expressing Cas9 after 4 days of Dox‐induced differentiation are transduced with a whole‐genome lentiviral sgRNA library expressing a BFP reporter. 10–12 days after transduction, the i‐neuron cultures are incubated at 32°C for 72 h, followed by FACS to sort BFP‐positive i‐neurons with the highest and lowest 25% GFP fluorescence intensity into separate pools. N = 2 GFP‐RBM3 clones and 3 biological replicates.
- D, E
Top 100 RBM3 positive regulator candidates with their sgRNAs enriched in the low‐GFP i‐neuron pool (D). Top 100 RBM3 negative regulator candidates with their sgRNAs enriched in the high‐GFP i‐neuron pool (E). Genes ranked by statistical significance (FDR). Horizontal dashed line: FDR = 0.05.
- F
The top‐ranked Gene Ontology terms and STRING networks of 14 positive regulator candidates (FDR <0.05, RBM3 is excluded). Genes related to RNA splicing are indicated in blue.
- G
The top‐ranked Gene Ontology terms and STRING networks of 95 positive regulator candidates (FDR <0.05). Genes related to RNA splicing are coloured in blue. Genes involved in deubiquitination or proteasome‐mediated ubiquitin‐dependent protein catabolic processes are coloured in orange.
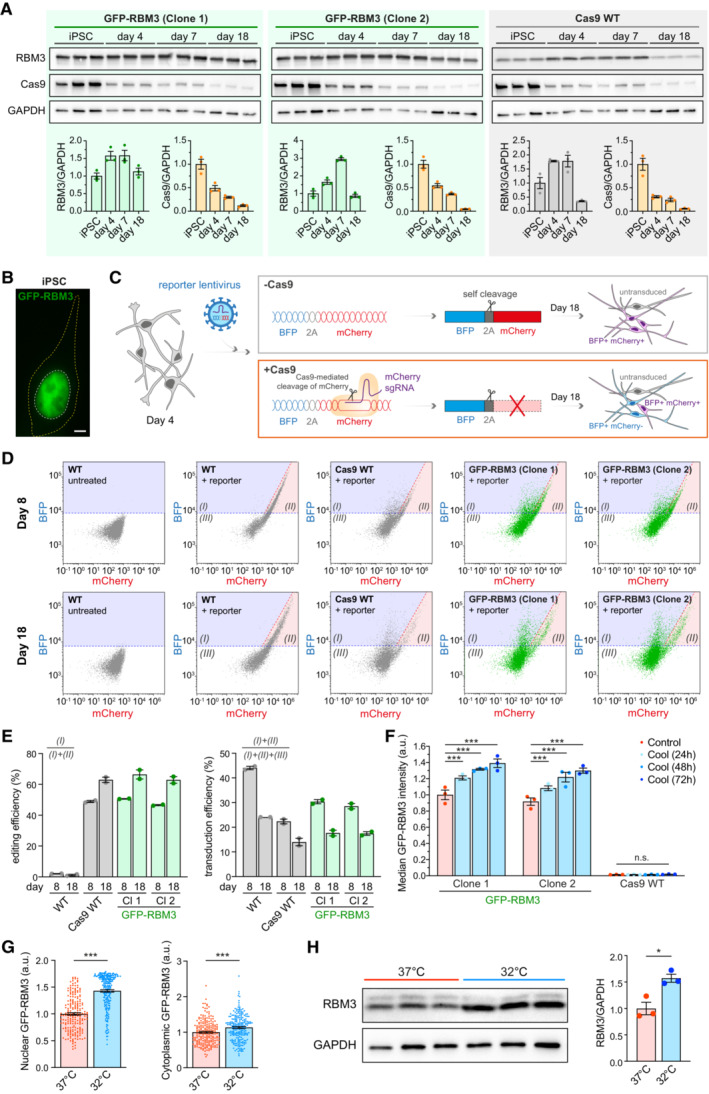
Western blots and quantification of RBM3, Cas9 and GAPDH in two GFP‐RBM3 clones and Cas9 WT iPSCs and i‐neurons 4, 7 and 18 days after dox‐induced differentiation.
Representative image of GFP‐RBM3 iPSCs. The nucleus and soma are outlined by white and yellow dashed lines, respectively. Scale bar: 5 μm.
Schematic of the reporter lentivirus design and expected fluorescent protein expression in transduced WT (‐Cas9) and Cas9 WT (+Cas9) i‐neurons. Transduced WT i‐neurons (top grey box) show high levels of BFP and mCherry. Transduced Cas9 WT i‐neurons (bottom orange box) that are successfully edited by the mCherry sgRNA express reduced levels of mCherry compared to the unedited ones.
Representative BFP vs. mCherry plots measured by flow cytometry for measuring editing and transduction efficiency in WT, Cas9 WT, two clones of GFP‐RBM3 i‐neurons 4 days (Day 8) and 14 days (Day 14) after reporter lentivirus transduction. Region (I), (II) and (III) denote BFP+/mCherry‐, BFP+/mCherry+ and BFP‐/mCherry‐ populations, respectively.
Editing and transduction efficiency of WT, Cas9 WT, two clones of GFP‐RBM3 i‐neurons at day 8 and 18 post differentiation. The calculation is based on the cell numbers within each area labelled in (D) and the formulas are shown in the graph.
Median GFP intensity of two GFP‐RBM3 clones and Cas9 WT i‐neurons at 37°C or at 32°C for 24‐72 h, measured by flow cytometry.
Nuclear and cytoplasmic GFP intensity per unit area in GFP‐RBM3 i‐neurons at 37 or 32°C (72 h). Each data point represents one cell.
Western blots and quantification of RBM3 normalised to GAPDH in Cas9 WT i‐neurons at 37 or 32°C (72 h).
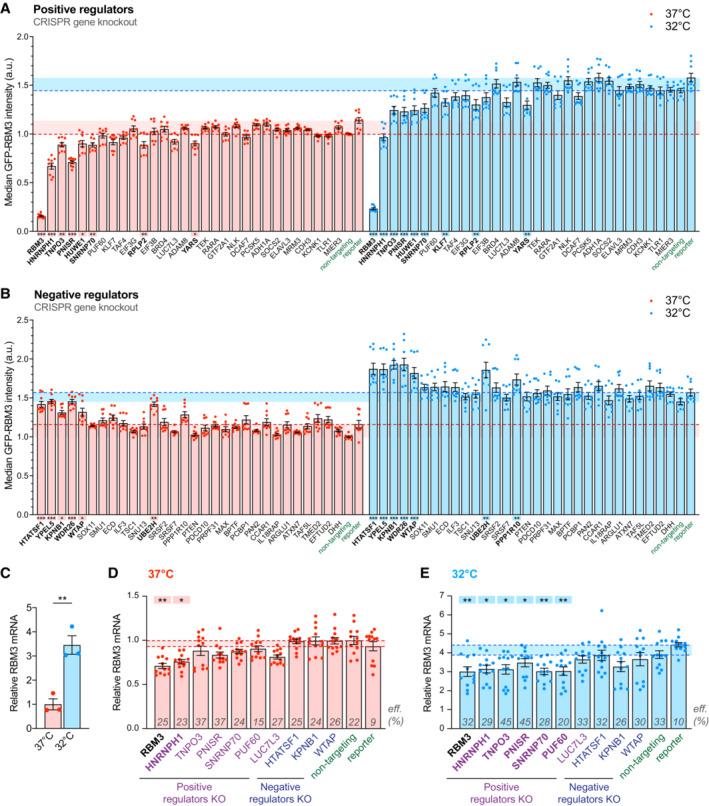
- A, B
Median GFP intensity of BFP‐positive GFP‐RBM3 i‐neurons measured by flow cytometry upon the sgRNA/Cas9‐mediated KO of top 30 positive (A) or negative (B) regulator candidates. Statistical analysis is performed between the specific and non‐targeting sgRNA groups for positive regulators (A) or between the specific sgRNA and reporter groups for negative regulators (B) within the 37 or 32°C (72 h) population.
- C
qRT‐PCR of RBM3 mRNA level normalised to 18 s rRNA in i‐neurons at 37 or 32°C (72 h).
- D, E
qRT‐PCR of RBM3 mRNA level normalised to 18 s rRNA in GFP‐RBM3 i‐neurons at 37°C (D) or 32°C for 72 h (E) transduced with lentivirus containing specific, non‐targeting sgRNA or the reporter. Statistical analysis is performed between the specific and non‐targeting sgRNA for negative regulators in (D) and positive regulators in (E), or between the specific and reporter groups for positive regulators in (D) and negative regulators in (E). Transduction efficiencies are indicated in corresponding bars.
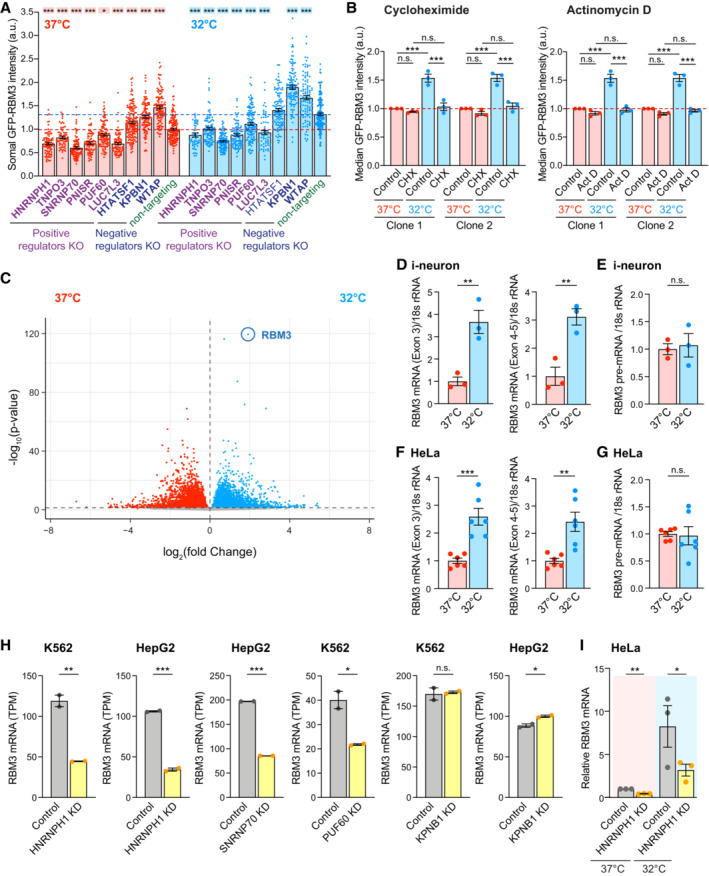
- A
Somal GFP intensity per unit area in GFP‐RBM3 i‐neurons transduced with lentivirus containing specific or non‐targeting sgRNA at 37 or 32°C (72 h) imaged by wide‐field microscopy. Only BFP‐positive (transduced) cells are included. Statistical analysis is performed between the specific and non‐targeting sgRNA within the temperature groups. Each data point represents one cell.
- B
Median GFP intensity per unit area of GFP‐RBM3 i‐neurons at 37 or 32°C (72 h) treated with cycloheximide (CHX) at 50 μM for 72 h or actinomycin D (Act D) at 1 μM for 72 h.
- C
Volcano plot showing differential expression analysis of all transcripts identified in i‐neurons at 37 and 32°C (72 h) from RNA‐Seq data.
- D, E
qRT‐PCR of RBM3 Exon 3, Exon 4–5 (D) and pre‐mRNA (E) normalised to 18 s rRNA in i‐neurons at 37 and 32°C (72 h).
- F, G
qRT‐PCR of RBM3 Exon 3, Exon 4–5 (F) and pre‐mRNA (G) normalised to 18 s rRNA in HeLa cells at 37 and 32°C (48 h).
- H
Normalised RBM3 mRNA abundance (TPM) of control and selective regulator candidates knocked‐down K562 or HepG2 cells. Data are extracted from ENCODE project. 2 isogenic replicates are included in each condition.
- I
qRT‐PCR of RBM3 mRNA normalised to GAPDH in control and HNRNPH1 KD HeLa cells at 37 or 32°C (48 h).
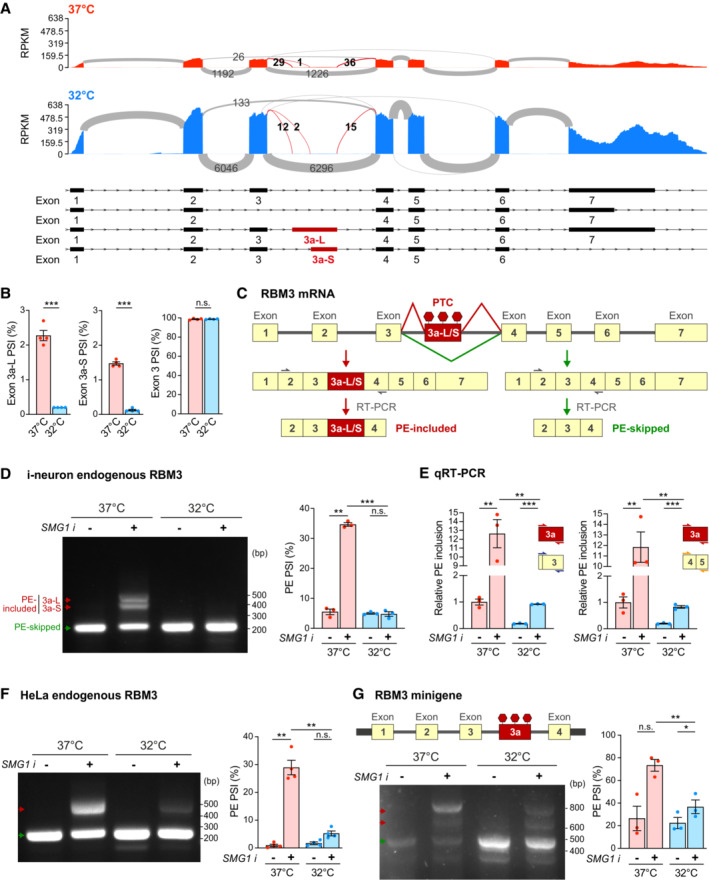
Sashimi plots of RBM3 transcripts in WT i‐neurons at 37 and 32°C (72 h), showing major alternatively spliced isoforms. Differentially spliced Exon 3a‐L and 3a‐S junctions between 37 and 32°C conditions are shown in red. N = 4.
PSI values of RBM3 Exon 3a‐L and 3a‐S relative to Exon 3 and 4, and Exon 3 relative to Exon 2 and 4 in i‐neurons at 37 or 32°C (72 h).
Schematics of RBM3 Exon 3a, or poison exon (PE), alternative splicing and the resulting PE‐included (left) or PE‐skipped (right) mRNA products. RT‐PCR primer pair amplifying Exon 2–4 are indicated by grey arrows.
RT‐PCR of RBM3 mRNA (Exon 2–4) in i‐neurons at 37 or 32°C (72 h) in the presence or absence of SMG1 inhibitor. PSI values of RBM3 PE are calculated based on the intensity of PE‐included (red arrows) and PE‐skipped (green arrow) isoforms.
qRT‐PCR using a combination of primers targeting Exon 3a, Exon 3 or Exon 4–5 quantifies the PSI values of RBM3 PE (Exon 3a, including both 3a‐L and 3a‐S) relative to Exon 3 or Exon 4–5 at 37 or 32°C (72 h) in the presence or absence of SMG1 inhibitor.
RT‐PCR of RBM3 mRNA (Exon 2–4) in HeLa cells at 37 and 32°C (48 h) in the presence or absence of SMG1 inhibitor. PSI values of RBM3 PE are depicted in the graph on the right.
Schematics and RT‐PCR of RBM3 minigene (Exon 1–4), flanked by unique sequences (thick black bars) to distinguish it from endogenous transcripts during PCR amplification, expressed in HeLa cells at 37 or 32°C (48 h), in the presence or absence of SMG1 inhibitor. PSI values of RBM3 PE are depicted in the graph on the right.
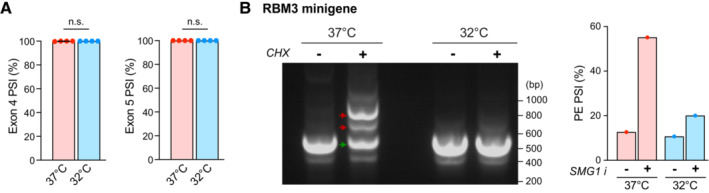
PSI values of RBM3 Exon 4 relative to Exon 3 and 6, and Exon 5 relative to Exon 4 and 6 in i‐neurons at 37 or 32°C (72 h). N = 4 biological replicates.
RT‐PCR of RBM3 minigene expressed in HeLa cells at 37 and 32°C (48 h) in the presence or absence of cycloheximide (CHX) at 200 μg/ml concentration. PSI values of RBM3 PE are calculated based on the intensity of PE‐included (red arrows) and PE‐skipped (green arrow) isoforms. N = 1 biological replicate.
- A, B
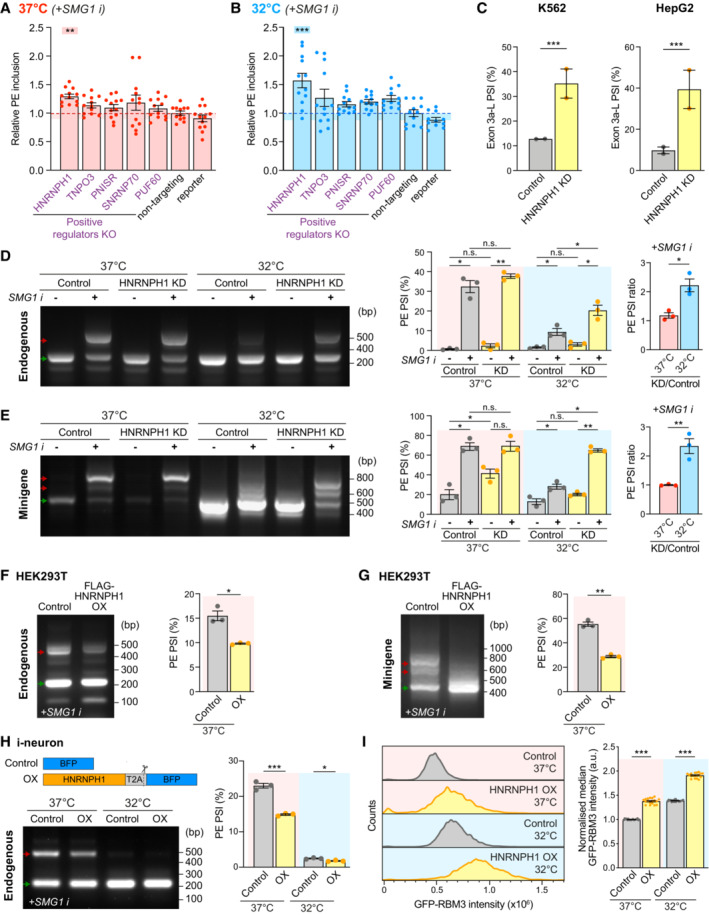
qRT‐PCR quantifying the PSI values of RBM3 PE relative to RBM3 mRNA in WT i‐neurons at 37°C (A) or 32°C (72 h) (B), when NMD is blocked by SMG1 inhibitor. Statistical analysis is performed between the specific and non‐targeting sgRNA groups.
- C
PSI values of RBM3 Exon 3a‐L in control and HNRNPH1‐knocked down K562 and HepG2 cells. RNA‐Seq data from ENCODE Project, 2 isogenic replicates are included.
- D, E
RT‐PCR of endogenous RBM3 (D) and expressed RBM3 minigene (E) in control (scramble siRNA) or HNRNPH1‐knocked down HeLa cells at 37 or 32°C (48 h), in the presence or absence of SMG1 inhibitor. The ratio of PSI values between HNRNPH1 KD and control is shown for only the SMG1 i‐treated conditions.
- F, G
RT‐PCR of endogenous RBM3 (F) and expressed RBM3 minigene (G) in SMG1 inhibitor‐treated control (untransfected) or FLAG‐HNRNPH1‐overexpressing (OX) HEK293T cells at 37°C. PSI values of RBM3 PE are shown in the graphs on the right respectively.
- H
WT i‐neurons are transduced with lentiviral constructs expressing BFP (Control) or HNRNPH1‐T2A‐BFP (HNRNPH1 overexpression, OX) at 37 and 32°C, followed by RT‐PCR of endogenous RBM3 with 24 h SMG1 inhibitor treatment. PSI values of RBM3 PE are shown in the graph on the right.
- I
GFP‐RBM3 intensity histogram and control (37°C)‐normalised median GFP intensity indicating GFP intensity of control and HNRNPH1‐overexpressing (OX) GFP‐RBM3 i‐neurons measured by flow cytometry. Only cells with top 5% BFP levels among all BFP‐positive cells in the well are included.
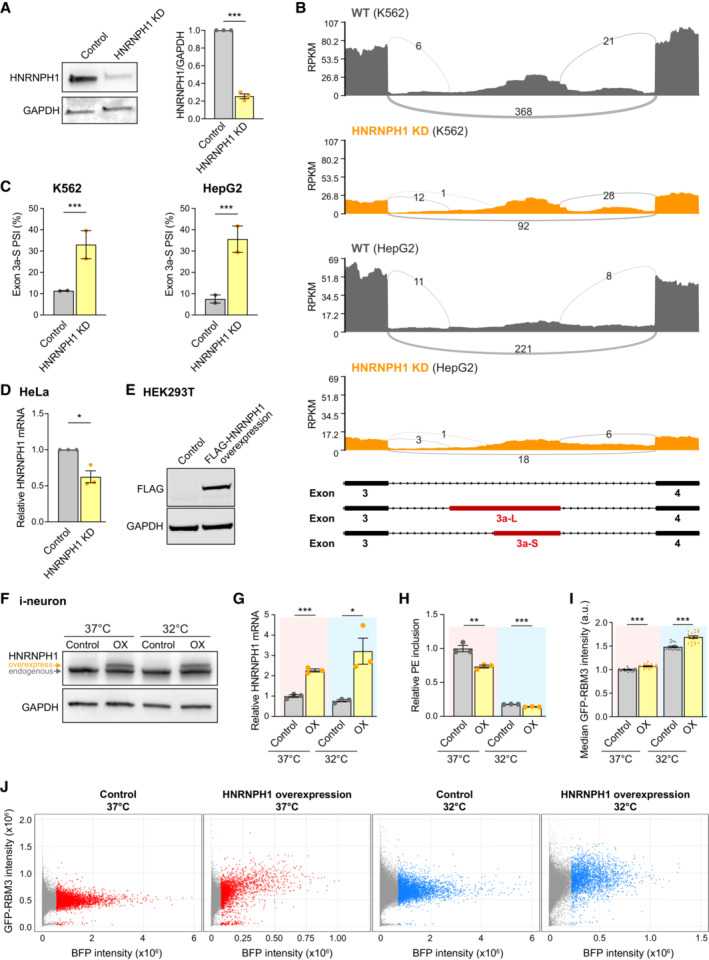
Western blots and quantification of HNRNPH1 normalised to GAPDH in Control and HNRNPH1 KD Cas9WT i‐neurons.
Sashimi plots of the region between Exon 3 and 4 of RBM3 transcripts in control and HNRNPH1 knocked‐down K562 and HepG2 cells, showing major alternatively spliced isoforms. Data are from ENCODE Project. 2 isogenic replicates are included.
PSI values of RBM3 Exon 3a‐S in control and HNRNPH1‐knocked down K562 and HepG2 cells. RNA‐Seq data from ENCODE Project, 2 isogenic replicates are included.
qRT‐PCR of HNRNPH1 mRNA normalised to GAPDH upon HNRNPH1 KD in HeLa cells.
Western blots of FLAG‐HNRNPH1 and GAPDH (loading control) in control and FLAG‐HNRNPH1‐expressed HEK293T cells at 37°C.
Western blot of WT i‐neurons transduced with lentivirus expressing BFP (control) or HNRNPH1‐T2A‐BFP (OX) at 37 and 32°C. The larger molecular weight of overexpressed HNRNPH1 is due to the additional amino acids between the C‐terminus of HNRNPH1 and the T2A cleavage site.
qRT‐PCR of HNRNPH1 mRNA normalised to 18 s rRNA of WT i‐neurons transduced with lentivirus expressing BFP (control) or HNRNPH1‐T2A‐BFP (OX) at 37 and 32°C.
qRT‐PCR quantifying the PSI values of RBM3 PE relative to RBM3 mRNA (mean value of RBM3 exon 3 and exon 4–5) in SMG1 inhibitor‐treated control and HNRNPH1‐overexpressing (OX) WT i‐neurons at 37 and 32°C.
Median GFP intensity of control and HNRNPH1‐overexpressing (OX) GFP‐RBM3 i‐neurons measured by flow cytometry.
Representative dot plots of flow cytometry data showing BFP or HNRNPH1‐T2A‐BFP expression (X‐axis) and GFP intensity of successfully transduced (BFP‐positive) GFP‐RBM3 i‐neurons. Each data point represents one cell. Cells with high levels of BFP expression (top 5% in each well) are coloured in red (37°C) or blue (32°C), and the rest of BFP‐positive cells are in grey. Y‐axes are in the same scale and X‐axes are scaled to the sample.
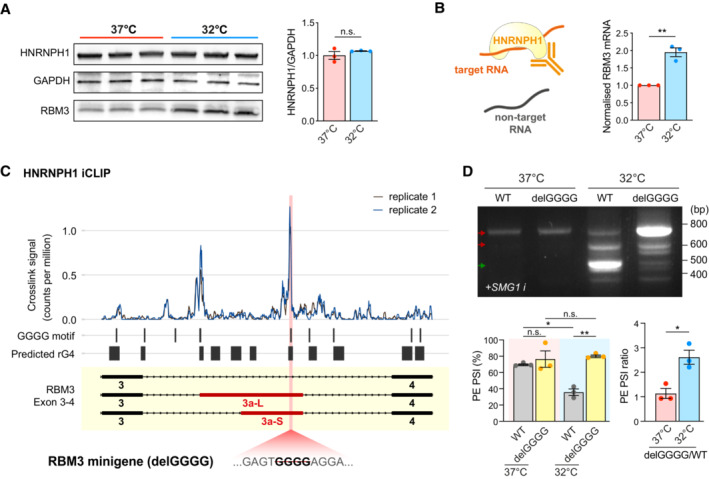
Western blot and quantification of HNRNPH1 normalised to GAPDH in WT i‐neurons at 37 and 32°C (72 h). RBM3 blots of the same samples are shown for comparison.
Schematic of HNRNPH1 RNA Immunoprecipitation (RIP) in HeLa cells at 37 or 32°C. The graph on the right shows the fold change in HNRNPH1‐pulled down RBM3 mRNA after normalisation.
Analysis of public HNRNPH1 iCLIP dataset in two replicates, mapped to RBM3 Exon 3–4. Crosslink counts are normalised to library size. RNA G quadruplexes (rG4) are predicted using QGRS mapper. The position of the GGGG motif deleted in the mutant RBM3 minigene is shown in pink.
RT‐PCR of WT and delGGGG RBM3 minigenes in HeLa cells at 37 or 32°C (48 h) treated with SMG1 inhibitor. PSI values of RBM3 PE are shown in the graphs on the right.
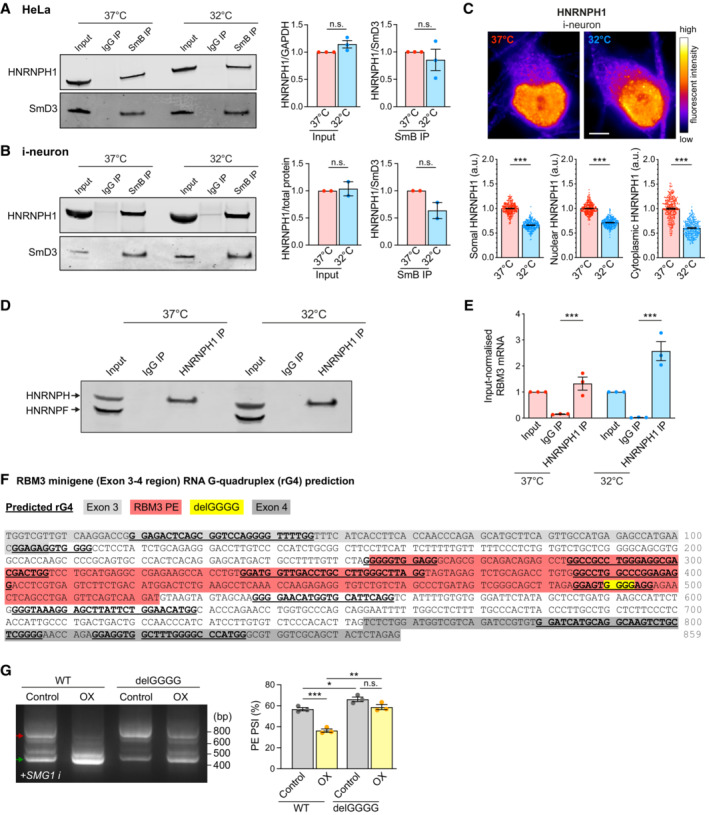
Western blot and quantification of HNRNPH1 total protein levels (input HNRNPH1 normalised to GAPDH) and its abundance in spliceosomal protein SmB pulldown (normalised to spliceosomal protein SmD3) in HeLa cells at 37 and 32°C (72 h).
Western blot and quantification of HNRNPH1 total protein levels (input HNRNPH1 normalised to ponceau measured total protein abundance) and its abundance in spliceosomal protein SmB pulldown (normalised to spliceosomal protein SmD3) in i‐neurons at 37 and 32°C (72 h).
Representative images of HNRNPH1 staining of GFP‐RBM3 i‐neurons at 37°C or after 72 h cooling at 32°C. Graphs below the images show quantification of somal, nuclear and cytoplasmic intensity per unit area respectively. The decrease of HNRNPH1 signals at 32°C is due to the global attenuation of protein production, which is not seen after total protein or GAPDH normalisation in western blot in (B) and Fig 4A. N = 280 (37°C) and 262 (32°C) cells. Scale bar: 5 μm.
Western blot of HNRNPH/F in HeLa cell input (total) lysate, IgG‐pulled down and HNRNPH1‐pulled down eluates at 37 and 32°C (48 h).
Quantification of input‐normalised RBM3 mRNA levels in HeLa cell input (total), IgG‐pulled down and HNRNPH1‐pulled down RNA at 37 and 32°C (48 h).
RNA G quadruplexes (rG4) within the RBM3 Exon 3–4 region are predicted using QGRS mapper. Deletion of the GGGG motif in the mutant RBM3 minigene is predicted to disrupt the rG4 structure overlapping this region.
RT‐PCR of WT and delGGGG RBM3 minigenes in control or HNRNPH1‐overexpressing (OX) HEK293T cells treated with SMG1 inhibitor at 37°C. PSI values of RBM3 PE are shown in the graphs on the right.
References
-
- Agrawal AA, Yu L, Smith PG, Buonamici S (2018) Targeting splicing abnormalities in cancer. Curr Opin Genet Dev 48: 67–74 - PubMed
-
- Arrich J, European Resuscitation Council Hypothermia After Cardiac Arrest Registry Study Group (2007) Clinical application of mild therapeutic hypothermia after cardiac arrest. Crit Care Med 35: 1041–1047 - PubMed
Publication types
MeSH terms
Substances
Grants and funding
LinkOut - more resources
Full Text Sources
Molecular Biology Databases
