

Autophagy Plays a Crucial Role in Ameloblast Differentiation
- PMID: 37249312
- PMCID: PMC10403961
- DOI: 10.1177/00220345231169220
Autophagy Plays a Crucial Role in Ameloblast Differentiation
Abstract
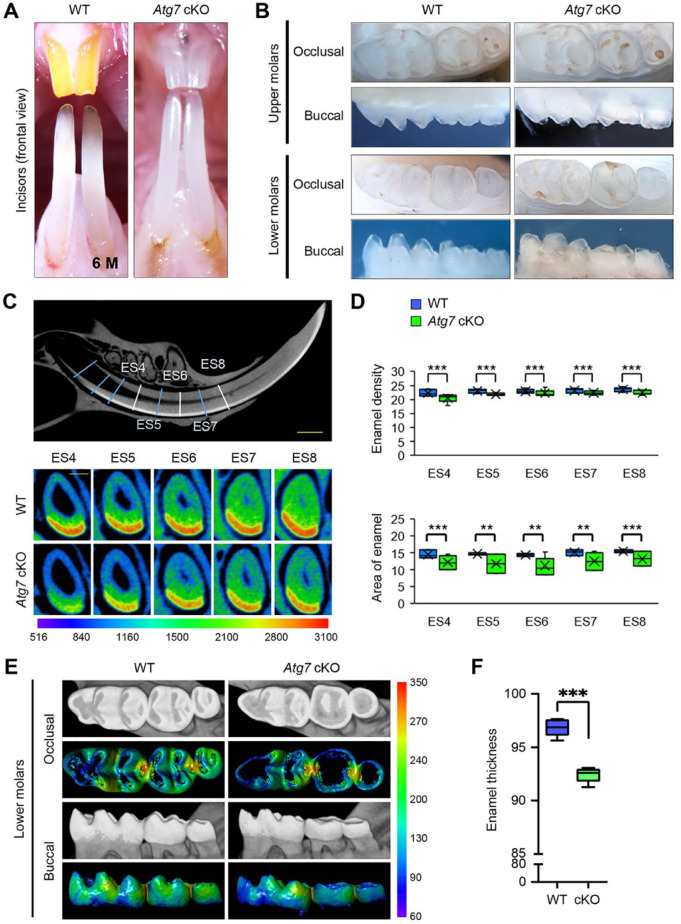
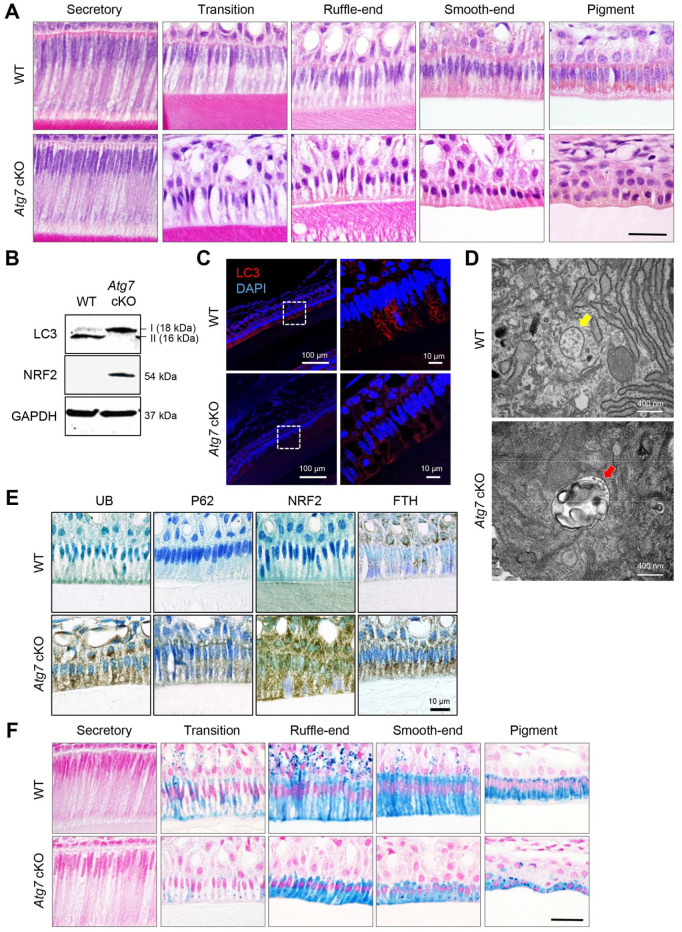
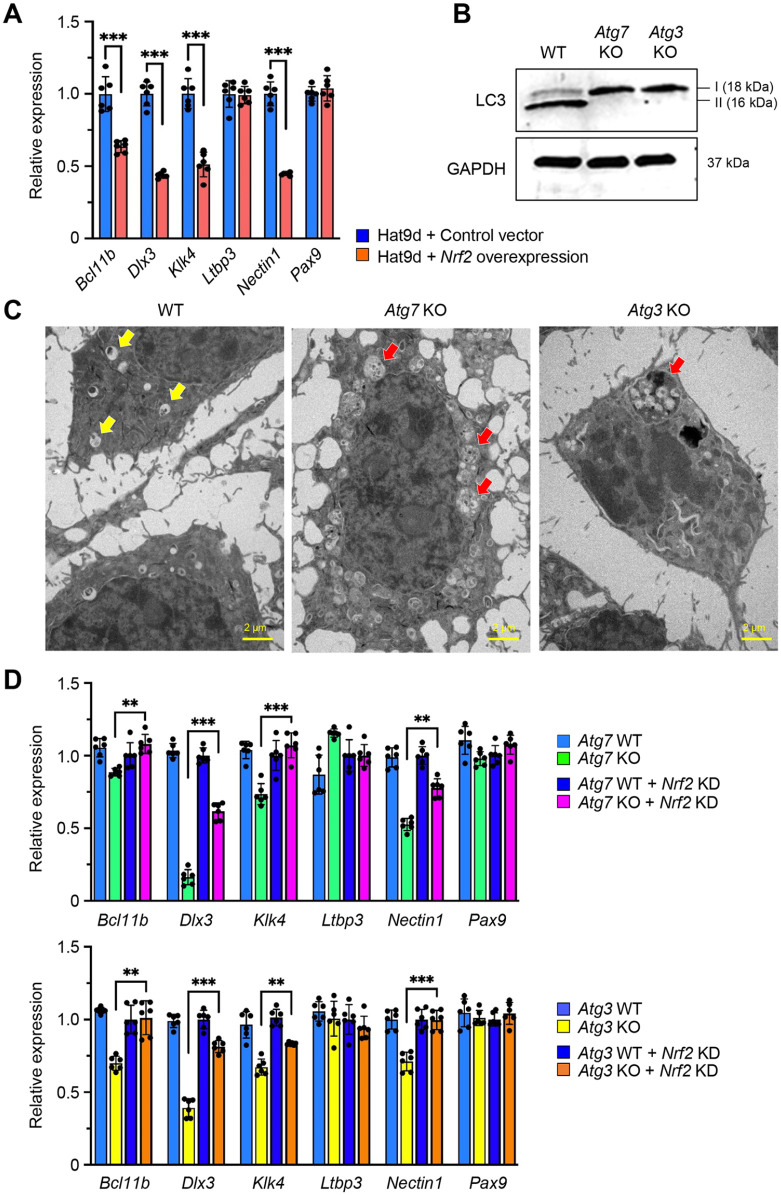
Tooth enamel is generated by ameloblasts. Any failure in amelogenesis results in defects in the enamel, a condition known as amelogenesis imperfecta. Here, we report that mice with deficient autophagy in epithelial-derived tissues (K14-Cre;Atg7F/F and K14-Cre;Atg3F/F conditional knockout mice) exhibit amelogenesis imperfecta. Micro-computed tomography imaging confirmed that enamel density and thickness were significantly reduced in the teeth of these mice. At the molecular level, ameloblast differentiation was compromised through ectopic accumulation and activation of NRF2, a specific substrate of autophagy. Through bioinformatic analyses, we identified Bcl11b, Dlx3, Klk4, Ltbp3, Nectin1, and Pax9 as candidate genes related to amelogenesis imperfecta and the NRF2-mediated pathway. To investigate the effects of the ectopic NRF2 pathway activation caused by the autophagy deficiency, we analyzed target gene expression and NRF2 binding to the promoter region of candidate target genes and found suppressed gene expression of Bcl11b, Dlx3, Klk4, and Nectin1 but not of Ltbp3 and Pax9. Taken together, our findings indicate that autophagy plays a crucial role in ameloblast differentiation and that its failure results in amelogenesis imperfecta through ectopic NRF2 activation.
Keywords: Atg3; Atg7; ameloblasts; amelogenesis imperfecta; enamel formation; tooth development.
Conflict of interest statement
The authors declared no potential conflicts of interest with respect to the research, authorship, and/or publication of this article.
Figures


Comment in
-
Letter to the Editor, "Autophagy Plays a Crucial Role in Ameloblast Differentiation".J Dent Res. 2024 Apr;103(4):452. doi: 10.1177/00220345231210462. Epub 2023 Nov 15. J Dent Res. 2024. PMID: 37968790 No abstract available.
Similar articles
-
KMT2D Regulates Tooth Enamel Development.J Dent Res. 2025 Jul;104(8):920-928. doi: 10.1177/00220345251320922. Epub 2025 Mar 18. J Dent Res. 2025. PMID: 40103013
-
Enamel and dental anomalies in latent-transforming growth factor beta-binding protein 3 mutant mice.Eur J Oral Sci. 2017 Feb;125(1):8-17. doi: 10.1111/eos.12328. Eur J Oral Sci. 2017. PMID: 28084688 Free PMC article.
-
Stim1 Regulates Enamel Mineralization and Ameloblast Modulation.J Dent Res. 2017 Nov;96(12):1422-1429. doi: 10.1177/0022034517719872. Epub 2017 Jul 21. J Dent Res. 2017. PMID: 28732182
-
Defining a new candidate gene for amelogenesis imperfecta: from molecular genetics to biochemistry.Biochem Genet. 2011 Feb;49(1-2):104-21. doi: 10.1007/s10528-010-9392-6. Epub 2010 Dec 3. Biochem Genet. 2011. PMID: 21127961 Review.
-
Enamel matrix proteins and ameloblast biology.Connect Tissue Res. 1995;32(1-4):97-107. doi: 10.3109/03008209509013710. Connect Tissue Res. 1995. PMID: 7554940 Review.
Cited by
-
Roles of calcium in ameloblasts during tooth development: A scoping review.J Taibah Univ Med Sci. 2024 Dec 30;20(1):25-39. doi: 10.1016/j.jtumed.2024.12.010. eCollection 2025 Feb. J Taibah Univ Med Sci. 2024. PMID: 39839572 Free PMC article. Review.
-
Bimaxillary fixed implant-supported zirconium oxide prosthesis therapy of an adolescent patient with non-syndromic oligodontia and two WNT10 variants: a case report.Ann Med Surg (Lond). 2024 Mar 19;86(5):3072-3081. doi: 10.1097/MS9.0000000000001936. eCollection 2024 May. Ann Med Surg (Lond). 2024. PMID: 38694351 Free PMC article.
-
The role of autophagy in odontogenesis, dental implant surgery, periapical and periodontal diseases.J Cell Mol Med. 2024 Apr;28(8):e18297. doi: 10.1111/jcmm.18297. J Cell Mol Med. 2024. PMID: 38613351 Free PMC article. Review.
References
-
- Aldred MJ, Savarirayan R, Crawford PJ. 2003. Amelogenesis imperfecta: a classification and catalogue for the 21st century. Oral Dis. 9(1):19–23. - PubMed
Publication types
MeSH terms
Substances
Grants and funding
LinkOut - more resources
Full Text Sources
Molecular Biology Databases
Miscellaneous
