. 2023 May 30:12:e86023.
doi: 10.7554/eLife.86023.

Hypermetabolism in mice carrying a near-complete human chromosome 21

Affiliations

Hypermetabolism in mice carrying a near-complete human chromosome 21

Dylan C Sarver et al. Elife. .

Abstract

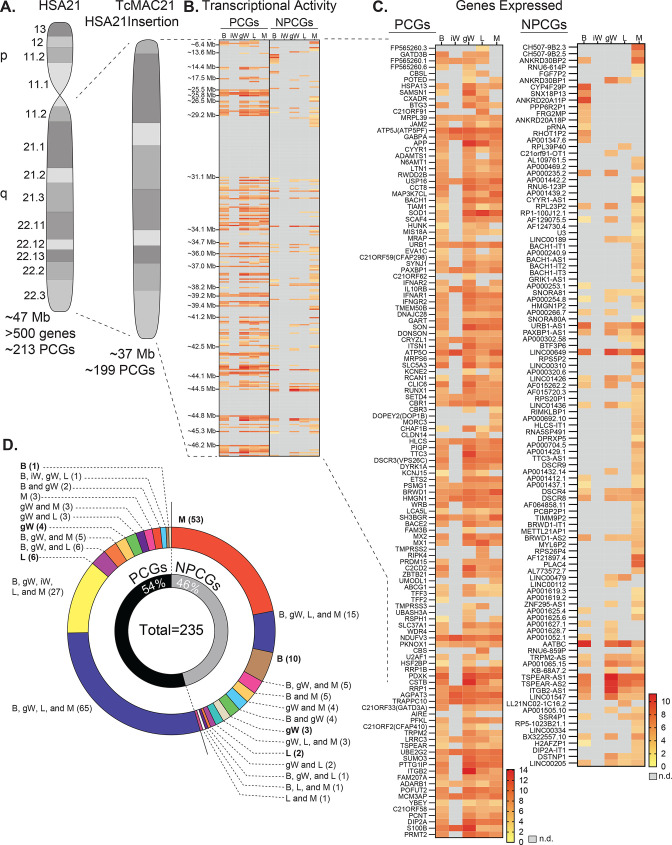
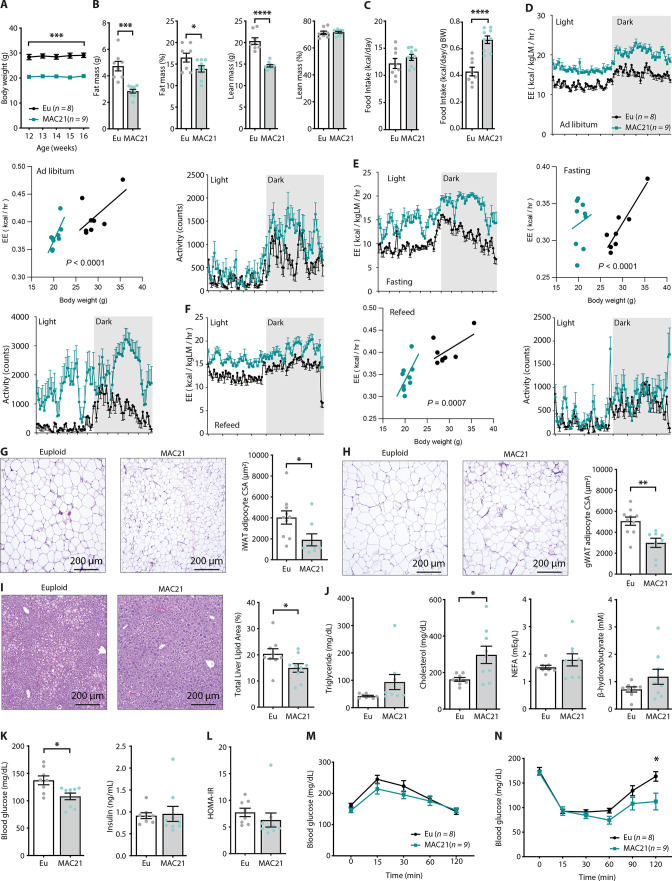
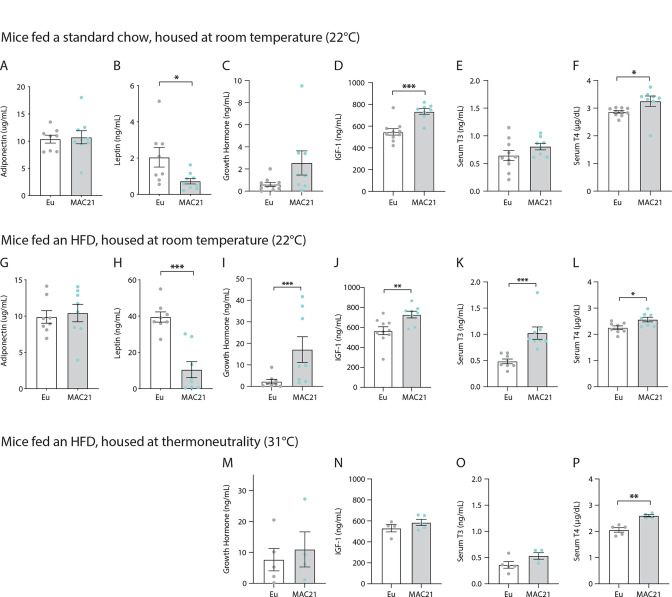
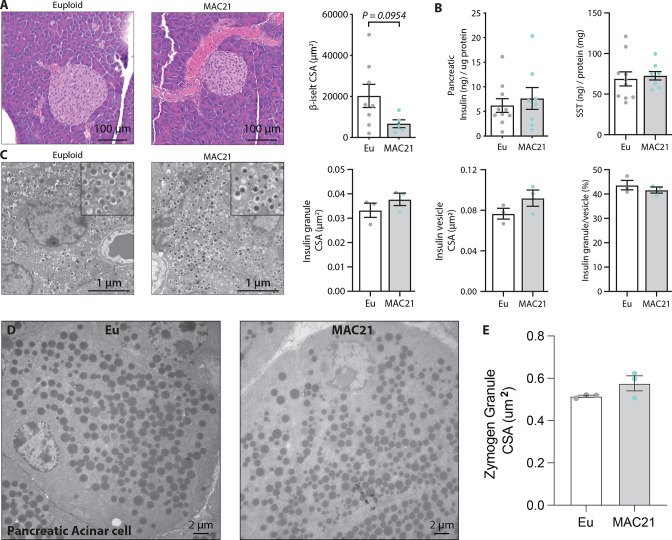
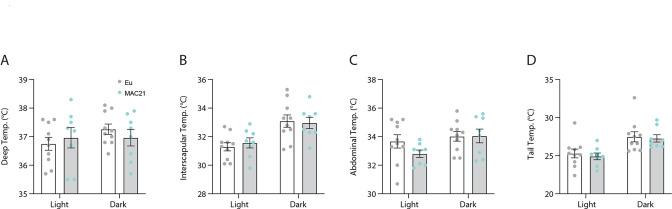
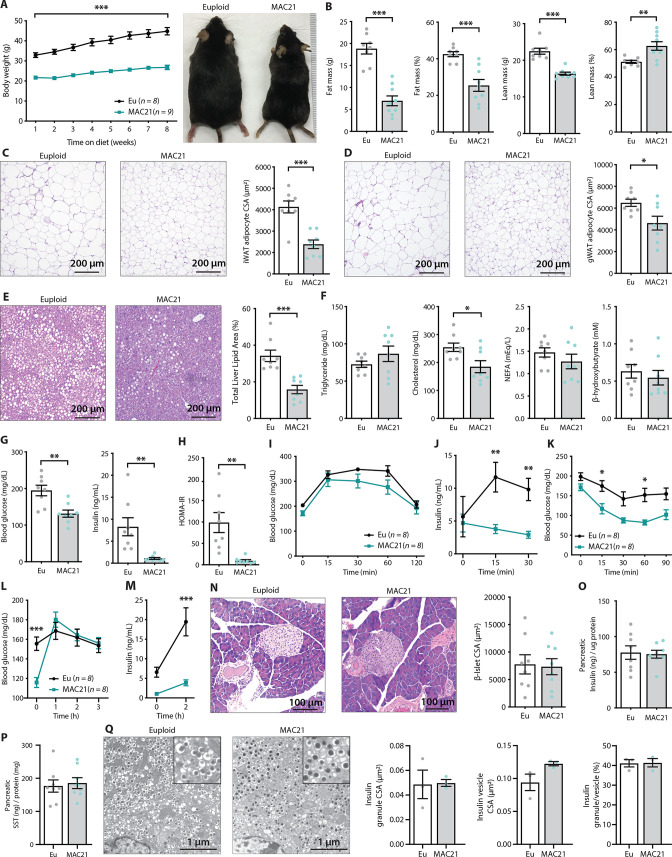
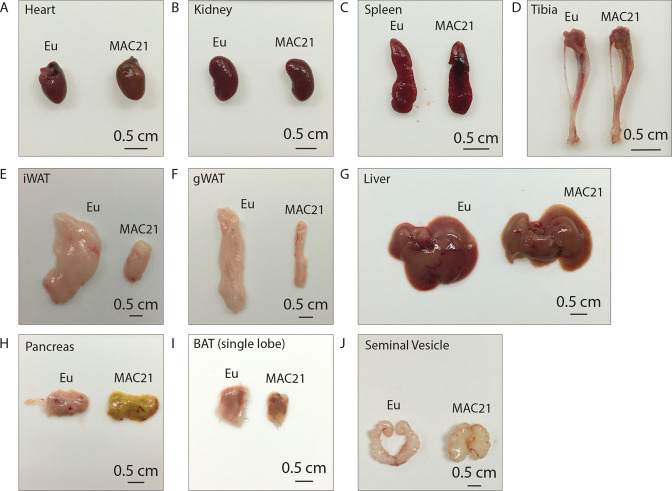
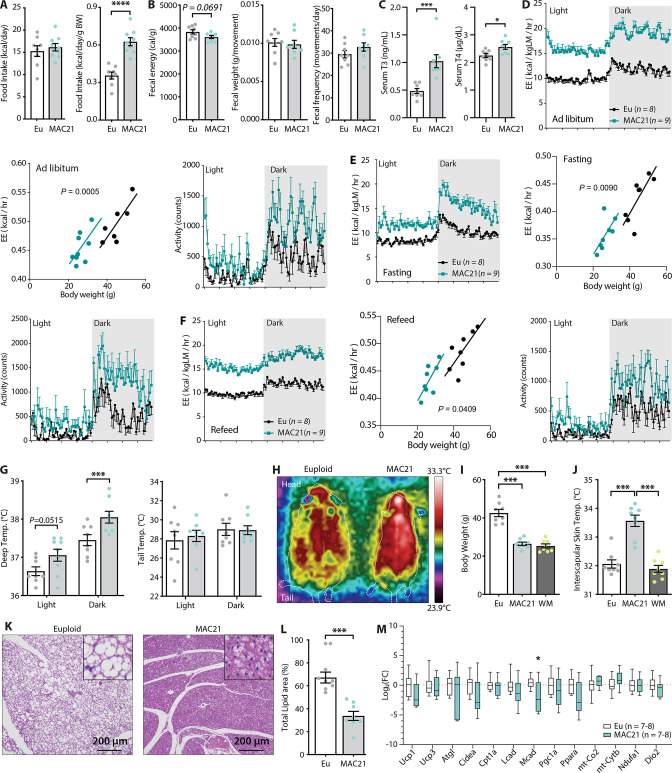
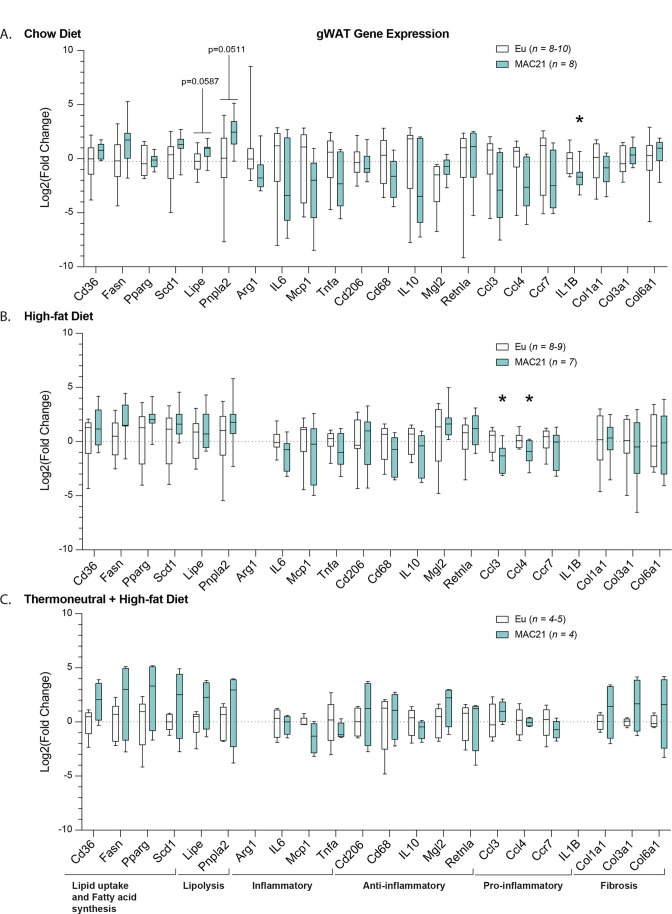
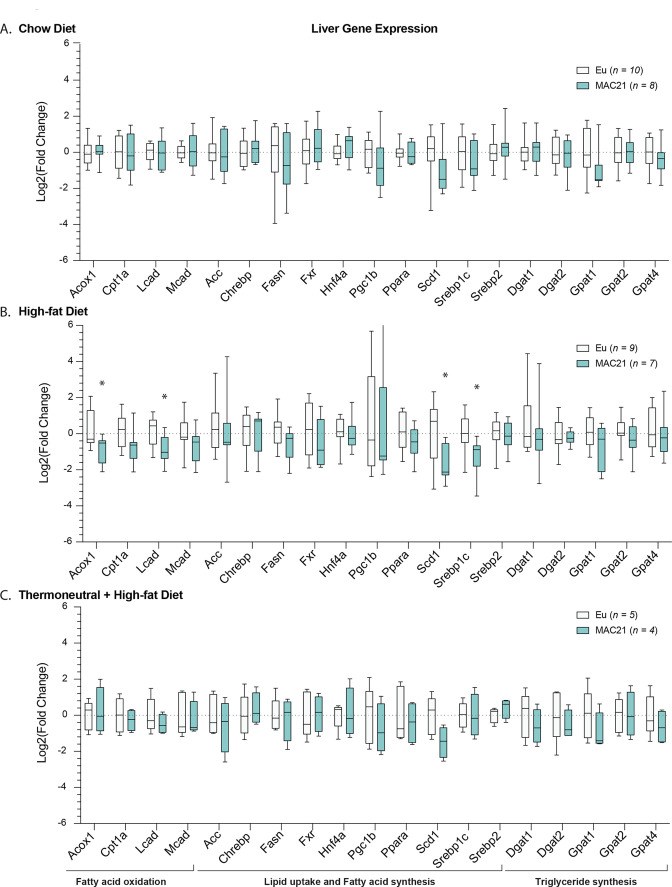
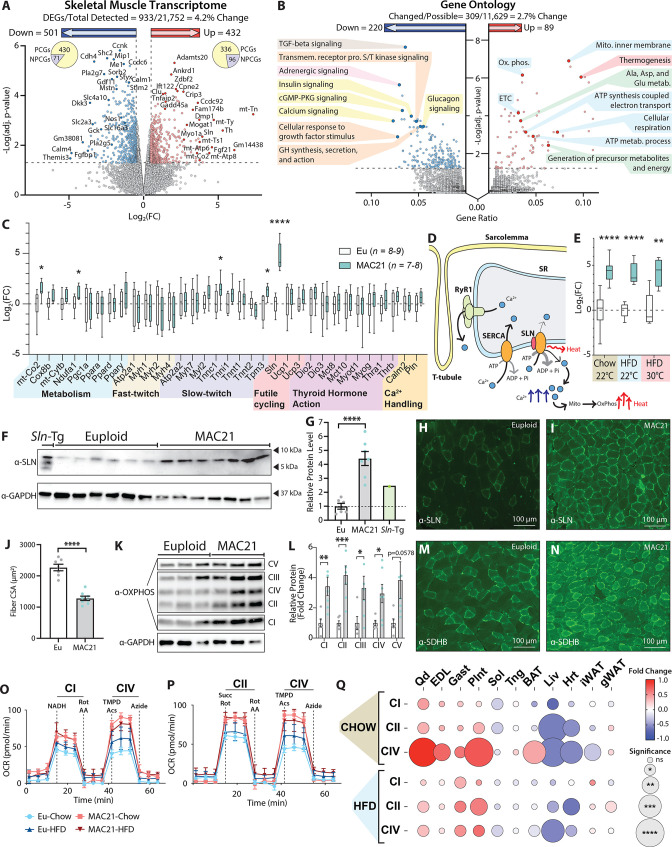
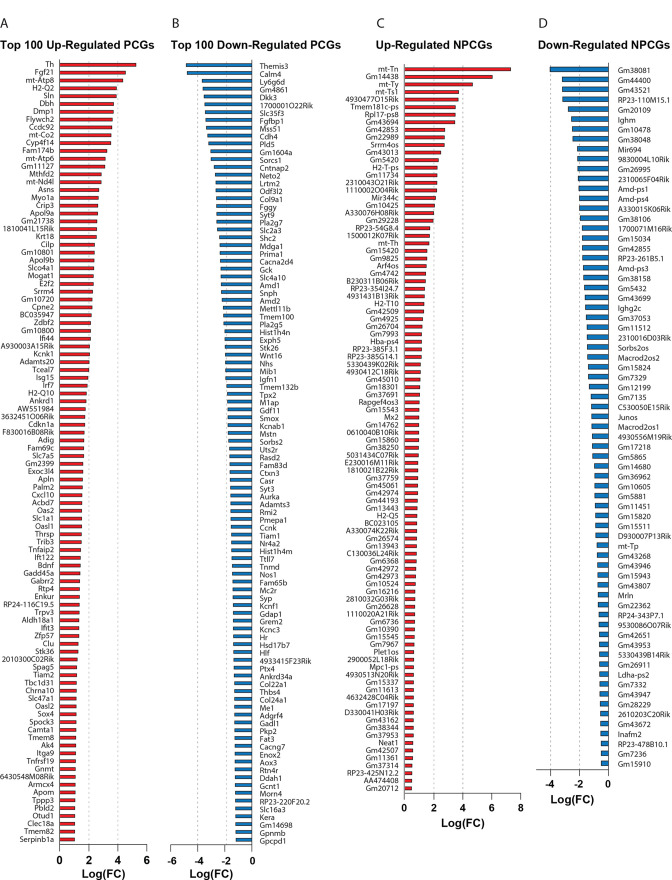
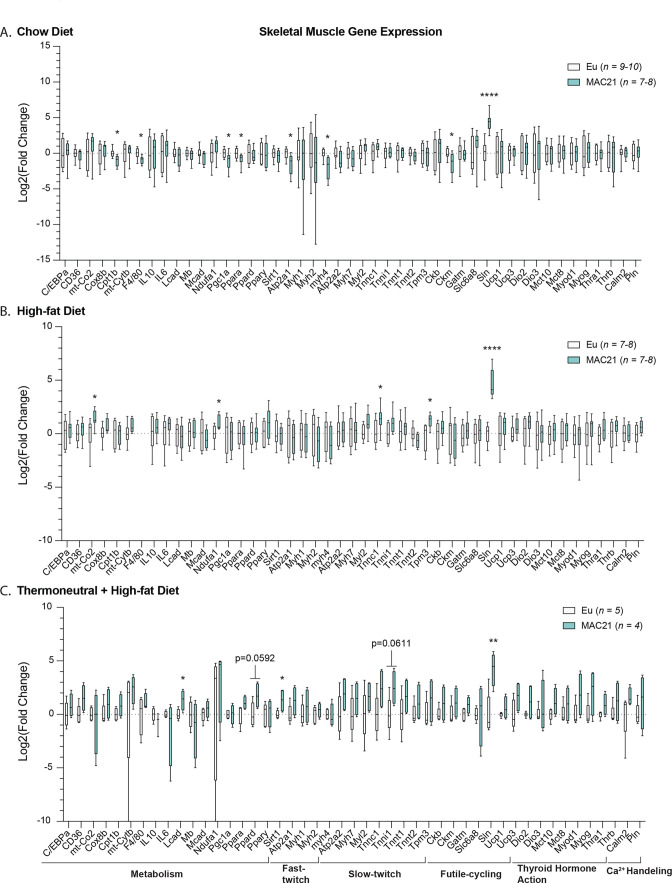
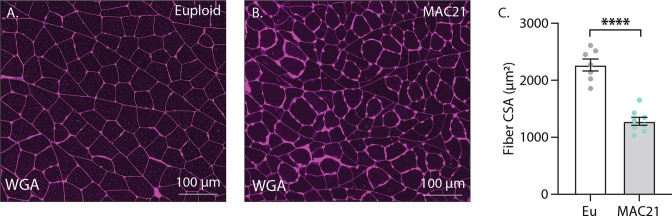
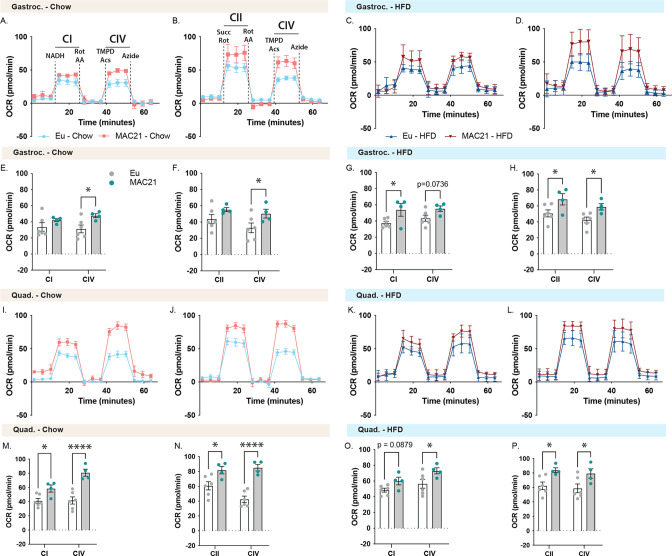
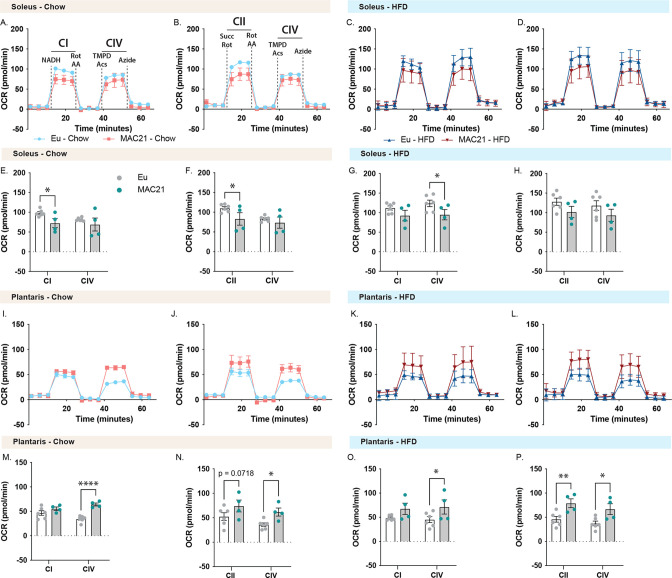
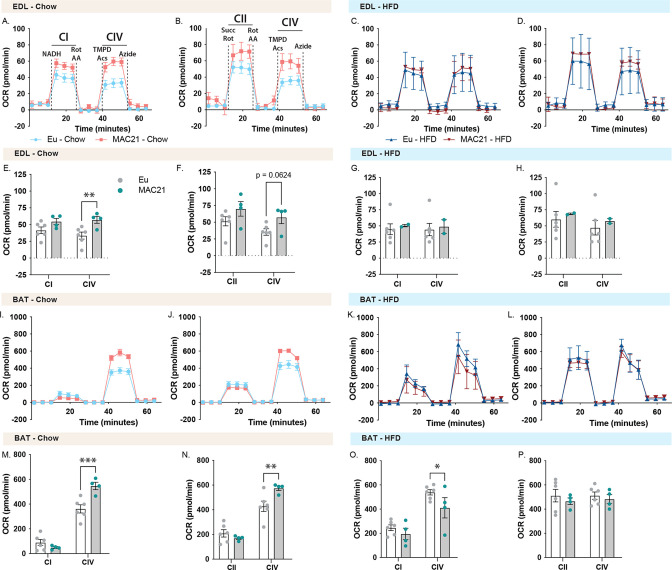
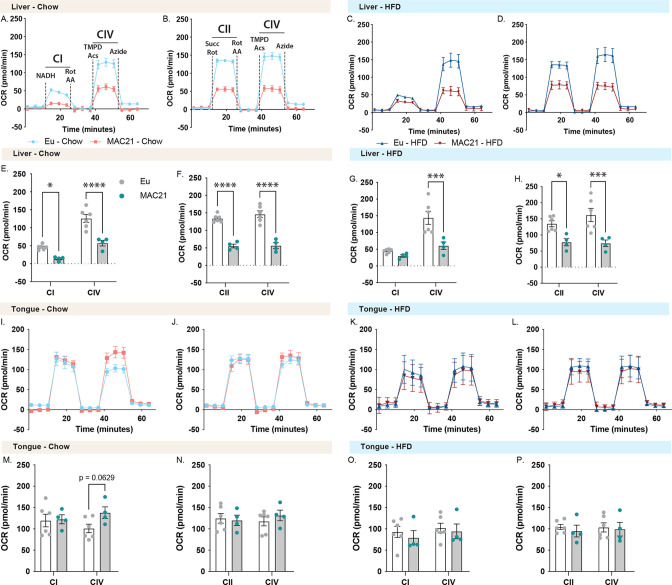
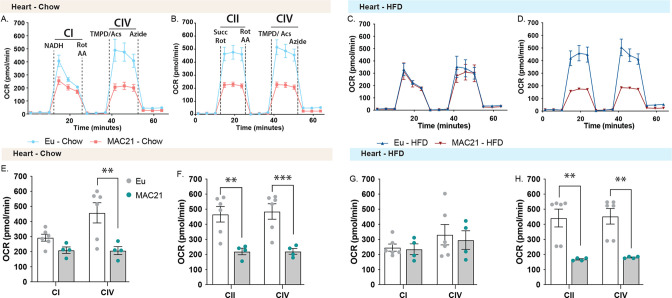
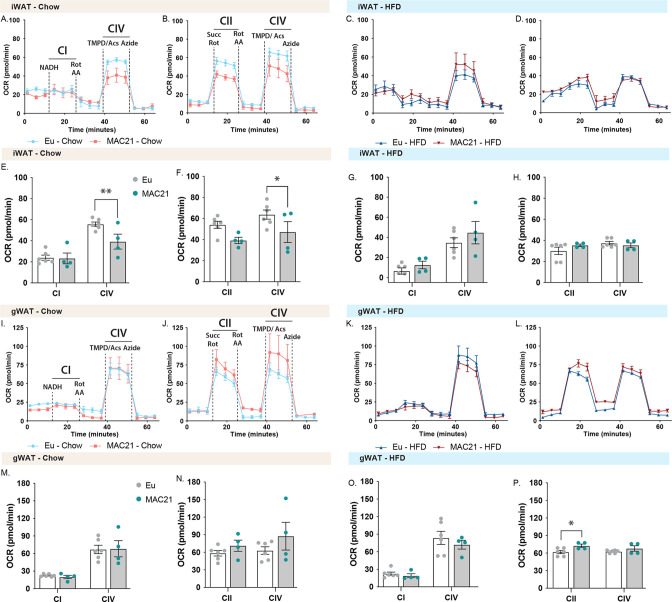
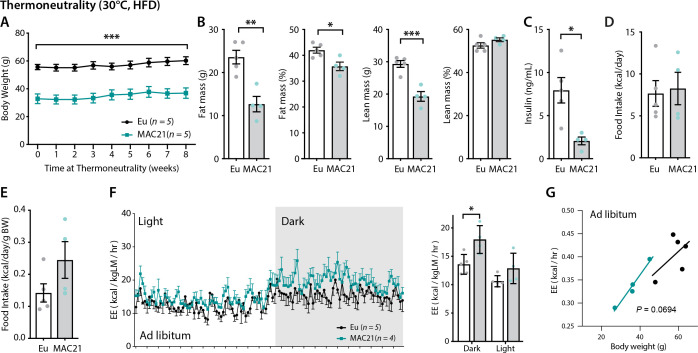
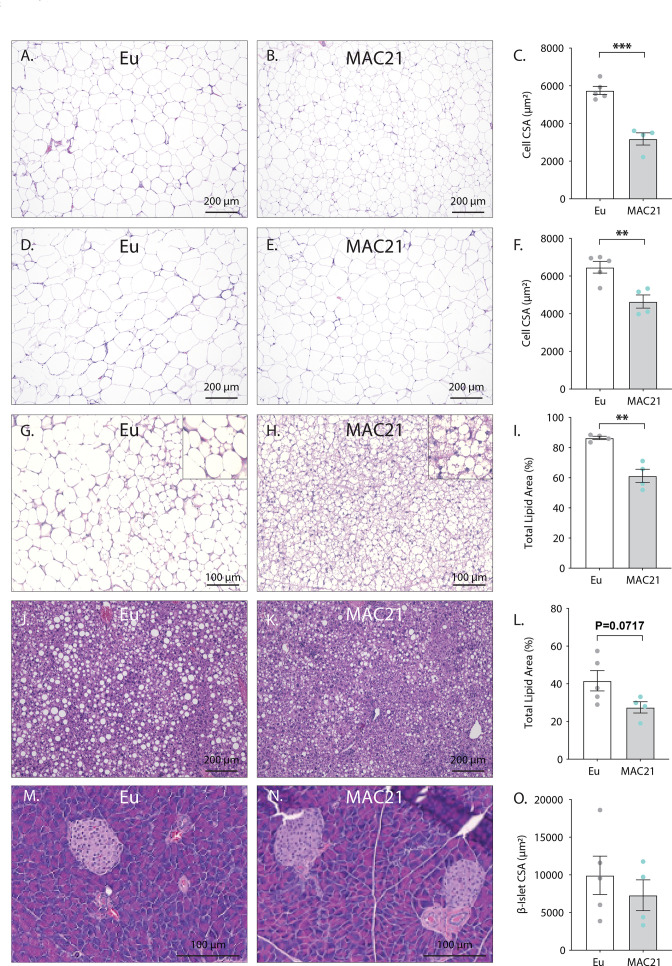
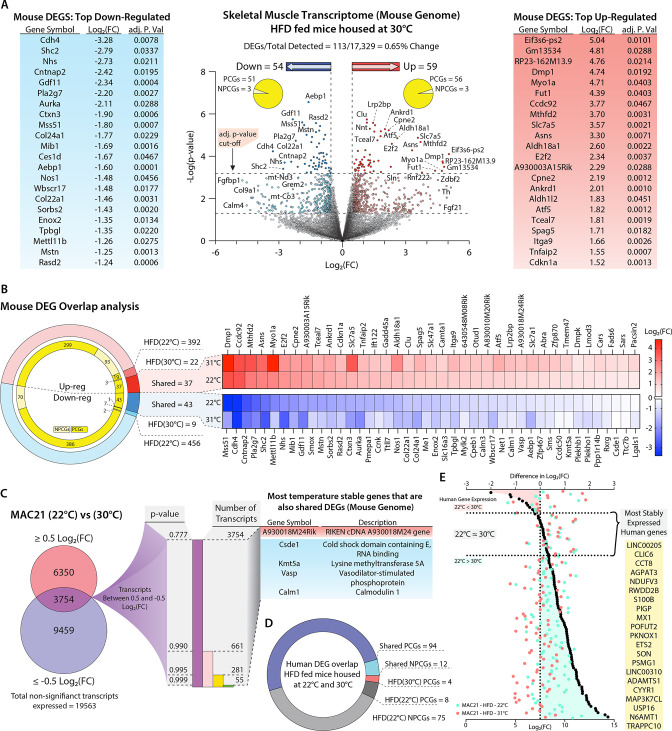
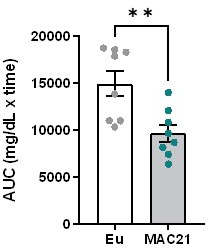
The consequences of aneuploidy have traditionally been studied in cell and animal models in which the extrachromosomal DNA is from the same species. Here, we explore a fundamental question concerning the impact of aneuploidy on systemic metabolism using a non-mosaic transchromosomic mouse model (TcMAC21) carrying a near-complete human chromosome 21. Independent of diets and housing temperatures, TcMAC21 mice consume more calories, are hyperactive and hypermetabolic, remain consistently lean and profoundly insulin sensitive, and have a higher body temperature. The hypermetabolism and elevated thermogenesis are likely due to a combination of increased activity level and sarcolipin overexpression in the skeletal muscle, resulting in futile sarco(endo)plasmic reticulum Ca2+ ATPase (SERCA) activity and energy dissipation. Mitochondrial respiration is also markedly increased in skeletal muscle to meet the high ATP demand created by the futile cycle and hyperactivity. This serendipitous discovery provides proof-of-concept that sarcolipin-mediated thermogenesis via uncoupling of the SERCA pump can be harnessed to promote energy expenditure and metabolic health.

Keywords: SERCA pump; aneuploidy; chromosomes; futile cycle; gene expression; hypermetabolism; mouse; sarcolipin; trisomy.


Conflict of interest statement

DS, CX, SR, SA, AJ, FG, MD, MP, YK, RR, GW No competing interests declared, MO M.O. is CEO, employee, and shareholder of Trans Chromosomics, Inc which manages commercial use of the TcMAC21 mouse. We declare that none of the authors has a conflict of interest

Figures

Figure 1.
Figure 1.. Human chromosome 21 genes are differentially expressed and regulated in mouse adipose tissue, liver, and skeletal muscle.
(A) Graphical representation of human chromosome 21 (Hsa21) and the entire long arm (Hsa21q) region carried by a mouse artificial chromosome in the transchromosomic mouse model (TcMAC21). Four deletions that occurred during generation of the transchromosomic mice eliminate 14/213 protein-coding genes (PCGs; 7%) and 105/487 predicted or known non-protein-coding genes (NPCGs; 22%) (Kazuki et al., 2020). (B) Global view of transcriptionally expressed and repressed PCG and NPCG regions over the entire Hsa21q across five tissues. Gray box denotes transcript that is not detected. (C) Transcriptional activity map showing only Hsa21 genes expressed by at least one tissue. Gray box denotes transcript that is not detected. (D) Overlap analysis showing shared expression of human PCGs and NPCGs across five tissues. Of the 235 unique human genes expressed by the TcMAC21 mice, 54% are PCGs and 46% are NPCGs. B, brown adipose tissue; iW, inguinal white adipose tissue; gW, gonadal white adipose tissue; L, liver; M, skeletal muscle (gastrocnemius); n.d., not detected. n=5 RNA samples per group per tissue type. Mice were on high-fat diet for 16 weeks at the time of tissue collection.
Figure 2.
Figure 2.. Hypermetabolism in TcMAC21 mice fed a standard chow.
(A) Body weights of mice fed a standard chow. (B) Body composition analysis of fat and lean mass (relative to body weight). (C) Absolute and relative (normalized to body weight) food intake over a 24 hr period. (D–F) Energy expenditure (EE) and physical activity level over 24 hr period in ad libitum chow-fed mice (D), during fasting (E), and refeeding after a fast (F). EE is normalized to lean mass in the 24 hr trace or analyzed by ANCOVA where body weight was used as a covariate. (G) Hematoxylin and eosin (H&E)-stained sections of inguinal white adipose tissue (iWAT) and adipocyte cross-sectional area (CSA) quantification. (H) Histology of gonadal white adipose tissue (gWAT) and adipocyte CSA quantification. (I) Histology of liver tissues with quantification of area covered by lipid droplets per focal plane. (J) Fasting serum triglyceride, cholesterol, non-esterified fatty acids (NEFA), β-hydroxybutyrate (ketone) levels. (K) Fasting blood glucose and insulin levels. (L) Insulin resistance index (homeostatic model assessment for insulin resistance [HOMA-IR]). (M) Glucose tolerance tests. (N) Insulin tolerance tests. Sample size for all data: euploid (n=8) and TcMAC21 (n=9).
Figure 2—figure supplement 1.
Figure 2—figure supplement 1.. ELISA data from euploid and MAC21 mice.
Circulating levels of adiponectin (A), leptin (B), growth hormone (C), IGF-1 (D), thyroid hormone (T3, E), and thyroxine (T4, F) in chow-fed mice housed at room temperature (22°C). Circulating levels of adiponectin (G), leptin (H), growth hormone (I), IGF-1 (J), T3 (K), and T4 (L) in high-fat diet [HFD]-fed mice housed at 22°C. Circulating levels of growth hormone (M), IGF-1 (N), T3 (O), and T4 (P) in HFD-fed mice housed at thermoneutrality (30°C). Sample size for panel (A–L): euploid (n=8) and TcMAC21 (n=9). Sample size for panels M–P: euploid (n=5) and TcMAC21 (n=4–5).
Figure 2—figure supplement 2.
Figure 2—figure supplement 2.. Electron micrograph quantification of pancreatic islet and acinar cell zymogen granules.
(A) Histology of pancreas and quantification of β-islet cross-sectional area (CSA) in TcMAC21 and euploid mice. (B) Pancreatic insulin and somatostatin (SST) contents (normalized to pancreatic protein input). (C) Electron micrographs (EM) of pancreatic β-cells showing dense insulin granules and their surrounding vesicles, and the quantification of insulin granule CSA, insulin vesicle CSA, and the ratio of insulin granule to insulin vesicle. n=8–10 euploid and 5–8 TcMAC21 chow-fed samples used for pancreatic analysis by hematoxylin and eosin (H&E) and protein quantification, graphs A and B. n=3 euploid and 3 TcMAC21 fed standard chow were used for EM quantification; each data point represents 1200 insulin granules and 1200 insulin vesicles quantified across six unique locations per mouse, graphs C. (D and E) Representative euploid and TcMAC21 acinar cells. (E) Average zymogen granule CSA quantification. Each data point represents a mouse average comprised of at least 3600 zymogen granules from six unique locations within the pancreas. Analyses were performed on a total of six randomly selected high-fat diet (HFD)-fed mice (WT, n=3; KO, n=3).
Figure 2—figure supplement 3.
Figure 2—figure supplement 3.. Light and dark cycle body temperature of euploid and MAC21 mice fed a standard chow.
(A) Deep colonic temperature. (B) Interscapular skin temperature. (C) Abdominal skin temperature. (D) Tail skin temperature. Each data point represents the average of 3 days of independent data collection. Sample size: euploid (n=10) and TcMAC21 (n=8).
Figure 3.
Figure 3.. TcMAC21 mice are resistant to diet-induced obesity and metabolic dysfunction.
(A) Body weights over time on a high-fat diet and representative mouse images. (B) Body composition analysis of fat and lean mass. (C) Histology of inguinal white adipose tissue (iWAT) and quantification of adipocyte cross-sectional area (CSA). (D) Histology of gonadal white adipose tissue (gWAT) and quantification of adipocyte CSA. (E) Histology of liver tissue and quantification of area covered by lipid droplets per focal plane. (F) Fasting serum triglyceride, cholesterol, non-esterified fatty acids (NEFA), β-hydroxybutyrate (ketone) levels. (G) Fasting blood glucose and insulin levels. (H) Insulin resistance index (homeostatic model assessment for insulin resistance [HOMA-IR]). (I) Glucose tolerance tests (GTTs). (J) Serum insulin levels during GTT. (K) Insulin tolerance tests (ITTs). (L) Blood glucose levels after an overnight (16 hr) fast and 1, 2, and 3 hr of food reintroduction. (M) Serum insulin levels after a 16 hr fast and 2 hr of refeeding. (N) Pancreas histology and quantification of β-islet CSA. (O–P) Pancreatic insulin and somatostatin (SST) contents (normalized to pancreatic protein input). (Q) Electron micrographs (EM) of pancreatic β-cells showing dense insulin granules and their surrounding vesicles, and quantification of insulin granule CSA, insulin vesicle CSA, and the ratio of insulin granule to insulin vesicle. n=8 euploid and 8–9 TcMAC21 mice for all graphs from A to P. n=3 euploid and 3 TcMAC21 used for EM quantification; each data point represents 1200 insulin granules and 1200 insulin vesicles quantified across six unique locations per mouse, graphs Q.
Figure 3—figure supplement 1.
Figure 3—figure supplement 1.. Representative tissue dissection images of euploid and MAC21 mice fed a high-fat diet.
Representative side-by-side dissection images of (A) heart, (B) kidney, (C) spleen, (D) tibia, (E) inguinal white adipose tissue (iWAT), (F) gonadal white adipose tissue (gWAT), (G) liver, (H) pancreas, (I) brown adipose tissue (BAT), and (J) seminal vesicle. Mice were housed at ambient room temperature (22°C).
Figure 4.
Figure 4.. Hypermetabolism in TcMAC21 mice fed a high-fat diet (HFD).
(A) Absolute and relative (normalized to body weight) food intake in mice fed an HFD. (B) Fecal energy content, fecal weight, and fecal frequency of TcMAC21 mice and euploid controls. (C) Serum triiodothyronine (T3) and thyroxine (T4) levels. (D–F) Energy expenditure (EE) and activity level over 24 hr period in ad libitum HFD-fed mice (D), during fasting (E), and refeeding after a fast (F). EE is normalized to lean mass in the 24 hr trace or analyzed by ANCOVA where body weight was used as a covariate. (G) Deep colonic and tail temperature measured over 3 days in both the light and dark cycle. (H) Representative infrared images of mice. (I) Body weights of euploid, TcMAC21, and weight-matched (WM) control C57BL/6 mice. (J) Interscapular skin temperature of euploid, TcMAC21, and WM control mice. (K) Representative histology of brown adipose tissue (BAT). (L) Quantification of percent total lipid area coverage per focal plane in BAT of euploid and TcMAC21. (M) Expression of mouse genes (by qPCR) known to play major metabolic roles in BAT. Sample size for all data: euploid (n=8) and TcMAC21 (n=9).
Figure 5.
Figure 5.. Hypermetabolism of TcMAC21 mice is uncoupled from changes in adipose and liver transcriptomes.
(A–D) Differentially expressed mouse genes (DEGs), both protein-coding (PCG) and non-protein-coding genes (NPCG) in brown adipose tissue (BAT), liver, gonadal white adipose tissue (gWAT), and inguinal white adipose tissue (iWAT). All data is relative to euploid and presented as Log2(FC). The list of genes represents all up- and down-regulated mouse genes (significant by adjusted p-value cut-off) for all four tissues. The red bars indicate upregulated genes and the blue bars indicate downregulated genes. (E) General view and summary of transcriptional changes in BAT, liver, gWAT, and iWAT to highlight the strikingly minimal changes in the mouse transcriptome across the four tissues. There are only a combined total of 114 differentially expressed genes (DEGs) across four tissues, with the relative percentage (out of the 114 DEGs) shown for each tissue. Of the 114 DEGs, 105 are protein-coding genes (PCGs; dark yellow bar) and 9 are non-protein-coding genes (NPCGs; light yellow bar). Of the 114 DEGs, 46 are upregulated (red bar) and 68 are downregulated (blue bar). In total, only a combined 0.53% change is noted in the transcriptome of all four tissues (out of the 21,752 RNAs detected). Sample size for RNA-sequencing: euploid (n=5 per tissue) and TcMAC21 (n=5 per tissue).
Figure 5—figure supplement 1.
Figure 5—figure supplement 1.. Volcano plot of all qPCR results from brown adipose tissue (BAT), skeletal muscle, and white adipose tissue.
Overlaid results of euploid and MAC21 mice across all conditions assayed (chow diet at 22°C, high-fat diet at 22°C, and high-fat diet at 30°C) for (A) BAT, (B) gastrocnemius (skeletal muscle), (C) inguinal white adipose tissue (iWAT), (D) gonadal white adipose tissue (gWAT), and (E) liver. Significant and/or relevant genes are labeled. Thermoneutral = 30°C housing condition.
Figure 5—figure supplement 2.
Figure 5—figure supplement 2.. Gene expression analysis in brown adipose tissue.
qPCR analysis of brown adipose tissue genes important for futile cycling, lipid metabolism, mitochondrial function, and thyroid hormone action in euploid and MAC21 male mice fed a standard chow and housed at 22°C (A), fed a high-fat diet and housed at 22°C (B), and fed a high-fat diet and housed at thermoneutral 30°C (C).
Figure 5—figure supplement 3.
Figure 5—figure supplement 3.. Gene expression analysis in inguinal white adipose tissue (iWAT).
qPCR analysis of iWAT genes important for lipid uptake, lipolysis, inflammation, fibrosis, and browning in euploid and MAC21 male mice fed a standard chow diet and housed at 22°C (A), fed a high-fat diet and housed at 22°C (B), and fed a high-fat diet and housed at thermoneutral 30°C (C).
Figure 5—figure supplement 4.
Figure 5—figure supplement 4.. Gene expression analysis in gonadal white adipose tissue (gWAT).
qPCR analysis of gWAT genes important for lipid uptake, fatty acid synthesis, lipolysis, inflammation, and fibrosis in euploid and MAC21 male mice fed a standard chow diet and housed at 22°C (A), fed a high-fat diet and housed at 22°C (B), and fed a high-fat diet and housed at thermoneutral 30°C (C).
Figure 5—figure supplement 5.
Figure 5—figure supplement 5.. Gene expression analysis in liver.
qPCR analysis of liver genes important for lipid uptake, fatty acid synthesis and oxidation, and triglyceride synthesis in euploid and MAC21 male mice fed a standard chow and housed at 22°C (A), fed a high-fat diet and housed at 22°C (B), and fed a high-fat diet and housed at thermoneutral 30°C (C).
Figure 6.
Figure 6.. Sarcolipin overexpression in skeletal muscle drives TcMAC21 hypermetabolism.
(A) RNA-sequencing analysis reveals changes in TcMAC21 relative to euploid skeletal muscle (gastrocnemius). Volcano plot of skeletal muscle transcriptome (transcripts from the mouse genome only). The lower dotted line denotes significance at the adjusted p-value cut-off (adj. p=0.05). The vertical dotted lines denote a Log2(FC) of –0.5 or 0.5. (B) Gene Ontology analysis of RNA-sequencing results using ClusterProfiler (Yu et al., 2012). (C) Expression of genes (by qPCR) known to be involved in metabolism, fast- or slow-twitch fiber types, futile cycling, thyroid hormone action, and calcium handling in skeletal muscle (gastrocnemius). (D) Graphical representation of Ca2+ cycling through the sarcoplasmic reticulum (SR). Not shown is the store-operated calcium entry pathway involving Ca2+ channels located at the plasma membrane/T-tubule. Ca2+ leaks out of the SR through the ryanodine receptor (RyR1) and is re-sequestered back to the SR by the sarco(endo)plasmic reticulum Ca2+ ATPase (SERCA). SERCA pump uses the energy derived from ATP hydrolysis to translocate Ca2+ from the cytosol back into the SR. When SLN binds to SERCA, it promotes Ca2+ slippage without affecting the ATPase activity of SERCA. By doing so, SLN uncouples Ca2+ transport activity from ATP hydrolysis of SERCA with concomitant heat generation. The increased duration of Ca2+ transients in the cytosol also elevates mitochondrial Ca2+, leading to enhanced mitochondrial oxidative metabolism and heat generation. (E) qPCR analysis of sarcolipin (Sln) expression in euploid and TcMAC21 mice fed a standard chow, high-fat diet (HFD), and HFD while housed at thermoneutrality (30°C). (F) Immunoblot of SLN and GAPDH (loading control) in muscle lysates of euploid, TcMAC21, and SLN overexpressing transgenic mice (Sln-Tg). (G) Immunoblot quantification of SLN using GAPDH as a loading control. The dotted line marks the euploid expression level. (H–I) Gastrocnemius immunofluorescent labeling of SLN-expressing muscle fibers. (J) Muscle fiber cross-sectional area (CSA) quantification from wheat germ agglutinin (WGA)-stained gastrocnemius. (K) Immunoblot of OXPHOS complex levels, with GAPDH as a loading control. (L) Quantification of OXPHOS complex levels relative to GAPDH. (M–N) Gastrocnemius immunofluorescent labeling of succinate dehydrogenase subunit B (SDHB)-expressing muscle fibers. (O–P) Seahorse respirometry analyses of frozen tissue samples. Shown here are the quadricep group average tracings for oxygen consumption rate (OCR) across the experimental time course. (Q) OCR of TcMAC21 mitochondrial complexes I, II, and IV relative to euploid, for 11 separate tissues (quadricep, Qd; extensor digitorum longus, EDL; gastrocnemius, Gast; plantaris, Plnt; soleus, Sol; tongue, Tng; brown adipose tissue, BAT; liver, Liv; heart, Hrt; inguinal white adipose tissue, iWAT; gonadal white adipose tissue, gWAT) and two dietary conditions (chow and high-fat diet [HFD]). DEGs, differentially expressed genes; PCGs, protein-coding genes; NPCGs, non-protein-coding genes. n=5 euploid and 4 TcMAC21 for RNA-sequencing experiments. n=8–9 euploid and 7–8 TcMAC21 for HFD qPCR. n=7–10 euploid and TcMAC21 for chow qPCR. n=4–5 euploid and TcMAC21 for HFD+thermoneutrality qPCR. n=6 euploid and 7 TcMAC21 for all immunoblots. n=7 euploid and 8 TcMAC21 for gastrocnemius CSA quantification. n=6 euploid and 4 TcMAC21 for all mitochondrial respiration assays; each biological replicate represents the average of three technical replicates.
Figure 6—figure supplement 1.
Figure 6—figure supplement 1.. The top up- and downregulated genes in skeletal muscle based on RNA-sequencing data.
(A) Top 100 upregulated protein-coding genes. (B) Top 100 downregulated protein-coding genes. (C) All upregulated non-protein-coding genes. (D) All downregulated non-protein-coding genes. n=5 euploid and 4 MAC21 for RNA-sequencing experiments. All mice were fed a high-fat diet and housed at ambient room temperature (22°C).
Figure 6—figure supplement 2.
Figure 6—figure supplement 2.. Gene expression analysis in skeletal muscle.
qPCR analysis of gastrocnemius skeletal muscle genes important for general metabolism, fast- and slow-twitch fiber types, futile cycling, thyroid hormone action, and calcium handling in euploid and MAC21 male mice fed a standard chow diet and housed at 22°C (A), fed a high-fat diet and housed at 22°C (B), and fed a high-fat diet and housed at thermoneutral 30°C (C).
Figure 6—figure supplement 3.
Figure 6—figure supplement 3.. Skeletal muscle cross-sectional area (CSA) analysis of MAC21 and euploid mice fed a high-fat diet.
(A–B) Representative wheat germ agglutinin (WGA)-stained gastrocnemius skeletal muscle samples. (C) Muscle fiber CSA analysis of TcMAC21 mice (n=7) and euploid controls (n=8). Mice were housed at ambient room temperature (22°C).
Figure 6—figure supplement 4.
Figure 6—figure supplement 4.. Mitochondrial respirometry analysis of gastrocnemius and quadricep muscle.
(A and C) Average group gastrocnemius (Gastroc) oxygen consumption rate (OCR) traces using NADH as a substrate for euploid (Eu) and MAC21 male mice fed a standard chow or high-fat diet (HFD), respectively. (B and D) Average group Gastroc OCR traces using succinate as a substrate in the presence of rotenone (Rot) for euploid and MAC21 mice fed a standard chow or HFD, respectively. (E and G) Mitochondrial complex I and IV OCR quantification for A and C, respectively. (F and H) Mitochondrial complex II and IV OCR quantification for B and D, respectively. (I and K) Average group quadricep (Quad) OCR traces using NADH as a substrate for euploid and MAC21 mice fed a standard chow or HFD, respectively. (J and L) Average group Quad OCR traces using succinate as a substrate in the presence of Rot for euploid and MAC21 mice fed a standard chow or HFD, respectively. (M and O) Mitochondrial complex I and IV OCR quantification for I and K, respectively. (N and P) Mitochondrial complex II and IV OCR quantification for J and L, respectively. All mice used for respirometry were housed at ambient room temperature (22°C). AA, antimycin A; TMPD, N,N,N’,N’-tetramethyl-p-phenylenediamine; Acs, ascorbate; CI, mitochondrial complex I; CII, mitochondrial complex II; CIV, mitochondrial complex IV.
Figure 6—figure supplement 5.
Figure 6—figure supplement 5.. Mitochondrial respirometry analysis of soleus and plantaris muscle.
(A and C) Average group soleus oxygen consumption rate (OCR) traces using NADH as a substrate for euploid (Eu) and MAC21 male mice fed a standard chow or high-fat diet (HFD), respectively. (B and D) Average group soleus OCR traces using succinate as a substrate in the presence of rotenone (Rot) for euploid and MAC21 mice fed a standard chow or HFD, respectively. (E and G) Mitochondrial complex I and IV OCR quantification for A and C, respectively. (F and H) Mitochondrial complex II and IV OCR quantification for B and D, respectively. (I and K) Average group plantaris OCR traces using NADH as a substrate for euploid and MAC21 mice fed a standard chow or HFD, respectively. (J and L) Average group plantaris OCR traces using succinate as a substrate in the presence of Rot for euploid and MAC21 mice fed a standard chow or HFD, respectively. (M and O) Mitochondrial complex I and IV OCR quantification for I and K, respectively. (N and P) Mitochondrial complex II and IV OCR quantification for J and L, respectively. All mice used for respirometry were housed at ambient room temperature (22°C). AA, antimycin A; TMPD, N,N,N’,N’-tetramethyl-p-phenylenediamine; Acs, ascorbate; CI, mitochondrial complex I; CII, mitochondrial complex II; CIV, mitochondrial complex IV.
Figure 6—figure supplement 6.
Figure 6—figure supplement 6.. Mitochondrial respirometry analysis of extensor digitorum longus (EDL) and brown adipose tissue (BAT).
(A and C) Average group EDL oxygen consumption rate (OCR) traces using NADH as a substrate for euploid (Eu) and MAC21 male mice fed a standard chow or high-fat diet (HFD), respectively. (B and D) Average group EDL OCR traces using succinate as a substrate in the presence of rotenone (Rot) for euploid and MAC21 mice fed a standard chow or HFD, respectively. (E and G) Mitochondrial complex I and IV OCR quantification for A and C, respectively. (F and H) Mitochondrial complex II and IV OCR quantification for B and D, respectively. (I and K) Average group brown adipose tissue (BAT) OCR traces using NADH as a substrate for euploid and MAC21 mice fed a standard chow or HFD, respectively. (J and L) Average group BAT OCR traces using succinate as a substrate in the presence of Rot for euploid and MAC21 mice fed a standard chow or HFD, respectively. (M and O) Mitochondrial complex I and IV OCR quantification for I and K, respectively. (N and P) Mitochondrial complex II and IV OCR quantification for J and L, respectively. All mice used for respirometry were housed at ambient room temperature (22°C). AA, antimycin A; TMPD, N,N,N’,N’-tetramethyl-p-phenylenediamine; Acs, ascorbate; CI, mitochondrial complex I; CII, mitochondrial complex II; CIV, mitochondrial complex IV.
Figure 6—figure supplement 7.
Figure 6—figure supplement 7.. Mitochondrial respirometry analysis of liver and tongue.
(A and C) Average group liver oxygen consumption rate (OCR) traces using NADH as a substrate for euploid (Eu) and MAC21 male mice fed a standard chow or high-fat diet (HFD), respectively. (B and D) Average group liver OCR traces using succinate as a substrate in the presence of rotenone (Rot) for euploid and MAC21 mice fed a standard chow or HFD, respectively. (E and G) Mitochondrial complex I and IV OCR quantification for A and C, respectively. (F and H) Mitochondrial complex II and IV OCR quantification for B and D, respectively. (I and K) Average group tongue OCR traces using NADH as a substrate for euploid and MAC21 mice fed a standard chow or HFD, respectively. (J and L) Average group tongue OCR traces using succinate as a substrate in the presence of Rot for euploid and MAC21 mice fed a standard chow or HFD, respectively. (M and O) Mitochondrial complex I and IV OCR quantification for I and K, respectively. (N and P) Mitochondrial complex II and IV OCR quantification for J and L, respectively. All mice used for respirometry were housed at ambient room temperature (22°C). AA, antimycin A; TMPD, N,N,N’,N’-tetramethyl-p-phenylenediamine; Acs, ascorbate; CI, mitochondrial complex I; CII, mitochondrial complex II; CIV, mitochondrial complex IV.
Figure 6—figure supplement 8.
Figure 6—figure supplement 8.. Mitochondrial respirometry analysis of heart.
(A and C) Average group heart oxygen consumption rate (OCR) traces using NADH as a substrate for euploid (Eu) and MAC21 male mice fed a standard chow or high-fat diet (HFD), respectively. (B and D) Average group heart OCR traces using succinate as a substrate in the presence of rotenone (Rot) for euploid and MAC21 mice fed a standard chow or HFD, respectively. (E and G) Mitochondrial complex I and IV OCR quantification for A and C, respectively. (F and H) Mitochondrial complex II and IV OCR quantification for B and D, respectively. All mice used for respirometry were housed at ambient room temperature (22°C). AA, antimycin A; TMPD, N,N,N’,N’-tetramethyl-p-phenylenediamine; Acs, ascorbate; CI, mitochondrial complex I; CII, mitochondrial complex II; CIV, mitochondrial complex IV.
Figure 6—figure supplement 9.
Figure 6—figure supplement 9.. Mitochondrial respirometry analysis of inguinal (iWAT) and gonadal (gWAT) white adipose tissue.
(A and C) Average group iWAT oxygen consumption rate (OCR) traces using NADH as a substrate for euploid (Eu) and MAC21 male mice fed a standard chow or high-fat diet (HFD), respectively. (B and D) Average group liver OCR traces using succinate as a substrate in the presence of rotenone (Rot) for euploid and MAC21 mice fed a standard chow or HFD, respectively. (E and G) Mitochondrial complex I and IV OCR quantification for A and C, respectively. (F and H) Mitochondrial complex II and IV OCR quantification for B and D, respectively. (I and K) Average group gWAT OCR traces using NADH as a substrate for euploid and MAC21 mice fed a standard chow or HFD, respectively. (J and L) Average group gWAT OCR traces using succinate as a substrate in the presence of Rot for euploid and MAC21 mice fed a standard chow or HFD, respectively. (M and O) Mitochondrial complex I and IV OCR quantification for I and K, respectively. (N and P) Mitochondrial complex II and IV OCR quantification for J and L, respectively. All mice used for respirometry were housed at ambient room temperature (22°C). AA, antimycin A; TMPD, N,N,N’,N’-tetramethyl-p-phenylenediamine; Acs, ascorbate; CI, mitochondrial complex I; CII, mitochondrial complex II; CIV, mitochondrial complex IV.
Figure 7.
Figure 7.. Increased energy expenditure (EE) persists in TcMAC21 mice housed at thermoneutrality.
(A) Body weights of TcMAC21 mice and euploid controls housed at thermoneutrality (30°C) for 8 weeks. (B) Body composition analysis of absolute and relative (normalized to body weight) fat and lean mass. (C) Fasting insulin levels. (D–E) Absolute and relative (normalized to body weight) food intake. (F) EE in the dark and light cycles. *p<0.05 (two-way ANOVA). (G) EE as analyzed by ANCOVA where body weight was used as a covariate. Sample size for all data: euploid (n=5) and TcMAC21 (n=4–5).
Figure 7—figure supplement 1.
Figure 7—figure supplement 1.. Histology of high-fat diet (HFD)-fed euploid and MAC21 mice housed at thermoneutrality (30°C).
Representative hematoxylin and eosin (H&E)-stained sections of inguinal white adipose tissue (iWAT, A–B), gonadal white adipose tissue (gWAT, D and E), brown adipose tissue (BAT, H and I), liver (J and K), and pancreas (M and N). (C) Average iWAT adipocyte cross-sectional area (CSA) quantification. (F) Average gWAT adipocyte CSA quantification. (I) Average BAT area covered by lipid droplets per focal plane. (L) Average liver area covered by lipid droplets per focal plane. (O) Average pancreas β-islet CSA quantification. Sample size: euploid (n=5) and TcMAC21 (n=4).
Figure 8.
Figure 8.. Potential regulators of sarcolipin expression in skeletal muscle.
(A) Volcano plot of skeletal muscle transcriptome (transcripts from the mouse genome only). The lower dotted line denotes significance at the p-value cut-off (p=0.05), and the upper dotted line denotes significance at the adjusted p-value cut-off (adj. p=0.05). The vertical dotted lines denote a Log2(fold change [FC]) of –0.5 or 0.5. Flanking the volcano plot are the top down- and upregulated mouse genes. (B) Comparison of differentially expressed genes (DEGs) shared and not shared by TcMAC21 mice housed at 22°C vs. 30°C. Heat map showing all significantly up- or downregulated shared genes. (C) Direct comparison of TcMAC21 mice housed at 22°C and 30°C for most stably expressed mouse genes. Data filtered first by genes with Log2(FC) within ±0.5 (least change), then by lowest significance, and finally compared to the shared DEGs found in B. Table shows DEGs with least variation in expression at 22°C and 30°C. (D) Overlap analysis of Hsa21-derived human transcripts expressed in TcMAC21 mice (skeletal muscle) housed at 22°C and 30°C. (E) Graph showing the most stably expressed Hsa21-derived human genes in the TcMAC21 gastrocnemius. Top axis refers to the difference in Log2(FC) between human genes in TcMAC21 mice housed at 22°C and 30°C (data represented as black dots). Bottom axis shows the Log2(FC) value of a particular gene at 22°C and 30°C (data represented as a light blue-green or light red dot, respectively). The gene list shows all the human genes expressed by both groups with the least amount of change in expression between the two temperatures.
Author response image 1.

Update of

Similar articles

Cited by

References

    1. Acin-Perez R, Benador IY, Petcherski A, Veliova M, Benavides GA, Lagarrigue S, Caudal A, Vergnes L, Murphy AN, Karamanlidis G, Tian R, Reue K, Wanagat J, Sacks H, Amati F, Darley-Usmar VM, Liesa M, Divakaruni AS, Stiles L, Shirihai OS. A novel approach to measure mitochondrial respiration in frozen biological samples. The EMBO Journal. 2020;39:e104073. doi: 10.15252/embj.2019104073. - DOI - PMC - PubMed
    1. Antonarakis SE. Down syndrome and the complexity of genome dosage imbalance. Nature Reviews. Genetics. 2017;18:147–163. doi: 10.1038/nrg.2016.154. - DOI - PubMed
    1. Antonarakis SE, Skotko BG, Rafii MS, Strydom A, Pape SE, Bianchi DW, Sherman SL, Reeves RH. Down syndrome. Nature Reviews. Disease Primers. 2020;6:9. doi: 10.1038/s41572-019-0143-7. - DOI - PMC - PubMed
    1. Babu GJ, Bhupathy P, Carnes CA, Billman GE, Periasamy M. Differential expression of Sarcolipin protein during muscle development and cardiac pathophysiology. Journal of Molecular and Cellular Cardiology. 2007;43:215–222. doi: 10.1016/j.yjmcc.2007.05.009. - DOI - PMC - PubMed
    1. Bal NC, Maurya SK, Sopariwala DH, Sahoo SK, Gupta SC, Shaikh SA, Pant M, Rowland LA, Bombardier E, Goonasekera SA, Tupling AR, Molkentin JD, Periasamy M. Sarcolipin is a newly identified regulator of muscle-based Thermogenesis in mammals. Nature Medicine. 2012;18:1575–1579. doi: 10.1038/nm.2897. - DOI - PMC - PubMed

Publication types