

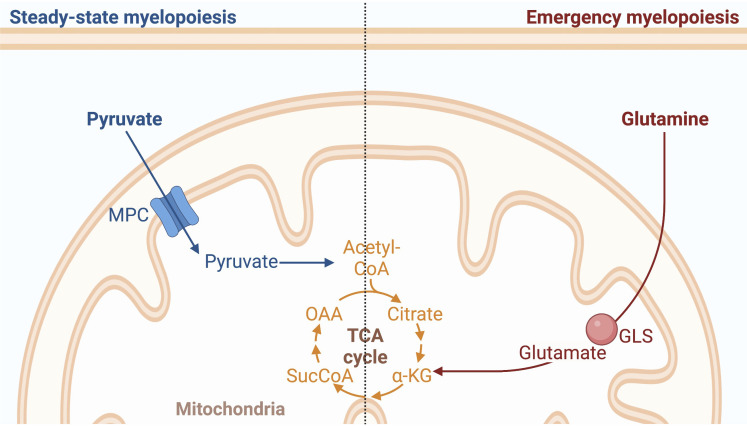
Mitochondrial pyruvate metabolism and glutaminolysis toggle steady-state and emergency myelopoiesis
- PMID: 37249600
- PMCID: PMC10227646
- DOI: 10.1084/jem.20221373
Mitochondrial pyruvate metabolism and glutaminolysis toggle steady-state and emergency myelopoiesis
Abstract
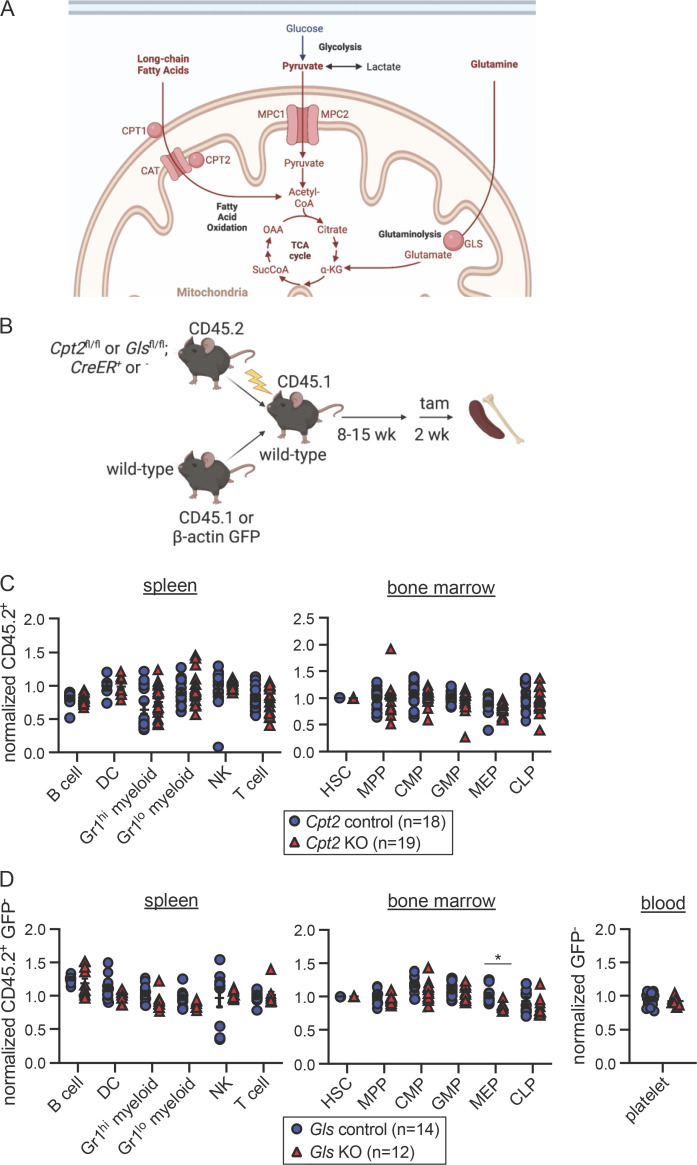
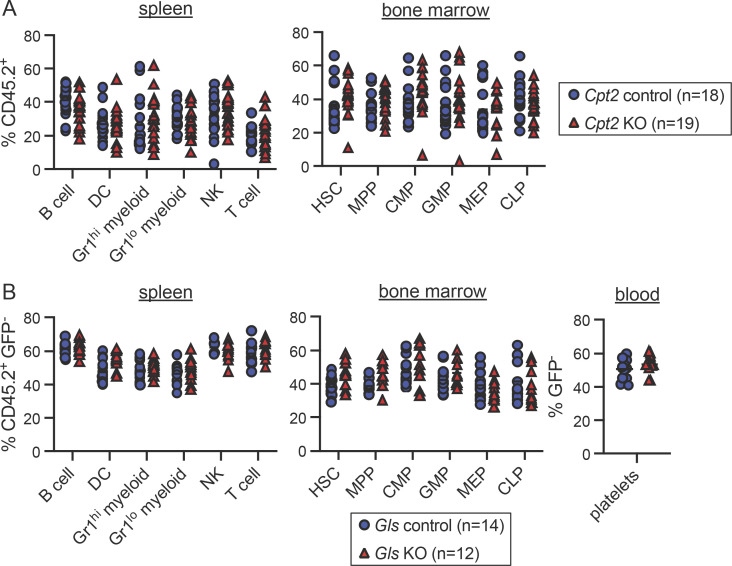
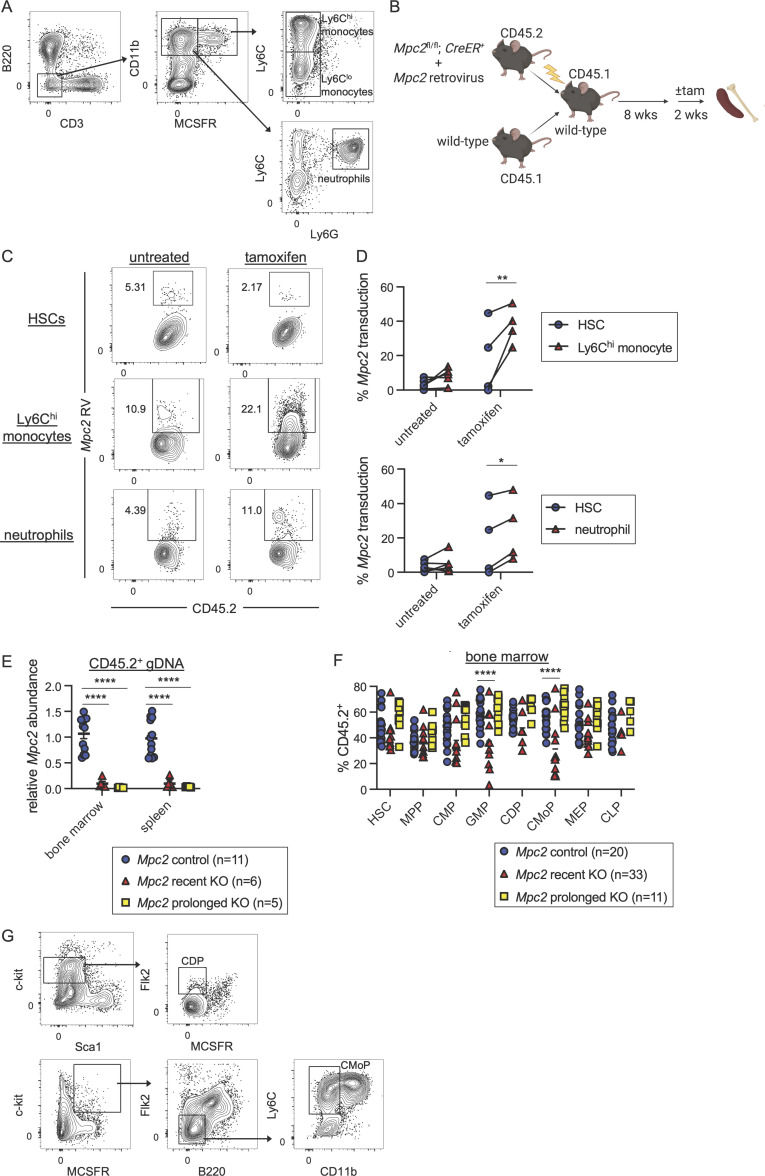
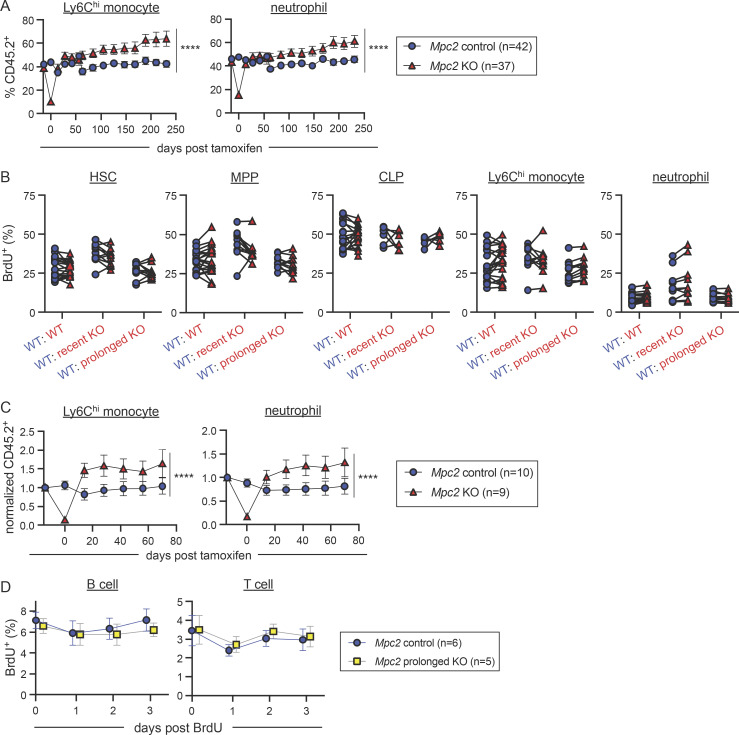
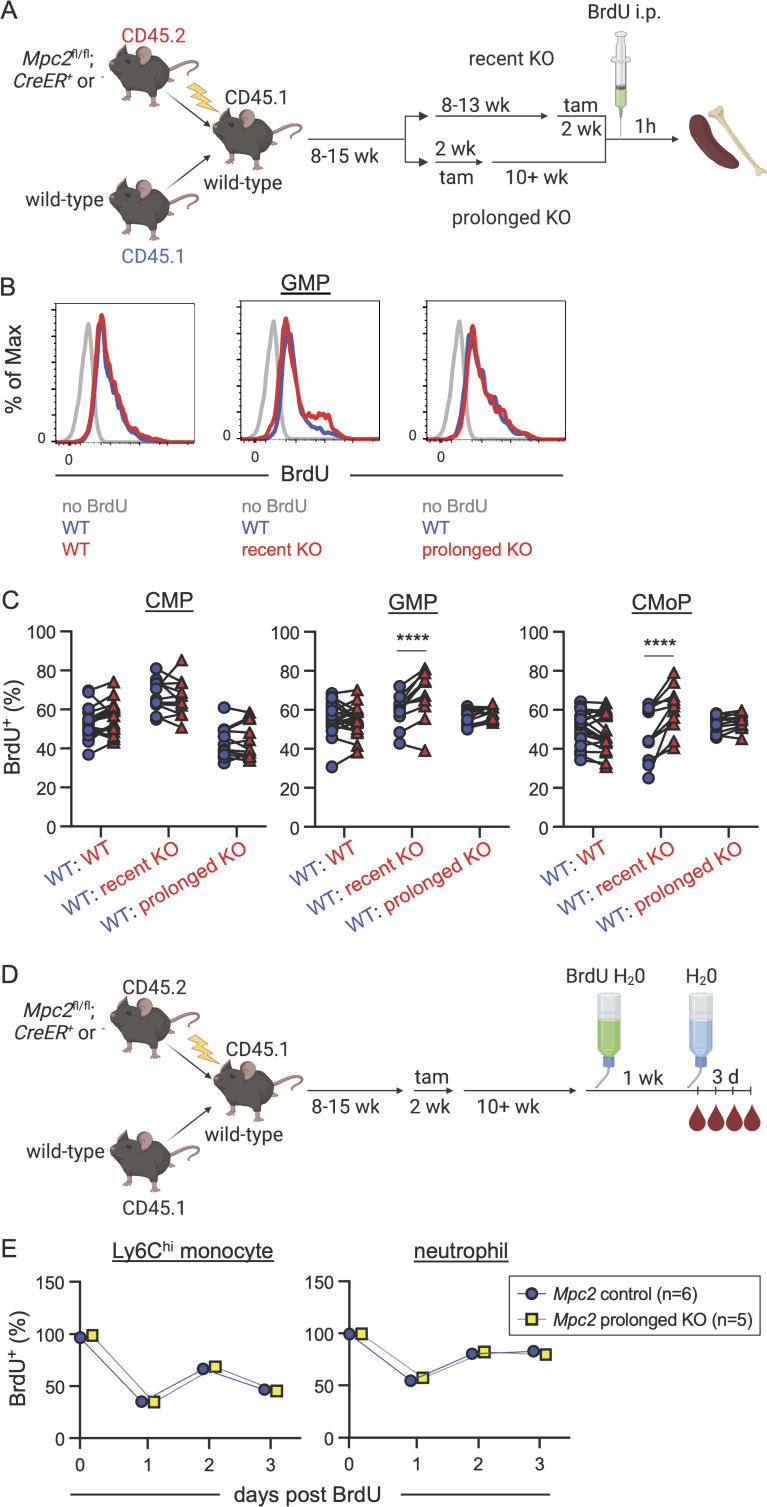
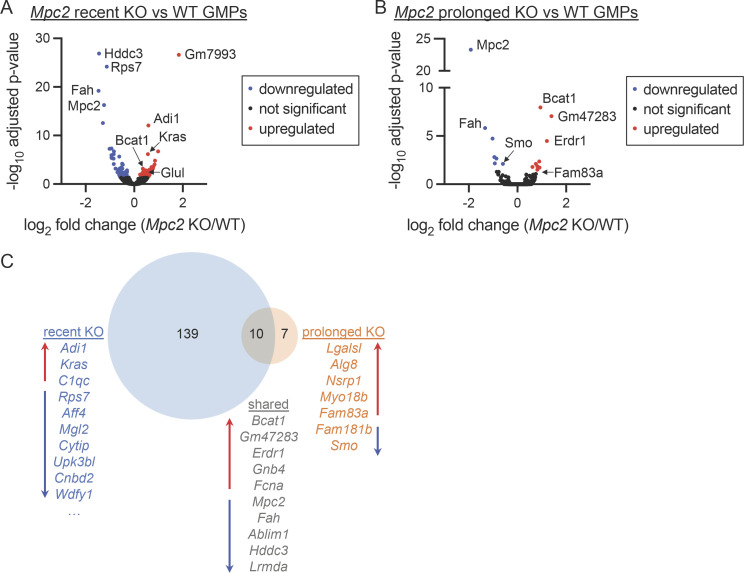
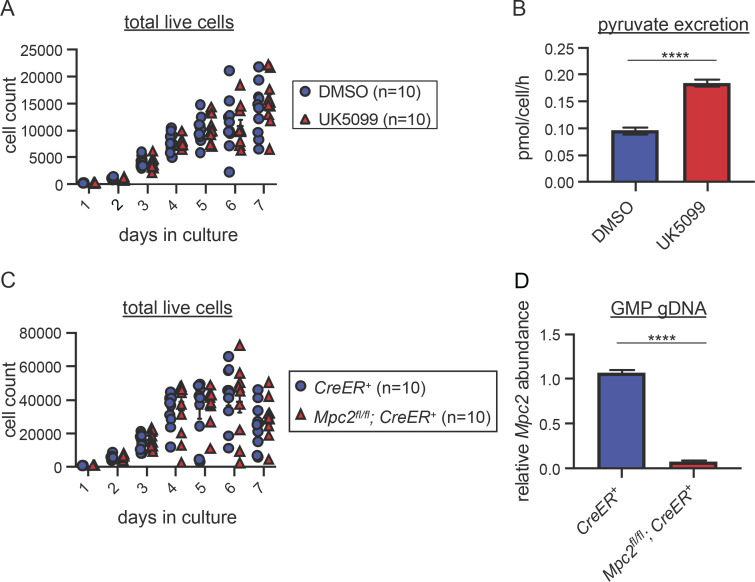
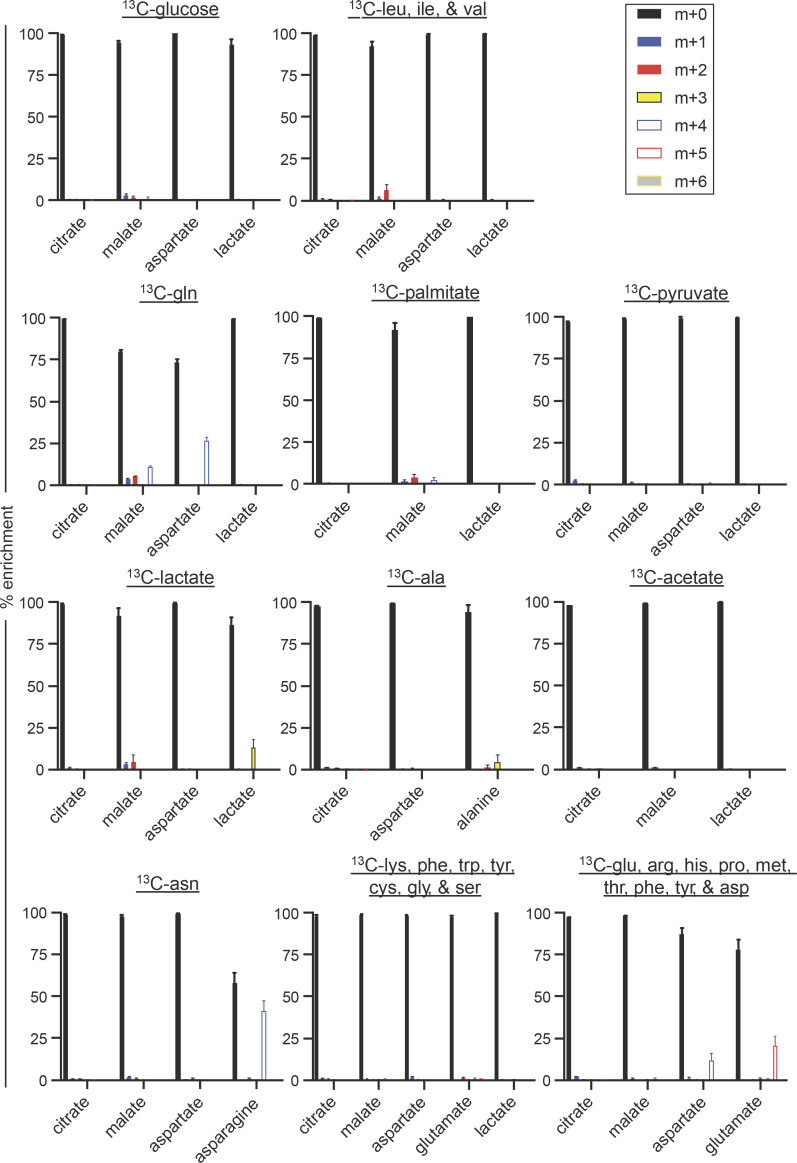
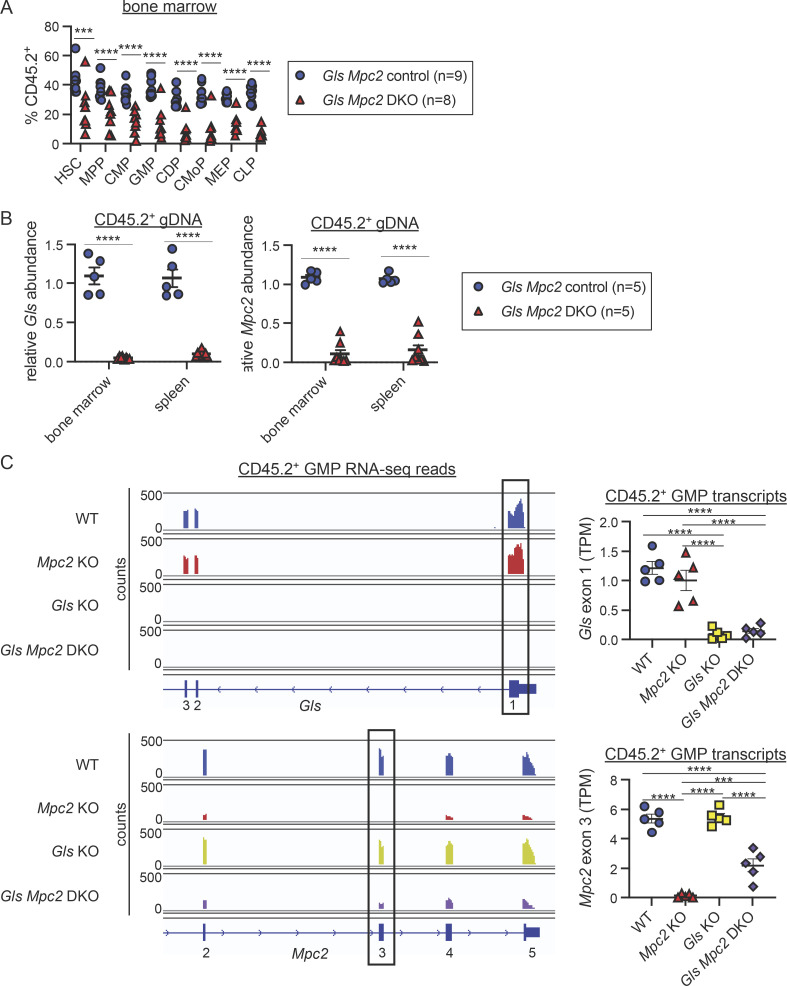
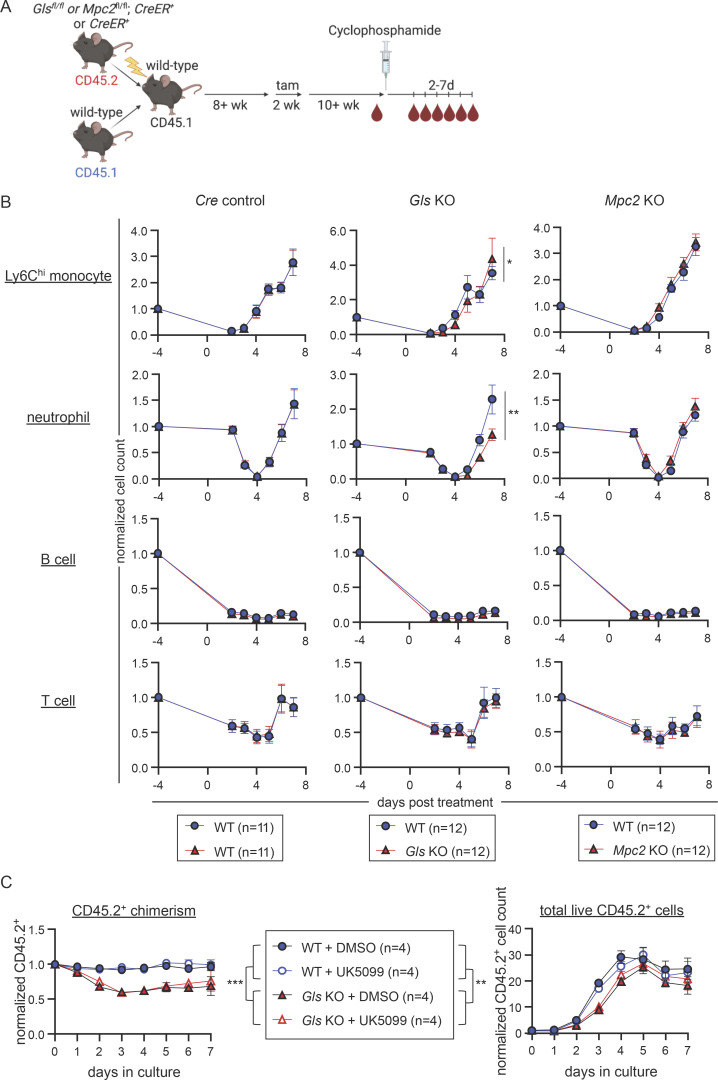
To define the metabolic requirements of hematopoiesis, we examined blood lineages in mice conditionally deficient in genes required for long-chain fatty acid oxidation (Cpt2), glutaminolysis (Gls), or mitochondrial pyruvate import (Mpc2). Genetic ablation of Cpt2 or Gls minimally impacted most blood lineages. In contrast, deletion of Mpc2 led to a sharp decline in mature myeloid cells and a slower reduction in T cells, whereas other hematopoietic lineages were unaffected. Yet MPC2-deficient monocytes and neutrophils rapidly recovered due to a transient and specific increase in myeloid progenitor proliferation. Competitive bone marrow chimera and stable isotope tracing experiments demonstrated that this proliferative burst was progenitor intrinsic and accompanied by a metabolic switch to glutaminolysis. Myeloid recovery after loss of MPC2 or cyclophosphamide treatment was delayed in the absence of GLS. Reciprocally, MPC2 was not required for myeloid recovery after cyclophosphamide treatment. Thus, mitochondrial pyruvate metabolism maintains myelopoiesis under steady-state conditions, while glutaminolysis in progenitors promotes emergency myelopoiesis.
© 2023 Pizzato et al.
Conflict of interest statement
Disclosures: H.A. Pizzato reported “other” from Sana Biotechnology outside the submitted work. B.N. Finck reported “other” from Cirius Therapeutics during the conduct of the study. G.J. Patti reported a collaborative research agreement with Agilent Technologies and Thermo Fisher Scientific and a financial relationship with Panome Bio. D. Bhattacharya reported personal fees from Clade Therapeutics, GlaxoSmithKline, Gilead Sciences, and Sana Biotechnology outside the submitted work. No other disclosures were reported.
Figures


References
-
- Adolfsson, J., Borge O.J., Bryder D., Theilgaard-Mönch K., Astrand-Grundström I., Sitnicka E., Sasaki Y., and Jacobsen S.E.. 2001. Upregulation of Flt3 expression within the bone marrow Lin(-)Sca1(+)c-kit(+) stem cell compartment is accompanied by loss of self-renewal capacity. Immunity. 15:659–669. 10.1016/s1074-7613(01)00220-5 - DOI - PubMed
Publication types
MeSH terms
Substances
Grants and funding
LinkOut - more resources
Full Text Sources
Molecular Biology Databases
Miscellaneous
