. 2023 Aug 1;83(15):2584-2599.
doi: 10.1158/0008-5472.CAN-22-3485.

Oncogenic Transformation Drives DNA Methylation Loss and Transcriptional Activation at Transposable Element Loci

Affiliations

Oncogenic Transformation Drives DNA Methylation Loss and Transcriptional Activation at Transposable Element Loci

Tomas Kanholm et al. Cancer Res. .

Abstract

Transposable elements (TE) are typically silenced by DNA methylation and repressive histone modifications in differentiated healthy human tissues. However, TE expression increases in a wide range of cancers and is correlated with global hypomethylation of cancer genomes. We assessed expression and DNA methylation of TEs in fibroblast cells that were serially transduced with hTERT, SV40, and HRASR24C to immortalize and then transform them, modeling the different steps of the tumorigenesis process. RNA sequencing and whole-genome bisulfite sequencing were performed at each stage of transformation. TE expression significantly increased as cells progressed through transformation, with the largest increase in expression after the final stage of transformation, consistent with data from human tumors. The upregulated TEs were dominated by endogenous retroviruses [long terminal repeats (LTR)]. Most differentially methylated regions (DMR) in all stages were hypomethylated, with the greatest hypomethylation in the final stage of transformation. A majority of the DMRs overlapped TEs from the RepeatMasker database, indicating that TEs are preferentially demethylated. Many hypomethylated TEs displayed a concordant increase in expression. Demethylation began during immortalization and continued into transformation, while upregulation of TE transcription occurred in transformation. Numerous LTR elements upregulated in the model were also identified in The Cancer Genome Atlas datasets of breast, colon, and prostate cancer. Overall, these findings indicate that TEs, specifically endogenous retroviruses, are demethylated and transcribed during transformation.

Significance: Analysis of epigenetic and transcriptional changes in a transformation model reveals that transposable element expression and methylation are dysregulated during oncogenic transformation.


Conflict of interest statement

Conflict of Interest Disclosure Statement: KBC is a consultant for Rome Therapeutics.

Figures

Figure 1 -
Figure 1 -. TE expression increases at the subfamily level during transformation
A) Model schematic. Early passage BJ fibroblast cells (EP) were sequentially infected with retrovirus packaged with pBabe-hygro-hTERT (hTERT), pBabe-zeo-SV40 large T genomic DNA (LT and ST antigens) (SV40) and pBabe-puro-HrasV12 (HRAS). B) Number of significantly differentially expressed TE subfamilies at each stage of transformation (Padj < .05, fold change greater than 2 or less than −2). Teal, upregulated elements; violet, downregulated elements. C) Class composition of significantly up and downregulated elements (Padj < .05, fold change greater than 2 or less than −2). Yellow, DNA elements; grey, LINE elements; light blue, LTR elements; dark blue, other. Other includes RC, Satellite, snRNA, tRNA, and Unknown. D) Overlap of upregulated elements in B between stages of transformation. Yellow, hTERT; red, SV40, blue, HRAS. E) Volcano plot showing log2 fold change between each stage and EP vs -log10 Padj. Yellow, DNA elements; grey, LINE elements; light blue, LTR elements; dark blue, other. Other includes RC, Satellite, snRNA, tRNA, and Unknown. Grey lines indicate Padj = .05 and fold change = 2 and −2. F) Fold change increase in LTR26 by qPCR. Pink, EP; yellow, hTERT; red, SV40; blue, HRAS. Error bars represent standard error of the mean. Stars represent statistically significant differences (*, p < 0.05; **, p < 0.01). N = 3 for each sample.
Figure 2 -
Figure 2 -. Locus specific TE expression increases during transformation
A) Number of significantly differentially expressed locus specific TEs at each stage of transformation (Padj < .05, fold change greater than 2 or less than −2). Teal, upregulated elements; violet, downregulated elements. B) Volcano plot showing log2 fold change between each stage and EP vs -log10 Padj. Grey, LINE elements; light blue, LTR elements. Grey lines indicate Padj = .05 and fold change = 2 and −2. C) Fold change increase in L1FLnI_1q25.1e by qPCR. Pink, EP; yellow, hTERT; red, SV40; blue, HRAS. Error bars represent standard error of the mean. Stars indicate statistically significant differences (p < 0.05). N = 3 for each sample. D) Class composition of significantly up and downregulated elements (Padj < .05, fold change greater than 2 or less than −2). Grey, LINE elements; light blue, LTR elements. E) Overlap of upregulated (left) and downregulated (right) elements in A between stages. Yellow, hTERT; red, SV40; blue, HRAS. hTERT is excluded from downregulated elements because no elements were significantly differentially expressed.
Figure 3 -
Figure 3 -. TEs are Demethylated During Transformation
A) Principal Component Analysis of CpG methylation for each sample sequenced. Colors from original MethylKit output have been modified for clarity (see Supplemental Figure S5A for original). B) Total number of differentially methylated loci (DMLs) at each stage of transformation compared to EP. Teal, hypermethylated; violet, hypomethylated. C) Total number of differentially methylated regions (DMRs) at each stage of transformation compared to EP. Teal, hypermethylated; violet, hypomethylated. D) Total number of differentially methylated regions (DMRs) that overlap with TEs from the RepeatMasker annotation set at each stage of transformation compared to EP. Teal, hypermethylated; violet, hypomethylated. E) Class composition of RepeatMasker TEs overlapping DMRs. Stars indicate statistically significant enrichment for each class (p < 0.05). Yellow, DNA elements; grey, LINE elements; light blue, LTR elements; green, SINE elements; dark blue, other. Other includes Low complexity, RC, Retroposon, RNA, rRNA, Satellite, scRNA, Simple Repeats, snRNA, srpRNA, tRNA, and Unknown.
Figure 4 -
Figure 4 -. Methylation correlates with TE expression at the subfamily and locus level
A) Total number of differentially methylated regions (DMRs) that overlap with TEs from the telescope annotation set at each stage of transformation compared to EP. Teal, hypermethylated; violet, hypomethylated. B) Class composition of telescope TEs overlapping DMRs. Grey, LINE elements; light blue, LTR elements C) Log2 fold change of TE subfamilies vs mean methylation change at DMRs overlapping elements in those subfamilies (left), overlapping 500 bp up and downstream of TSS (middle), and overlapping 1000 bp up and downstream of TSS (right). Yellow, DNA elements; grey, LINE elements; light blue, LTR elements; dark blue, other. Only significantly differentially expressed TE subfamilies are shown (Padj < .05, fold change greater than 2 or less than −2). D) Log2 fold change of locus-specific TEs vs methylation change at DMRs overlapping those elements (left), overlapping 500 bp up and downstream of TSS (middle), and overlapping 1000 bp up and downstream of TSS (right). Grey, LINE elements; light blue, LTR elements. Only significantly differentially expressed TEs are shown (Padj < .05, fold change greater than 2 or less than −2).
Figure 5 -
Figure 5 -. DNA methyltransferase and Histone methyltransferase expression increases during transformation
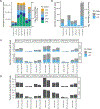
A) (Top) Western analysis of DNMT1 protein expression at each stage of transformation. (Middle) beta actin loading control. (Bottom) Relative protein levels as calculated by optical density (OD) of DNMT1 normalized to Beta Actin. EP, early passage BJ fibroblasts; 2–3, 2–4, 2–5, hTERT biological replicates; 3–3, 3–4, 3–5, SV40 biological replicates, 4–3, 4–4E, 4–5, HRAS biological replicates. Error bars represent standard deviation. Stars indicate significance (p < .05) B) Log2 fold change of DNA methyltransferases (DNMTs) at each stage of transformation. Teal, upregulated; violet, downregulated; grey, non-significant change in expression (Padj > .05). C) Log2 fold change of histone methyltransferases (HMTs) at each stage of transformation. Teal, upregulated; violet, downregulated; grey, non-significant change in expression (Padj > .05). D) (Top) Western analysis of histone H3 protein with methylated H3K9 (H3K9me) expression at each stage of transformation. (Middle) beta actin loading control. (Bottom) Relative protein levels as calculated by optical density (OD) of H3K9me normalized to Beta Actin. EP, early passage BJ fibroblasts; 2–3, 2–4, 2–5, hTERT biological replicates; 3–3, 3–4, 3–5, SV40 biological replicates, 4–3, 4–4E, 4–5, HRAS biological replicates. Error bars represent standard deviation. Stars indicate significance (p < .05).
Figure 6 –
Figure 6 –. Epigenetic landscape of TEs
A) RepeatMasker TEs containing DNase/ChIP-seq peaks in normal BJ Fibroblast. Yellow, DNA elements; grey, LINE elements; light blue, LTR elements; green, SINE elements; dark blue, other. Other includes Low complexity, RC, Retroposon, RNA, rRNA, Satellite, scRNA, Simple Repeats, snRNA, srpRNA, tRNA, and Unknown. B) Telescope TEs containing DNase/ChIP-seq peaks in normal BJ Fibroblast. Grey, LINE elements; light blue, LTR elements. Stars indicate statistically significant enrichment (p < 0.001). C) Telescope TEs up or downregulated in HRAS/SV40 containing DNase/ChIP-seq peaks in normal BJ fibroblast. Grey, LINE elements; light blue, LTR elements D) Percent of Telescope TEs up or downregulated in HRAS/SV40 containing DNase/ChIP-seq peaks in normal BJ fibroblast. Grey, LINE elements; light blue, LTR elements.
Figure 7 -
Figure 7 -. ERV-3 protein expression increases during transformation
A) Venn diagram of chimeric transcripts from upregulated genes detected in SV40/HRAS. Red numbers indicate the total number of upregulated genes in each group. Each chimeric transcript is named as follows: gene name, number of treatment samples with TE-derived transcription, number of control (EP) samples with TE-derived transcription, change in fraction of total gene expression stemming from TE-derived transcripts, change in mean gene expression. B) Log2 fold change increase of ERV3 and Syncitin-1 RNA levels at each stage compared to EP. Teal, significant increases in expression (Padj < .05); grey, non-significant increases in expression. C) (Top) Western analysis of ERV3 protein expression at each stage of transformation. (Middle) beta actin loading control. (Bottom) Average relative protein levels across replicates as calculated by optical density (OD) of ERV3 normalized to Beta Actin. Error bars show standard deviation. EP, early passage BJ fibroblasts; 2–3, 2–4, 2–5, hTERT biological replicates; 3–3, 3–4, 3–5, SV40 biological replicates, 4–3, 4–4E, 4–5, HRAS biological replicates. Stars indicate significance (*, p < .05; **, p < .01; ***, p < .001) D) (Top) Western analysis of Syncitin-1 protein expression at each stage of transformation. (Middle) beta actin loading control. (Bottom) Average relative protein levels across replicates as calculated by optical density (OD) of Syncytin-1 normalized to Beta Actin. Error bars show standard deviation. EP, early passage BJ fibroblasts; 2–3, 2–4, 2–5, hTERT biological replicates; 3–3, 3–4, 3–5, SV40 biological replicates, 4–3, 4–4E, 4–5, HRAS biological replicates. Changes were not statistically significant (p > .05). E) Log2 fold change of interferon stimulated gene (ISG) expression. Teal, upregulated, violet, downregulated, grey, not significant. F) Overlap of upregulated elements in each cancer type (TCGA-BRCA, TCGA-COAD, and TCGA-PRAD) that also overlap SV40/HRAS. Elements shared by all two or more cancer types are listed next to each diagram.

References

    1. Burns KH. Transposable elements in cancer. Nature Reviews Cancer. 2017;17:415–24. - PubMed
    1. Reid Cahn A, Bhardwaj N, Vabret N. Dark genome, bright ideas: Recent approaches to harness transposable elements in immunotherapies. Cancer Cell. 2022;40:792–7. - PubMed
    1. Kong Y, Rose CM, Cass AA, Williams AG, Darwish M, Lianoglou S, et al. Transposable element expression in tumors is associated with immune infiltration and increased antigenicity. Nature Communications. 2019;10:1–14. - PMC - PubMed
    1. Chiappinelli KB, Strissel PL, Desrichard A, Li H, Henke C, Akman B, et al. Inhibiting DNA methylation causes an interferon response in cancer via dsRNA including endogenous retroviruses. Cell. 2015;162:974–86. - PMC - PubMed
    1. Li H, Chiappinelli KB, Guzzetta AA, Easwaran H, Yen R-WC, Vatapalli R, et al. Immune regulation by low doses of the DNA methyltransferase inhibitor 5-azacitidine in common human epithelial cancers. Oncotarget. 2014;5:587–98. - PMC - PubMed

Publication types

Substances