. 2023 May 6;26(6):106829.
doi: 10.1016/j.isci.2023.106829. eCollection 2023 Jun 16.

microRNA-132 regulates gene expression programs involved in microglial homeostasis

Affiliations

microRNA-132 regulates gene expression programs involved in microglial homeostasis

Hannah Walgrave et al. iScience. .

Abstract

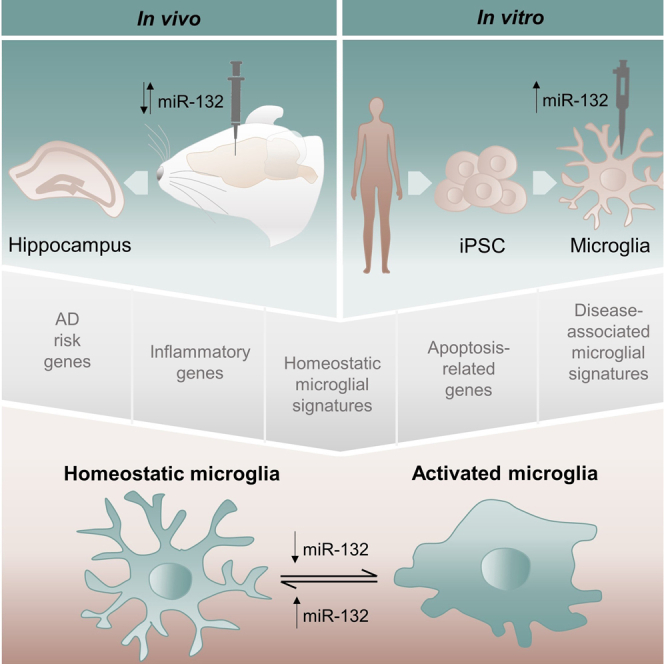
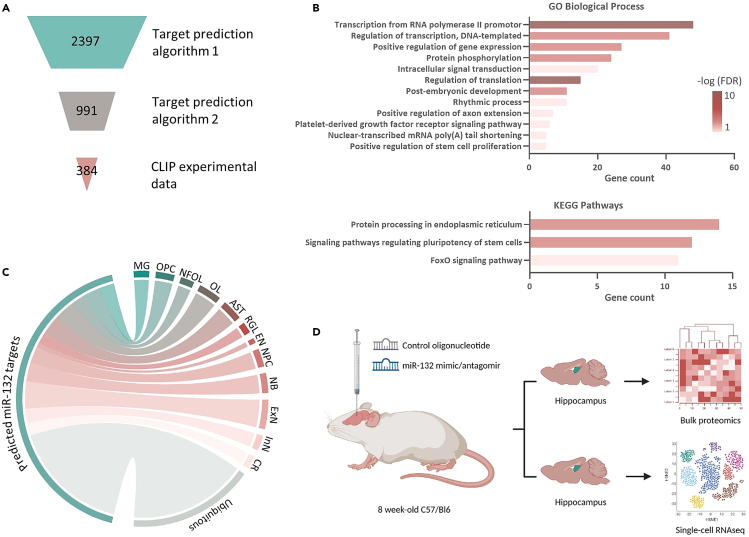
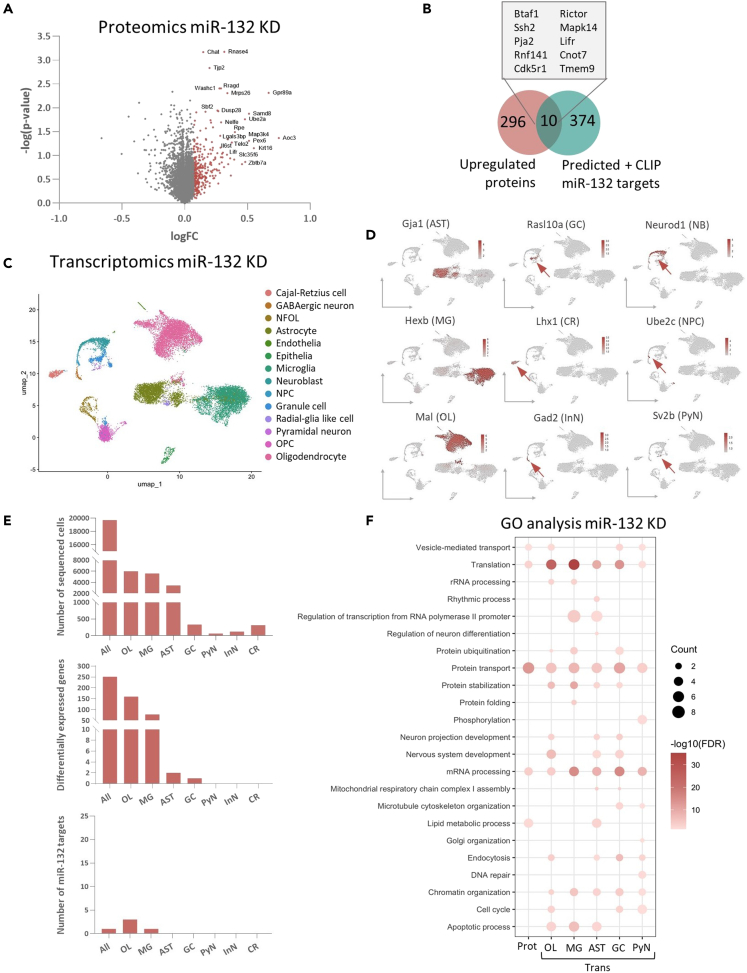
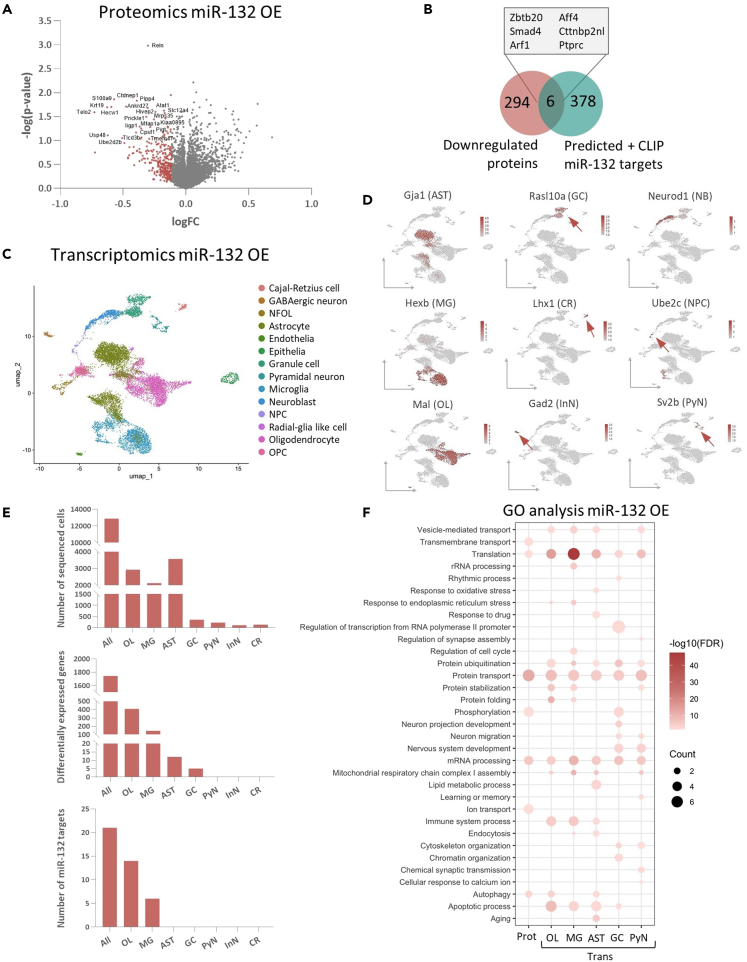
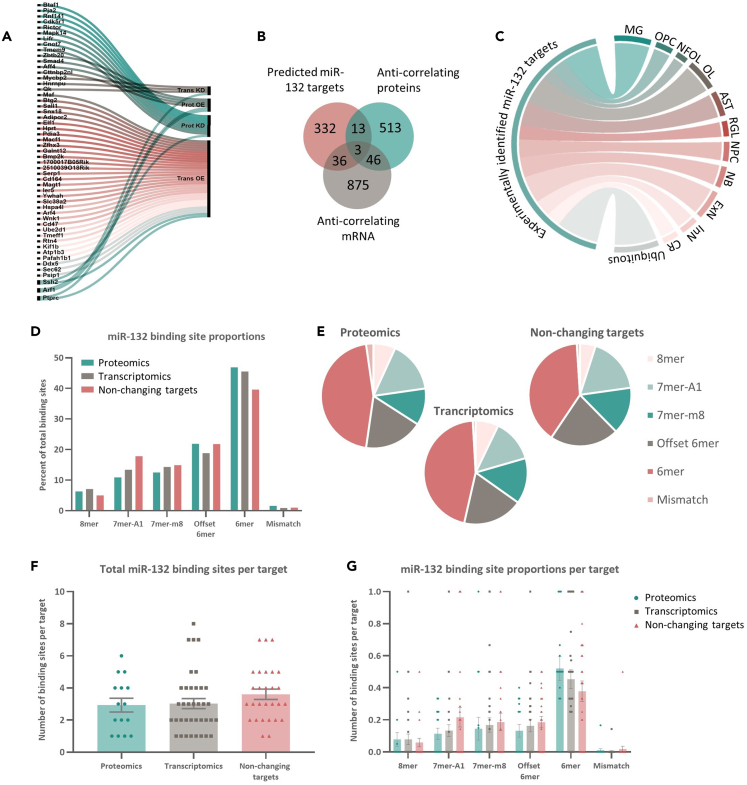
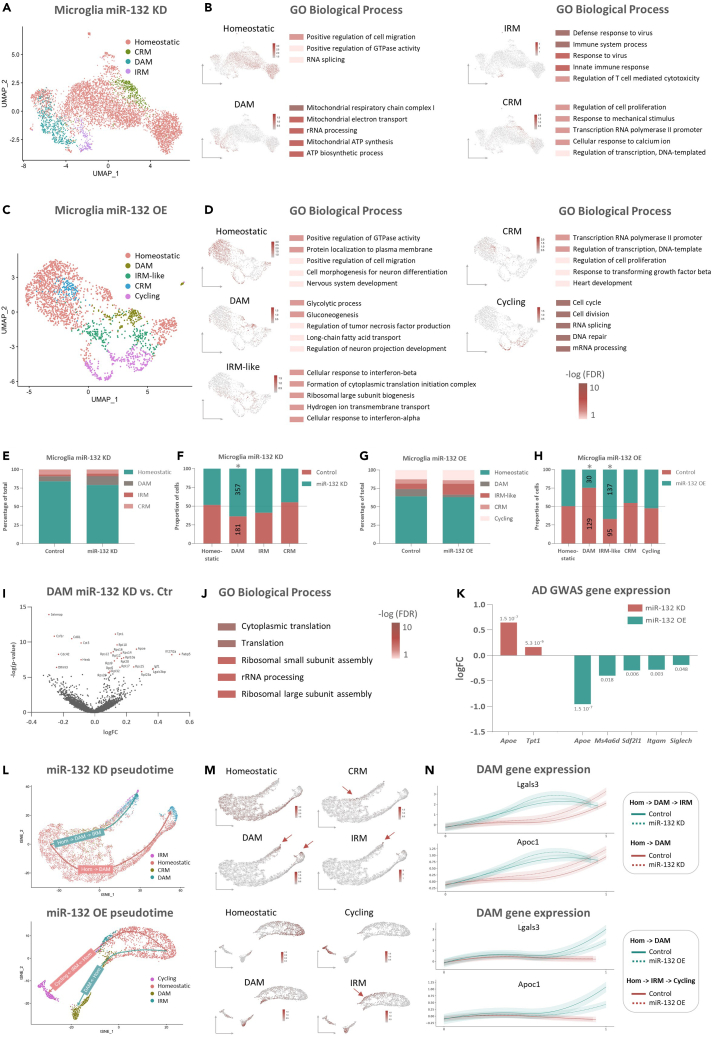
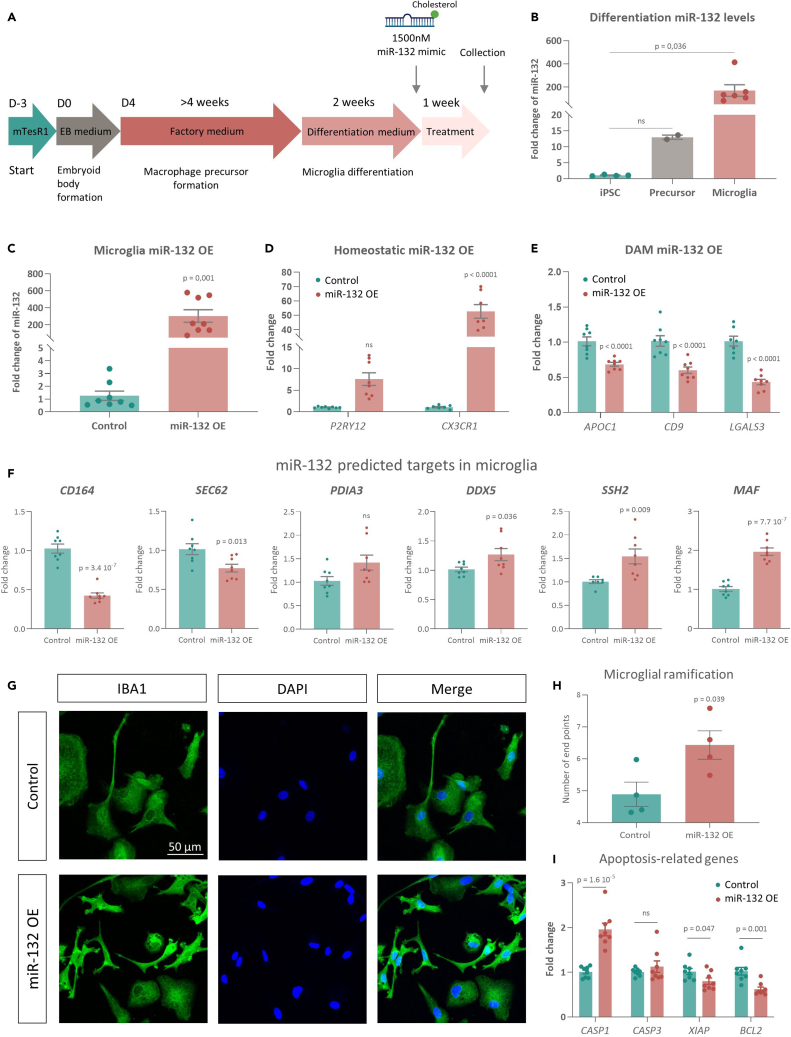
microRNA-132 (miR-132), a known neuronal regulator, is one of the most robustly downregulated microRNAs (miRNAs) in the brain of Alzheimer's disease (AD) patients. Increasing miR-132 in AD mouse brain ameliorates amyloid and Tau pathologies, and also restores adult hippocampal neurogenesis and memory deficits. However, the functional pleiotropy of miRNAs requires in-depth analysis of the effects of miR-132 supplementation before it can be moved forward for AD therapy. We employ here miR-132 loss- and gain-of-function approaches using single-cell transcriptomics, proteomics, and in silico AGO-CLIP datasets to identify molecular pathways targeted by miR-132 in mouse hippocampus. We find that miR-132 modulation significantly affects the transition of microglia from a disease-associated to a homeostatic cell state. We confirm the regulatory role of miR-132 in shifting microglial cell states using human microglial cultures derived from induced pluripotent stem cells.

Keywords: Molecular biology; Neuroscience; Omics.


Conflict of interest statement

L.Z. and D.M. are employees of Janssen Pharmaceutica.

Figures

None
Graphical abstract
Figure 1
Figure 1
Identification and possible function of miR-132 predicted targets in brain (A) Schematic representation of the identification strategy of predicted miR-132 targets, using an intersection of two target prediction algorithms and a high-confidence threshold for experimental data from AGO-CLIP-seq experiments. (B) All significantly enriched GO biological processes and KEGG pathways for 384 predicted miR-132 targets. Color indicates significance (Fisher’s Exact test, p values corrected with false discovery rate (FDR), adjusted p value <0.05 considered significant). (C) Circos plot depicting cell type-specific expression profiles of predicted miR-132 targets. (D) Schematic representation of experimental outline. MG, Microglia; OPC, oligodendrocyte precursor cell; NFOL, newly formed oligodendrocyte; OL, oligodendrocyte; AST, astrocyte; RGL, radial-glia like cell; EN, endothelia; NPC, neuronal precursor cell; NB, neuroblast; ExN, excitatory neuron; InN, inhibitory/GABAergic neuron; CR, Cajal-Retzius neuron. See also Table S1.
Figure 2
Figure 2
Impact of miR-132 depletion in the hippocampus (A) Differentially expressed proteins upon miR-132 KD presented in a volcano plot. The top 5% of proteins anticorrelated to miR-132 are indicated in red. (B) Identification of putative miR-132 targets from intersection with 5% most upregulated proteins and the list of identified predicted miR-132 targets. (C) UMAP visualization of 19,705 isolated mouse hippocampal miR-132 KD and corresponding control single-cell transcriptomes. Cells are colored by identified cell type. NFOL, newly formed oligodendrocyte; NPC, neuronal precursor cell; OPC, oligodendrocyte precursor cell. (D) UMAP plots colored by the normalized expression level of cell type-specific marker genes used for cluster annotation. Arrows indicate the cell cluster of interest. (E) Number of cells, number of significant DEGs (Wilcoxon rank-sum test using Bonferroni for p value correction, adjusted p value <0.05 considered significant), or amount of putative miR-132 targets identified by intersection with predicted miR-132 targets, as included in the scRNAseq analysis. Counts correspond to all cells pseudo-bulked together (All) or to each cell type. (F) GO biological processes significantly enriched in differentially expressed proteins (Prot) or genes (Trans) in distinct cell types. Count represents the % of included proteins/genes that are part of each process. Color represents significance, top 20 GO terms are displayed (Fisher’s Exact test, p values corrected with FDR, adjusted p value <0.05 considered significant). AST, astrocyte; GC, granule cell; NB, neuroblast; MG, microglia; CR, Cajal-Retzius neuron; NPC, neuronal precursor cell; OL, oligodendrocyte; InN, inhibitory/GABAergic neuron; PyN, hippocampal pyramidal neuron. See also Figures S1, S2, Tables S2, and S3.
Figure 3
Figure 3
Impact of miR-132 overexpression in hippocampal cells (A) Differentially expressed proteins upon miR-132 OE presented in a volcano plot. The top 5% of proteins anticorrelated to miR-132 are indicated in red. (B) Identification of putative miR-132 targets from intersection with 5% most downregulated proteins and the list of identified predicted miR-132 targets. (C) UMAP visualizing 12,893 isolated mouse hippocampal miR-132 OE and corresponding control single-cell transcriptomes. Cells are colored by identified cell type. NFOL, newly formed oligodendrocyte; NPC, neuronal precursor cell; OPC, oligodendrocyte precursor cell. (D) UMAP plots colored by the normalized expression levels of cell type-specific marker genes used for cluster annotation. Arrows indicate the cell cluster of interest. (E) Number of cells, number of significant DEGs (Wilcoxon rank-sum test using Bonferroni for p value correction, adjusted p value <0.05 considered significant), or amount of putative miR-132 targets identified by intersection with predicted miR-132 targets, as included in the scRNAseq analysis. Counts correspond to all cells pseudo-bulked together (All) or to each cell type. (F) GO biological processes significantly enriched in differentially expressed proteins (Prot) or genes (Trans) in distinct cell types. Count represents the % of included proteins/genes that are part of each process. Color represents significance, top 20 GO terms are displayed (Fisher’s Exact test, p values corrected with FDR, adjusted p value <0.05 considered significant). AST, astrocyte; GC, granule cell; NB, neuroblast; MG, microglia; CR, Cajal-Retzius neuron; NPC, neuronal precursor cell; OL, oligodendrocyte; InN, inhibitory/GABAergic neuron; PyN, hippocampal pyramidal neuron. See also Figures S1, S2, Tables S2, and S3.
Figure 4
Figure 4
Characterization of putative miR-132 targets and miR-132 binding sites (A) List of 52 experimentally identified miR-132 targets linked to the dataset they were derived from. Trans, Transcriptomics; Prot, Proteomics. (B) Identification of putative miR-132 targets from proteomic and transcriptomic datasets by intersection with the list of in silico predicted miR-132 targets (Figure 1A). (C) Circos plot showing cell type-specific expression of 52 identified putative miR-132 targets. (D and E) Percentage of different types of miR-132 binding sites present in miR-132 targets that are derived from proteomic (Proteomics) or transcriptomic (Transcriptomics) datasets, or that are predicted miR-132 targets but not changing in any of the datasets (Non-changing targets). (F) Each data point represents the total amount of miR-132 binding sites present per target. (G) Proportions of different types of binding sites present per target. Each data point represents the proportion of the indicated binding site type per target. Proteomics, N = 15; Transcriptomics, N = 37; Non-changing targets, N = 28. Values are presented as mean ± SEM. See also Table S1.
Figure 5
Figure 5
miR-132 drives microglial cell state transitions (A and C) Subset microglial population from miR-132 KD (A) or miR-132 OE (C) and corresponding control cells visualized on UMAP, colored according to identified clusters. (B and D) UMAP plots colored based on the signature score of the combined gene set that characterizes each individual microglial subpopulation in miR-132 KD (B) or miR-132 OE (D). Top 5 unique GO biological processes of significantly enriched genes are provided per subtype; color is indicated according to significance (Fisher’s Exact test, p values corrected with FDR, adjusted p value <0.05 considered significant). (E and G) Normalized percentage of cells present in distinct cellular states per condition in miR-132 KD (E) or miR-132 OE (G). (F and H) Normalized percentage of cells present in distinct cellular states per cellular state in miR-132 KD (F) or miR-132 OE (H). Significance indicated with an asterisk (Chi-squared test, miR-132 KD DAM: p value = 0.0062; miR-132 OE DAM: p value = 0.0000004; miR-132 OE IRM: p value = 0.0007). The number of cells present in miR-132 KD/OE or control condition is depicted on the graph. (I) Volcano plot showing DEGs comparing miR-132 KD cells to their corresponding controls in the DAM state. Significant DEGs indicated in red (Wilcoxon rank-sum test using Bonferroni for p value correction, adjusted p value <0.05 considered significant). (J) GO biological processes significantly enriched in the top 500 most DEGs, with color indicating significance (Fisher’s Exact test, p values corrected with FDR, adjusted p value <0.05 considered significant). (K) AD GWAS gene (adapted from153), p value cutoff set at 0.01) (Apoe, Tpt1, Ms4a6d, Sdf2l1, Itgam, Siglech) expression comparing miR-132 KD or OE cells with corresponding controls in the microglial population. Adjusted p values indicated (Wilcoxon rank-sum test using Bonferroni for p value correction, adjusted p value <0.05 considered significant). (L) Single-cell trajectories of microglial cells obtained by pseudotime ordering using Palantir. Color according to identified clusters. (M) UMAP plots colored based on the signature score of combined gene sets defining microglial cellular states. Arrows indicate populations of interest. (N) Gene expression of the DAM-associated genes Lgals3 and Apoc1 along pseudotime. Color represents the pseudotime branch and type of line the experimental condition. Homeostatic/Hom, homeostatic microglia; DAM, disease-associated microglia; IRM, interferon-response microglia; CRM, cytokine-response microglia; Cycling, cycling microglia. See also Figure S3 and Table S4.
Figure 6
Figure 6
Human iPSC-derived microglia acquire a homeostatic phenotype upon miR-132 supplementation (A) Schematic representation of the differentiation protocol of human iPSCs into microglia. Cells were treated with cholesterol-conjugated miR-132 mimic or corresponding control oligonucleotide (1500 nM) for one week. (B) Semi-quantitative real-time PCR of miR-132 levels along microglial differentiation. N = 2–6 biological replicates. (C) Semi-quantitative real-time PCR of miR-132 levels in differentiated microglia after one week of treatment with a miR-132 mimic. N = 8 biological replicates. (D and E) Semi-quantitative real-time PCR of marker genes characteristic of homeostatic microglia (P2RY12 and CX3CR1) (D) or DAM (APOC1, CD9 and LGALS3) (E) N = 7–8 biological replicates. (F) Semi-quantitative real-time PCR of predicted miR-132 targets identified in the scRNAseq miR-132 OE experiment, as either downregulated in the microglial population (SSH2, PDIA3, DDX5, SEC62) or in the pseudo-bulked cells and also highly expressed in microglia (MAF and CD164). N = 8 biological replicates. (G) Immunolabeling of IBA1 (green) and DAPI (blue) in miR-132- or control-treated iPSC-derived microglia. Merge indicates images obtained from overlaying images separately acquired with distinct channels. (H) Morphological analysis of miR-132- or control-treated human iPSC-derived microglia, as quantified by the number of endpoints per cell. Each data point represents the average number of endpoints of 50 quantified cells, derived from two independent iPSC-to-microglia differentiations. (I) Semi-quantitative real-time PCR of apoptosis-related genes comparing miR-132-treated human iPSC-derived microglia to controls. N = 8 biological replicates. Values are presented as mean ± SEM. In B, one-way ANOVA with Bonferroni correction was applied. In C, F and H, Student’s t test was used. In D, E and I two-way ANOVA with Tukey’s correction was used. See also Figure S1.

References

    1. Bartel D.P. MicroRNAs: target recognition and regulatory functions. Cell. 2009;136:215–233. doi: 10.1016/j.cell.2009.01.002. - DOI - PMC - PubMed
    1. Chen C.Y.A., Shyu A.-B. Mechanisms of deadenylation-dependent decay. Wiley Interdiscip. Rev. RNA. 2011;2:167–183. doi: 10.1002/wrna.40. - DOI - PMC - PubMed
    1. Jonas S., Izaurralde E. Towards a molecular understanding of microRNA-mediated gene silencing. Nat. Rev. Genet. 2015;16:421–433. doi: 10.1038/nrg3965. - DOI - PubMed
    1. Isik M., Blackwell T.K., Berezikov E. MicroRNA mir-34 provides robustness to environmental stress response via the DAF-16 network in C. elegans. Sci. Rep. 2016;6:36766. doi: 10.1038/srep36766. - DOI - PMC - PubMed
    1. Li X., Cassidy J.J., Reinke C.A., Fischboeck S., Carthew R.W. A MicroRNA imparts robustness against environmental fluctuation during development. Cell. 2009;137:273–282. doi: 10.1016/j.cell.2009.01.058. - DOI - PMC - PubMed