

Retinal imaging biomarkers of Alzheimer's disease: A systematic review and meta-analysis of studies using brain amyloid beta status for case definition
- PMID: 37250908
- PMCID: PMC10210353
- DOI: 10.1002/dad2.12421
Retinal imaging biomarkers of Alzheimer's disease: A systematic review and meta-analysis of studies using brain amyloid beta status for case definition
Abstract
Introduction: We performed a systematic review and meta-analysis of the association between retinal imaging parameters and Alzheimer's disease (AD).
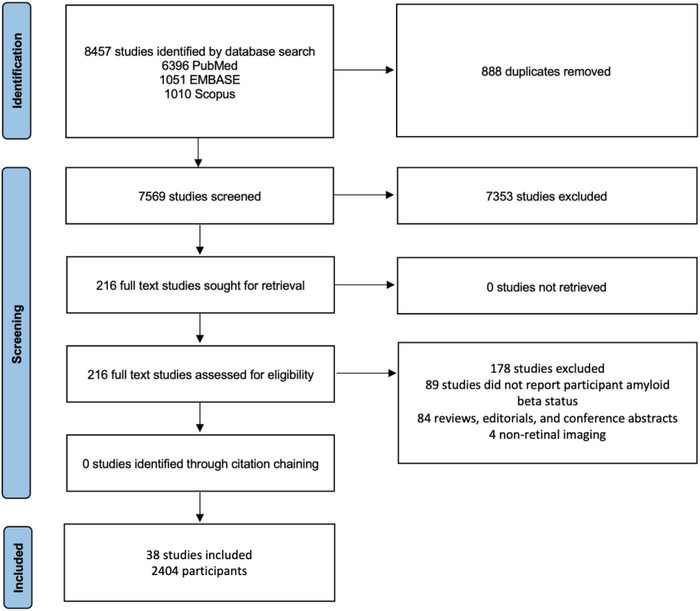
Methods: PubMed, EMBASE, and Scopus were systematically searched for prospective and observational studies. Included studies had AD case definition based on brain amyloid beta (Aβ) status. Study quality assessment was performed. Random-effects meta-analyses of standardized mean difference, correlation, and diagnostic accuracy were conducted.
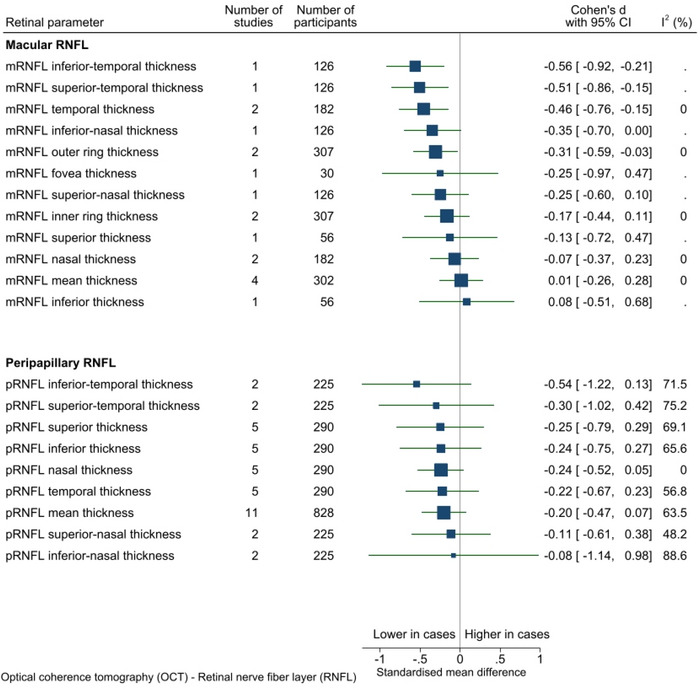
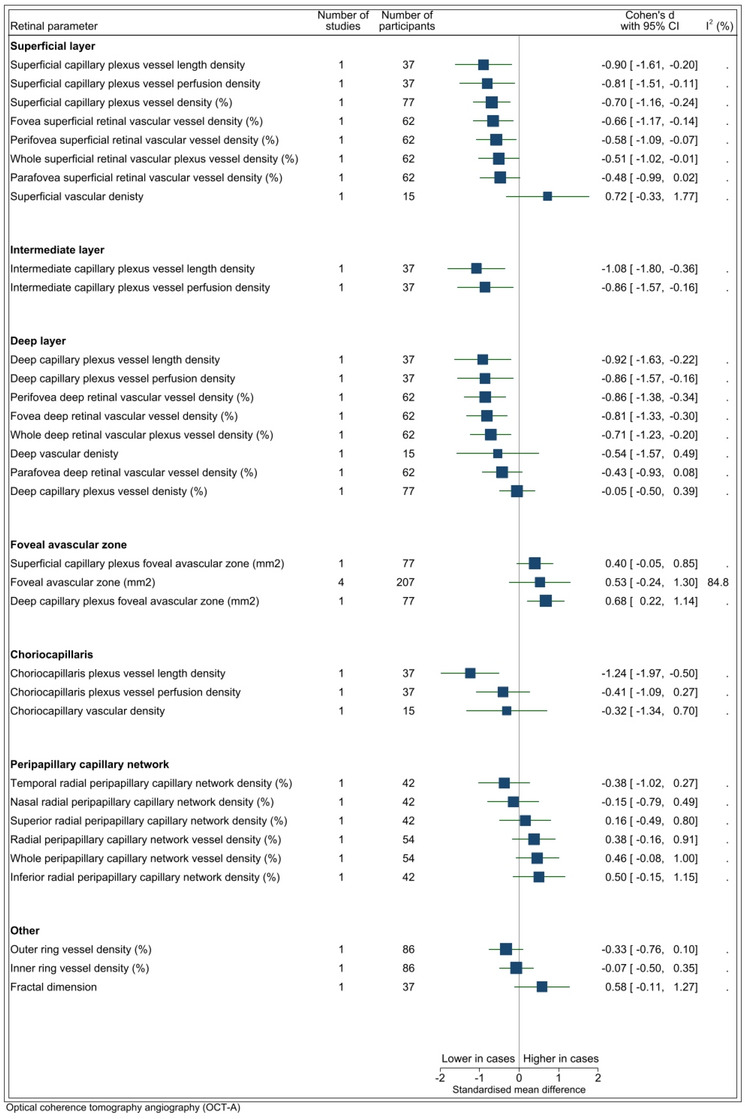
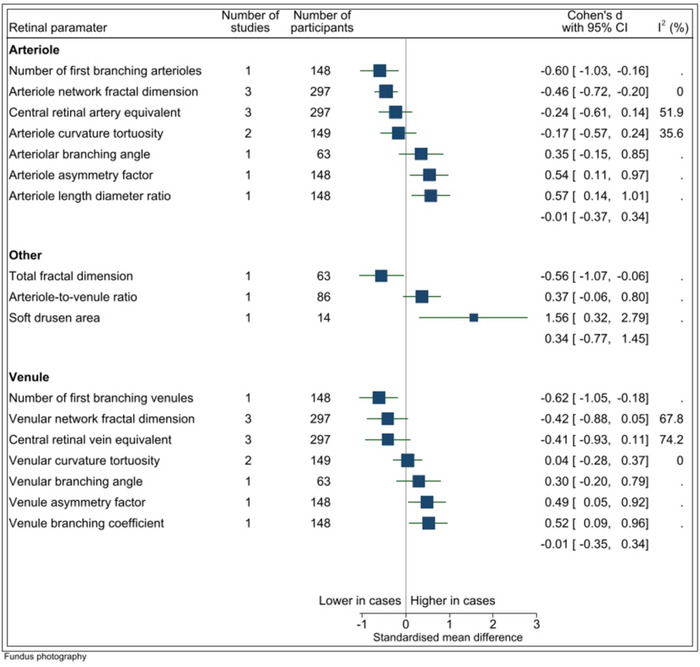
Results: Thirty-eight studies were included. There was weak evidence of peripapillary retinal nerve fiber layer thinning on optical coherence tomography (OCT) (p = 0.14, 11 studies, n = 828), increased foveal avascular zone area on OCT-angiography (p = 0.18, four studies, n = 207), and reduced arteriole and venule vessel fractal dimension on fundus photography (p < 0.001 and p = 0.08, respectively, three studies, n = 297) among AD cases.
Discussion: Retinal imaging parameters appear to be associated with AD. Small study sizes and heterogeneity in imaging methods and reporting make it difficult to determine utility of these changes as AD biomarkers.
Highlights: We performed a systematic review on retinal imaging and Alzheimer's disease (AD).We only included studies in which cases were based on brain amyloid beta status.Several retinal biomarkers were associated with AD but clinical utility is uncertain.Studies should focus on biomarker-defined AD and use standardized imaging methods.
Keywords: Alzheimer's disease; amyloid; biomarkers; dementia; early detection; fundus photography; hyperspectral imaging; optical coherence tomography; optical coherence tomography angiography; retina; retinal imaging.
© 2023 The Authors. Alzheimer's & Dementia: Diagnosis, Assessment & Disease Monitoring published by Wiley Periodicals, LLC on behalf of Alzheimer's Association.
Conflict of interest statement
Authors Xavier Hadoux and Peter van Wijngaarden have declared potential conflicts of interest ‐ principally that they are co‐founders and shareholders in a start‐up medical technology company related to retinal imaging biomarkers for Alzheimer's disease. These potential conflicts are described in the supporting information.
Figures
Similar articles
-
Optical coherence tomography and angiography in Alzheimer's disease and other cognitive disorders.Eur J Ophthalmol. 2023 Jul;33(4):1706-1717. doi: 10.1177/11206721221148952. Epub 2023 Jan 9. Eur J Ophthalmol. 2023. PMID: 36617984
-
Retinal Vasculopathy in Alzheimer's Disease.Front Neurosci. 2021 Sep 22;15:731614. doi: 10.3389/fnins.2021.731614. eCollection 2021. Front Neurosci. 2021. PMID: 34630020 Free PMC article. Review.
-
Ocular Biomarkers for Alzheimer Disease Dementia: An Umbrella Review of Systematic Reviews and Meta-analyses.JAMA Ophthalmol. 2023 Jan 1;141(1):84-91. doi: 10.1001/jamaophthalmol.2022.4845. JAMA Ophthalmol. 2023. PMID: 36394831
-
The application of optical coherence tomography angiography in Alzheimer's disease: A systematic review.Alzheimers Dement (Amst). 2021 Mar 3;13(1):e12149. doi: 10.1002/dad2.12149. eCollection 2021. Alzheimers Dement (Amst). 2021. PMID: 33718582 Free PMC article. Review.
-
The association between retina thinning and hippocampal atrophy in Alzheimer's disease and mild cognitive impairment: a meta-analysis and systematic review.Front Aging Neurosci. 2023 Aug 23;15:1232941. doi: 10.3389/fnagi.2023.1232941. eCollection 2023. Front Aging Neurosci. 2023. PMID: 37680540 Free PMC article.
Cited by
-
Non-Invasive Retinal Biomarkers for Early Diagnosis of Alzheimer's Disease.Biomedicines. 2025 Jan 24;13(2):283. doi: 10.3390/biomedicines13020283. Biomedicines. 2025. PMID: 40002697 Free PMC article. Review.
-
Identification of retinal oligomeric, citrullinated, and other tau isoforms in early and advanced AD and relations to disease status.Acta Neuropathol. 2024 Jul 9;148(1):3. doi: 10.1007/s00401-024-02760-8. Acta Neuropathol. 2024. PMID: 38980423 Free PMC article.
-
Ferritin nanocage-enabled detection of pathological tau in living human retinal cells.Sci Rep. 2024 May 21;14(1):11533. doi: 10.1038/s41598-024-62188-8. Sci Rep. 2024. PMID: 38773170 Free PMC article.
-
Retinal Microstructural and Microvascular Changes in Alzheimer Disease: A Review.Int Ophthalmol Clin. 2025 Jan 1;65(1):59-67. doi: 10.1097/IIO.0000000000000549. Epub 2024 Dec 23. Int Ophthalmol Clin. 2025. PMID: 39710907 Free PMC article. Review.
-
Assessment of individual retinal layer thickness and vascular changes in Alzheimer's disease.Sci Rep. 2025 May 19;15(1):17287. doi: 10.1038/s41598-025-02377-1. Sci Rep. 2025. PMID: 40389598 Free PMC article.
References
-
- Masters CL, Bateman R, Blennow K, Rowe CC, Sperling RA, Cummings JL. Alzheimer's disease. Nat Rev Dis Primers. 2015;1(1):15056. - PubMed
-
- 2021 Alzheimer's disease facts and figures. Alzheimers Dement. 2021;17(3):327‐406. - PubMed
-
- Mucke L. Alzheimer's disease. Nature. 2009;461(7266):895‐897. - PubMed
-
- Klatka LA, Schiffer RB, Powers JM, Kazee AM. Incorrect diagnosis of Alzheimer's disease: a clinicopathologic study. Arch Neurol. 1996;53(1):35‐42. - PubMed
-
- Ranginwala NA, Hynan LS, Weiner MF. Clinical criteria for the diagnosis of Alzheimer disease: still good after all these years. Am J Geriatr Psychiatry. 2008;16(5):384‐388. - PubMed
Publication types
LinkOut - more resources
Full Text Sources