. 2023 May 12:17:1181052.
doi: 10.3389/fnsys.2023.1181052. eCollection 2023.

Synaptic properties of mouse tecto-parabigeminal pathways

Affiliations

Synaptic properties of mouse tecto-parabigeminal pathways

Kyle L Whyland et al. Front Syst Neurosci. .

Abstract

The superior colliculus (SC) is a critical hub for the generation of visually-evoked orienting and defensive behaviors. Among the SC's myriad downstream targets is the parabigeminal nucleus (PBG), the mammalian homolog of the nucleus isthmi, which has been implicated in motion processing and the production of defensive behaviors. The inputs to the PBG are thought to arise exclusively from the SC but little is known regarding the precise synaptic relationships linking the SC to the PBG. In the current study, we use optogenetics as well as viral tracing and electron microscopy in mice to better characterize the anatomical and functional properties of the SC-PBG circuit, as well as the morphological and ultrastructural characteristics of neurons residing in the PBG. We characterized GABAergic SC-PBG projections (that do not contain parvalbumin) and glutamatergic SC-PBG projections (which include neurons that contain parvalbumin). These two terminal populations were found to converge on different morphological populations of PBG neurons and elicit opposing postsynaptic effects. Additionally, we identified a population of non-tectal GABAergic terminals in the PBG that partially arise from neurons in the surrounding tegmentum, as well as several organizing principles that divide the nucleus into anatomically distinct regions and preserve a coarse retinotopy inherited from its SC-derived inputs. These studies provide an essential first step toward understanding how PBG circuits contribute to the initiation of behavior in response to visual signals.

Keywords: GABA; electron microscopy; nucleus isthmi; optogenetics; parabigeminal nucleus; parvalbumin; superior colliculus; tectum.


Conflict of interest statement

The authors declare that the research was conducted in the absence of any commercial or financial relationships that could be construed as a potential conflict of interest.

Figures
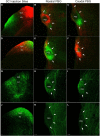
FIGURE 1
FIGURE 1
SC-PBG projection patterns. The left column illustrates SC injection sites that labeled axons in the rostral (middle column) and caudal (right column) PBG (perimeter indicated by white arrows). All sections are shown in the coronal plane. (A) An AAV that expresses tdTomato injected in the medial SC labels projections primarily to the rostral PBG (B), while an AAV injection that expresses GFP in the lateral SC labels projections primarily to the caudal PBG (C). (D) An AAV targeted to the caudal SC that expresses tdTomato primarily labels projections to the caudal PBG (F), while an AAV injected into the rostral SC that expresses GFP mostly labels projections to the rostral PBG (E). (G) A cre-dependent AAV that expresses GFP injected into the SC of a PV-cre mouse labels a dense population of PV cells and their projections to the rostral and caudal PBG [(H,I), respectively]. (J) A cre-dependent AAV that expresses GFP injected into the SC of a GAD2-cre mouse labels a dense population of GABAergic neurons in the SC and their projections to both the rostral and caudal PBG [(K,L), respectively]. SGS, stratum griseum superficiale; SO, stratum opticum. Scale bars = 50 μm in all panels.
FIGURE 2
FIGURE 2
Ultrastructure and distribution of GABAergic and non-GABAergic terminals in the “core” and “shell” regions of the PBG. (A) A GABAergic (high density of overlying gold particles) BDA-labeled (dark reaction product) synaptic terminal (green) originating from the SC synapses (white arrow) with a non-GABAergic dendrite (low density of overlying gold particles) in the PBG. (B) A non-GABAergic BDA-labeled terminal originating from the SC (blue) synapses (white arrow) on a non-GABAergic dendrite in the PBG. A nearby GABAergic (green) terminal synapses with a non-GABAergic dendrite (black arrow). (C–E) Examples of GABAergic (green) and non-GABAergic (blue) terminals in the PBG. Synapses indicated with black arrows. (F) Low magnification image of the PBG “core” in an ultrathin section that was analyzed for GABAergic and non-GABAergic axon terminal density. (G) Same image as in panel (F) but with labeling showing the approximate location of identified GABAergic terminals (green dots) and non-GABAergic terminals (blue dots). The yellow ellipse denotes the approximate boundary of the PBG “core”. Scale bars in panels (A–E) = 600 nm, (F,G) = 8 μm.
FIGURE 3
FIGURE 3
GAD67 neurons provide a source of non-tectal GABAergic terminals in the PBG. (A) Low magnification confocal image of numerous GAD67 neurons (green) fluorescently labeled with GFP in the GAD67-GFP reporter mouse, occupying areas of the brainstem just medial to the PBG (perimeter denoted by white arrows) which is also labeled with an antibody against the vesicular GABA transporter (VGAT, magenta). (B) High magnification confocal image of GAD67 (green) and VGAT + (magenta) fibers intermingled in the PBG, with many fibers clearly co-labeled (white). (C) Same image as in panel (B) but with only GAD67 fibers shown. (D) Same image as in panel (B) but with only antibody labeled VGAT + fibers shown. (E,F) Two other confocal images of the PBG from a GAD67-GFP mouse. GFP-labeled fibers are seen throughout the nucleus as well as a few GAD67 + somata. Scale bar in panel (A) = 100 μm, (B–F) = 20 μm.
FIGURE 4
FIGURE 4
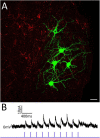
The tegmentum surrounding the PBG provides sparse GABAergic input to the PBG. Panel (A) illustrates 5 PBG neurons (green) that were filled with biocytin during recording and optogenetic activation of GABAergic axons and terminals originating from the surrounding tegmentum (red). Only one of these neurons (asterisk) responded with inhibitory postsynaptic currents (B) during photoactivation of GABAergic tegmental terminals. PBG neurons recorded in other slices were also non-responsive to tegmental input.
FIGURE 5
FIGURE 5
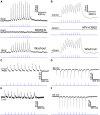
Optogenetic activation of GABAergic and glutamatergic SC-PBG terminals in GAD2-cre and PV-cre mice. Panel (A) shows a current trace from an in vitro whole-cell patch clamp experiment in which a cre-dependent AAV that expresses the light-sensitive cation channel, Channelrhodopsin, was injected into the SC of a GAD2-cre mouse. Optical stimulation of axon terminals in the tissue slice with 1 ms pulses of blue light reliably produces IPSCs (top trace) in the patched neuron that can be extinguished [middle trace of panel (A)] via the administration of the selective GABA-A antagonist SR95531 into the circulating ACSF, confirming the presence of GABAergic inputs to the PBG. After washing out this antagonist, the same cell resumes IPSC responses to optical stimulation [bottom trace of panel (A)]. Panel (B) shows a voltage trace from a similar experiment in which a cre-dependent AAV was injected into the SC of a PV-cre mouse. Optical stimulation of axon terminals in the tissue slice reliably evoked EPSPs that could be silenced with the administration of the NMDA and AMPA blockers, APV and CNQX, confirming that PV + SC-PBG projections are glutamatergic. Washing out these antagonists recovered the excitatory responses seen in the first trace of panel (B) [bottom trace of panel (B)]. (C) An example current trace demonstrates patch-clamp experiments in which a non-cre-dependent AAV was injected into the SC (thus infecting all neuronal cell-types). Both IPSCs (C) and EPSCs (D) can be reliably evoked depending on whether the cell is held at 0 mV (C) or –60 mV (D). (E,F) Voltage traces from another example recorded neuron in which both IPSCs and EPSCs could be reliably evoked via optical stimulation of axon terminals originating from the SC.
FIGURE 6
FIGURE 6
Biocytin-filled PBG cells exhibit a variety of neuronal morphologies. (A–I) The addition of biocytin to the internal recording solution in the whole-cell in vitro physiology experiments enabled the visualization of recorded cells (green). The recorded PBG cells are surrounded by terminals labeled via virus injections in the SC (red). Scale bars = 50 μm for all panels.
FIGURE 7
FIGURE 7
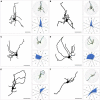
Classification of PBG morphological cell types. (A,B) Example traces from biocytin-filled PBG neurons classified as stellate can be seen in the large panels, accompanied to the right by their respective Scholl ring diagrams (top, small panels) and radar orientation plots (bottom, small panels), demonstrating how their morphological characteristics were quantified for each. Neurons where 4 contiguous radial sections always comprised 20% or more of the total Scholl ring crossings were considered stellate. (C,D) Example traces of PBG neurons classified as asymmetric. Asymmetric cells had 4 contiguous radial sections comprising less than 20% of the total Scholl ring crossings. (E,F) Example traces of PBG neurons classified as narrow field, with one example of an asymmetric narrow field cell (E) and one example of a symmetric narrow field cell (F). Narrow field cells had two radial sections on opposite sides comprising more than 50% of the total Scholl ring crossings.

References

    1. Allen K., Gonzalez-Olvera R., Kumar M., Feng T., Pieraut S., Hoy J. L. (2022). A binocular perception deficit characterizes prey pursuit in developing mice. IScience 25:105368. 10.1016/j.isci.2022.105368 - DOI - PMC - PubMed
    1. Appell P. P., Behan M. (1990). Sources of subcortical GABAergic projections to the superior colliculus in the cat. J. Comp. Neurol. 302 143–158. 10.1002/cne.903020111 - DOI - PubMed
    1. Asadollahi A., Knudsen E. I. (2016). Spatially precise visual gain control mediated by a cholinergic circuit in the midbrain attention network. Nat. Commun. 7:13472. 10.1038/ncomms13472 - DOI - PMC - PubMed
    1. Asadollahi A., Mysore S. P., Knudsen E. I. (2010). Stimulus-driven competition in a cholinergic midbrain nucleus. Nat. Neurosci. 13 889–895. 10.1038/nn.2573 - DOI - PMC - PubMed
    1. Baizer J. S., Whitney J. F., Bender D. B. (1991). Bilateral projections from the parabigeminal nucleus to the superior colliculus in monkey. Exp. Brain Res. 86 467–470. 10.1007/BF00230521 - DOI - PubMed

LinkOut - more resources